. 2021 Sep;597(7875):285-289.
doi: 10.1038/s41586-021-03856-x. Epub 2021 Sep 1.

Structural basis for piRNA targeting

Affiliations

Structural basis for piRNA targeting

Todd A Anzelon et al. Nature. 2021 Sep.

Abstract

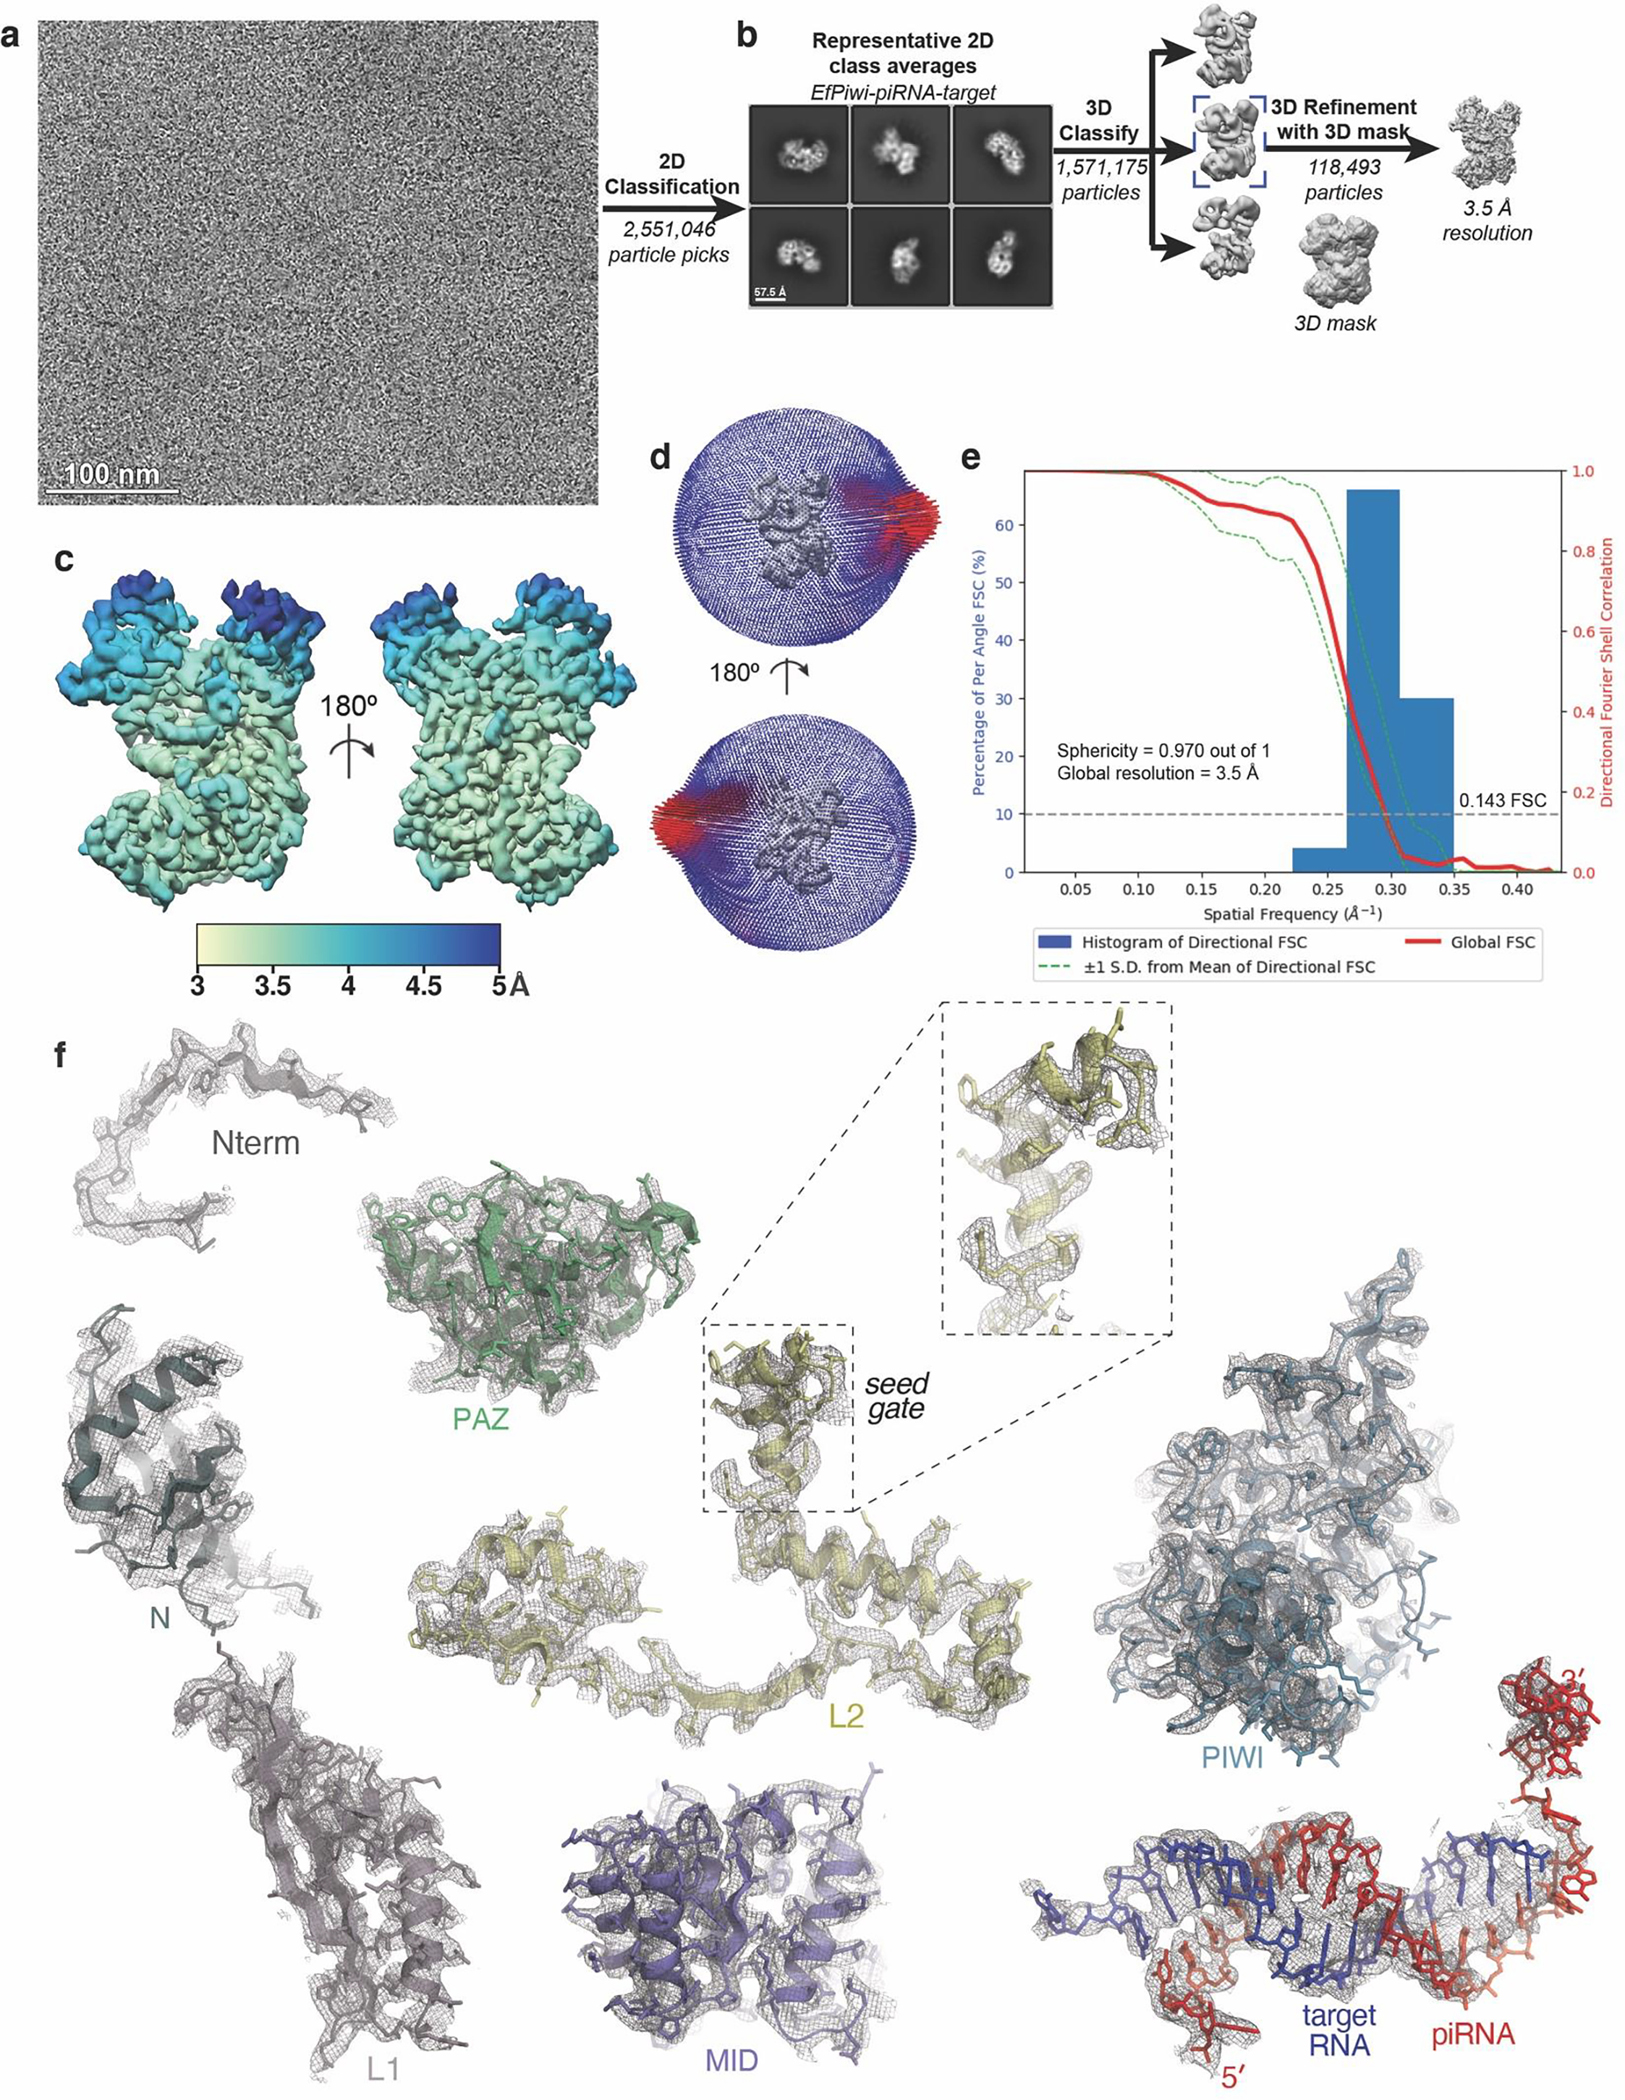
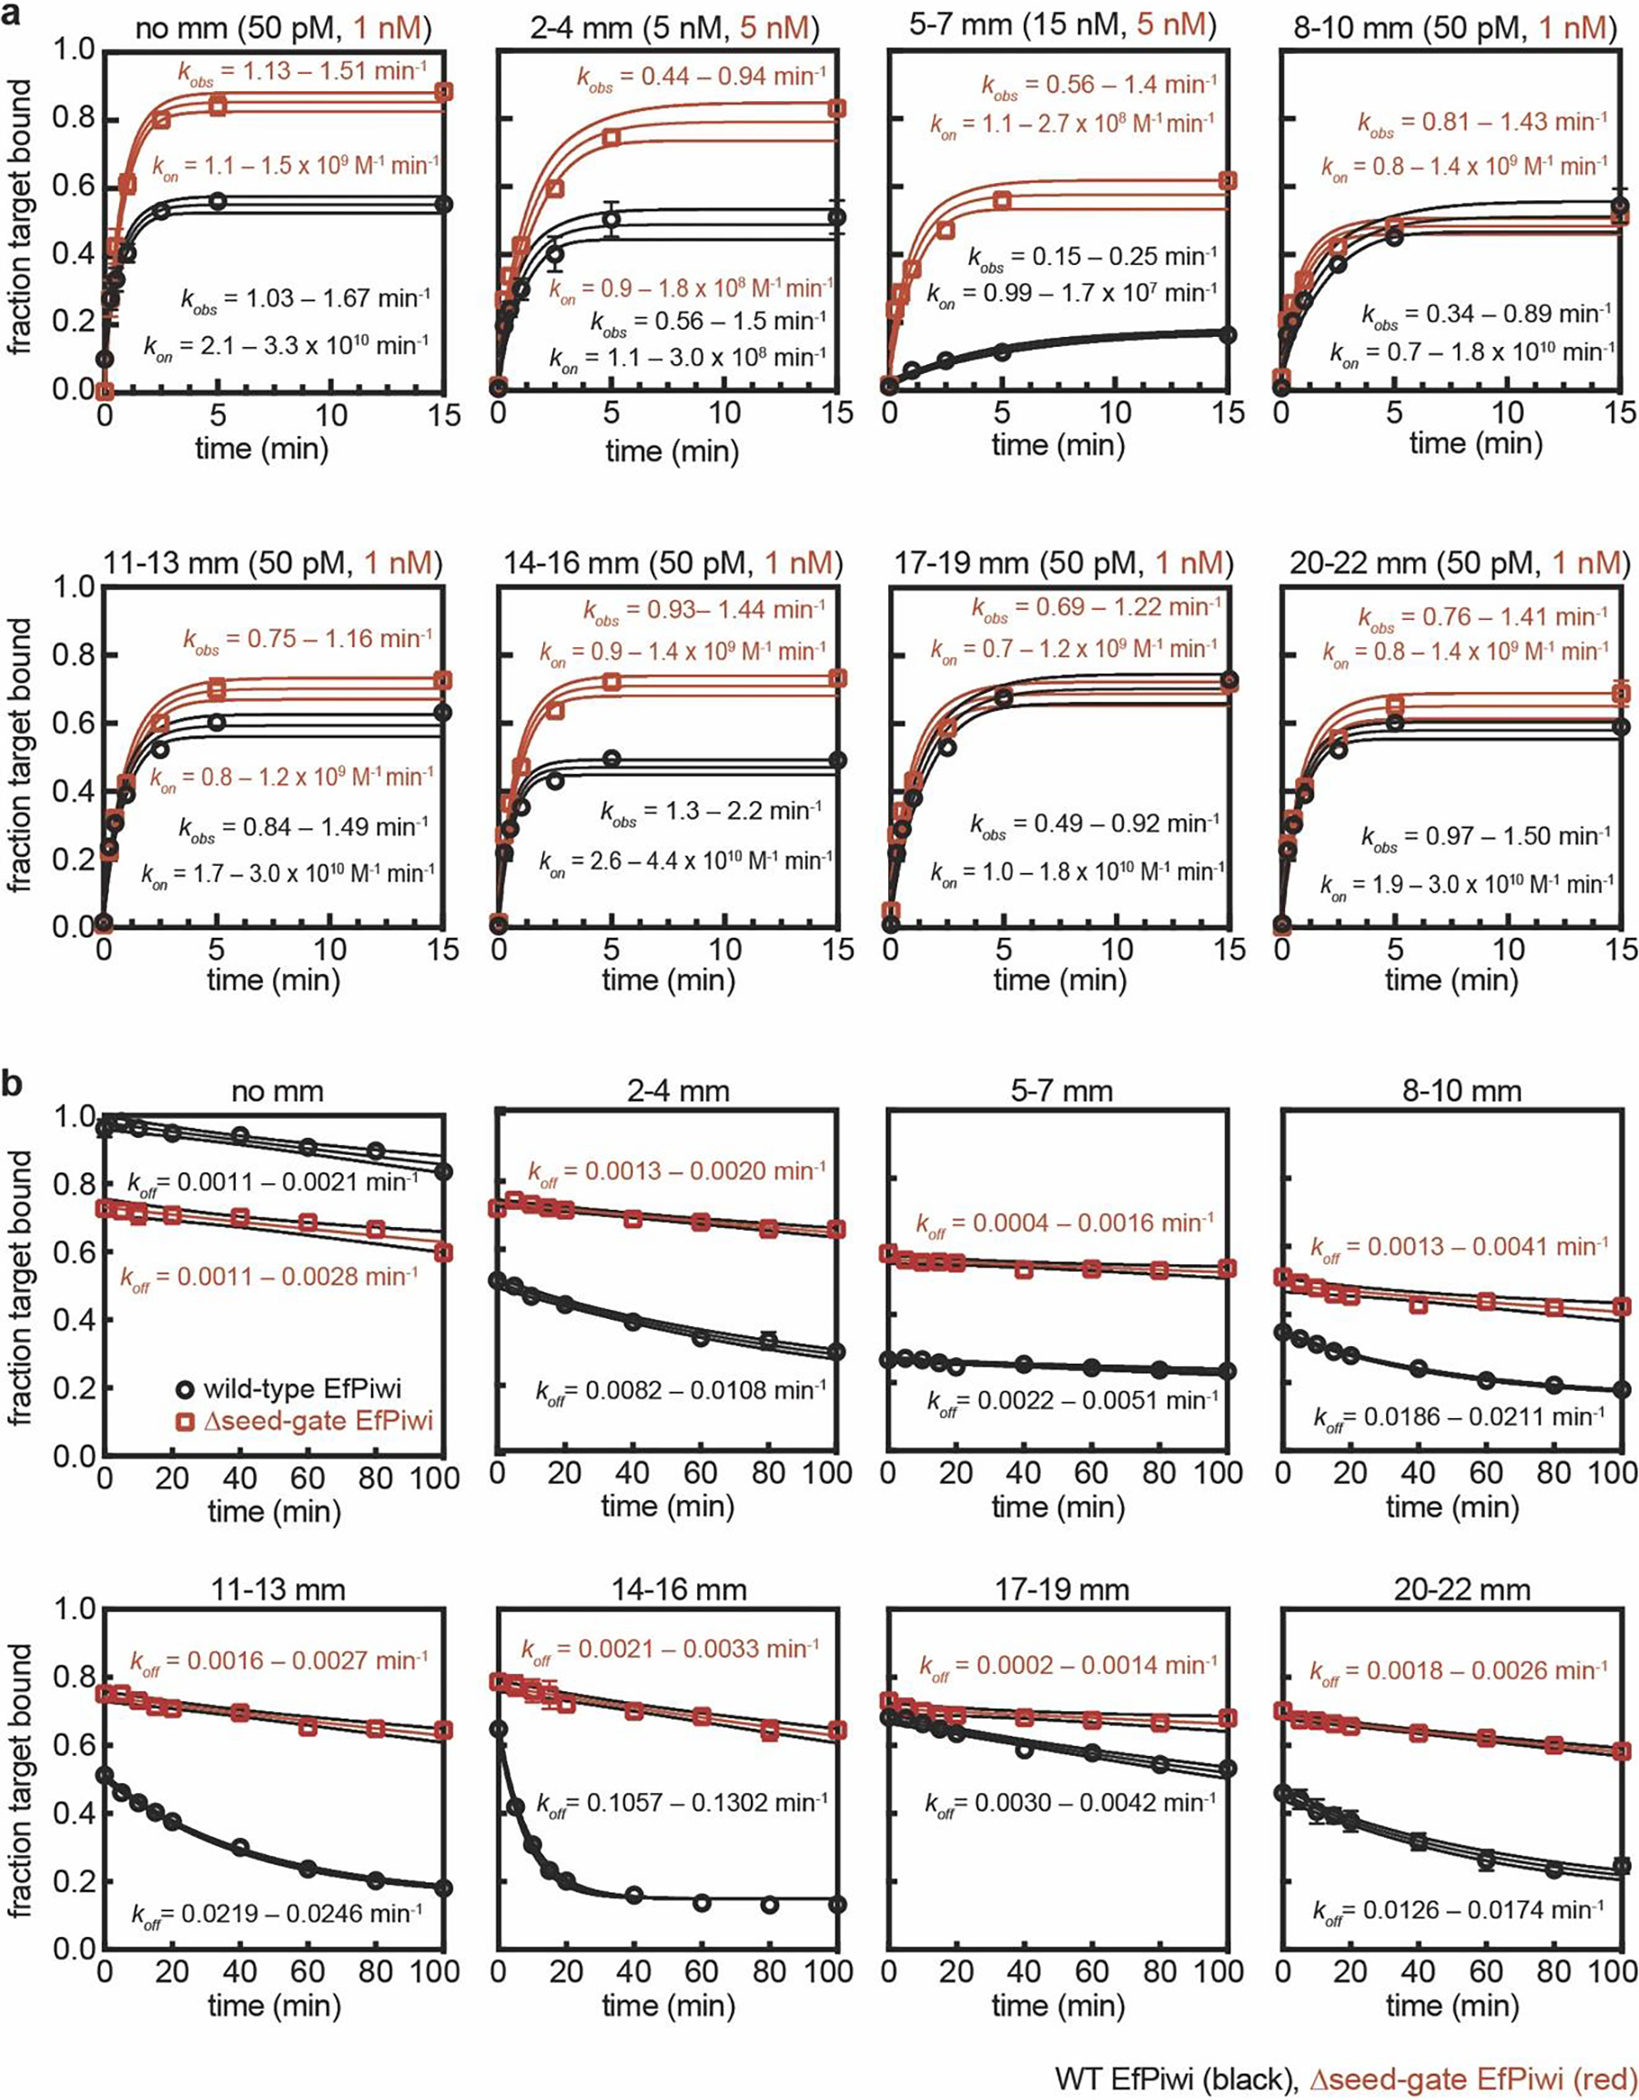
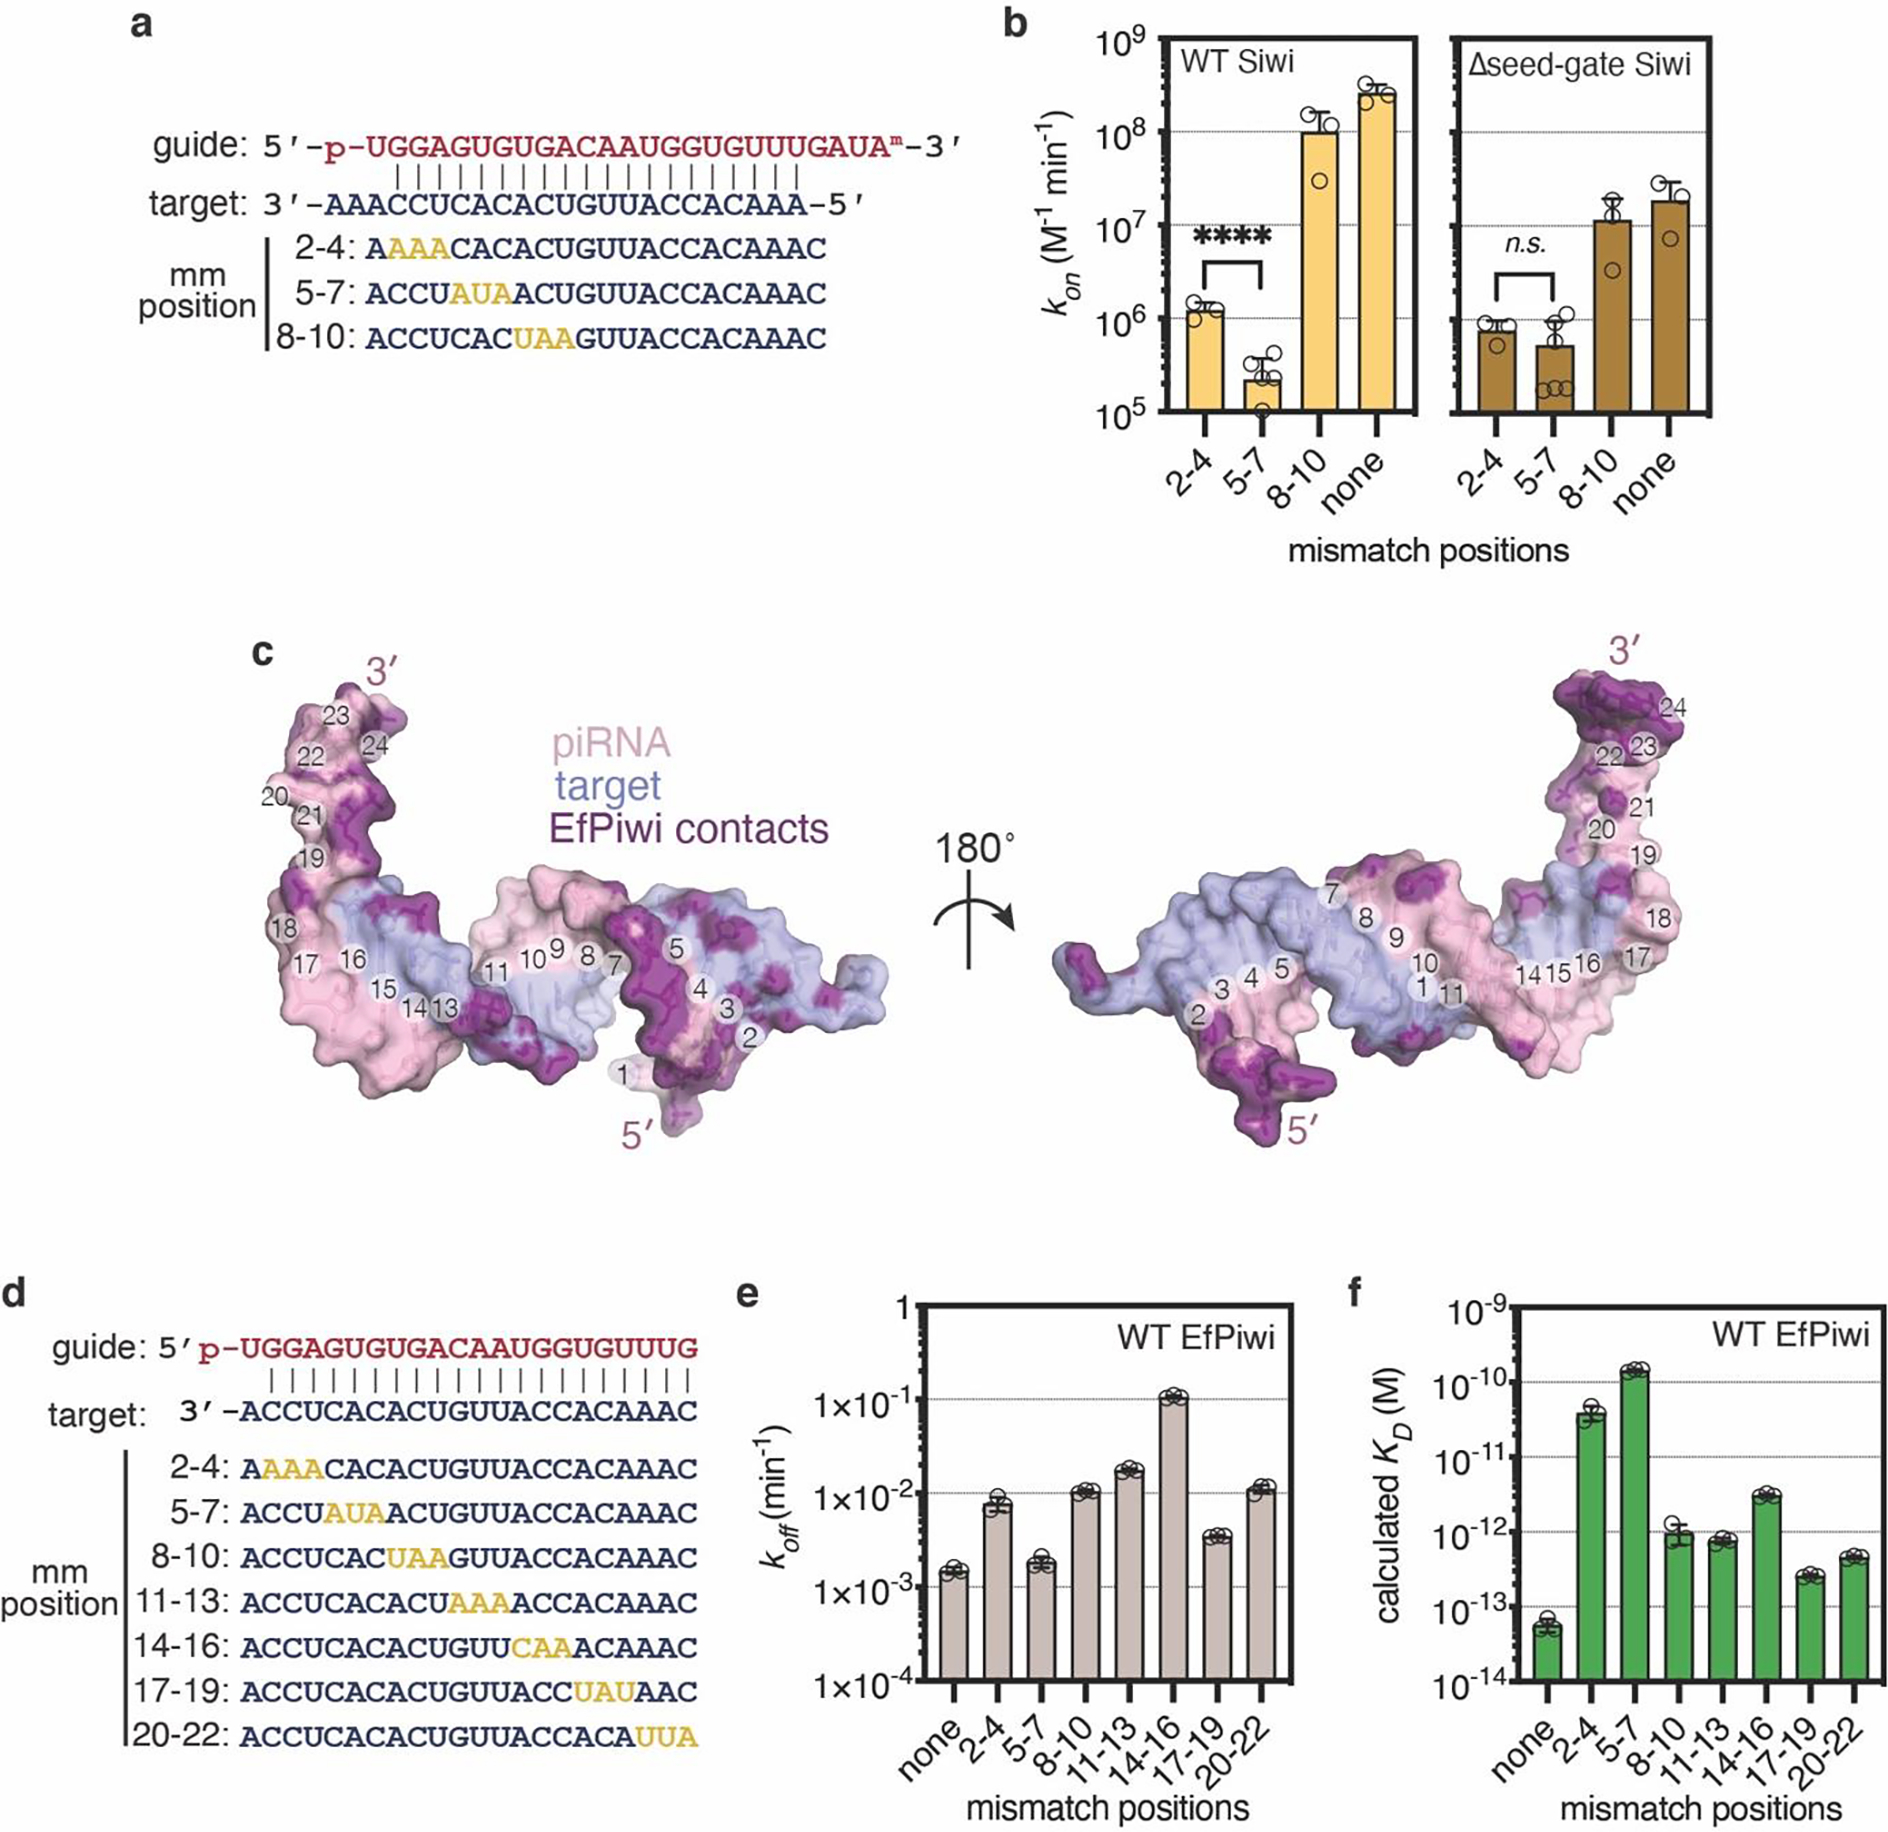
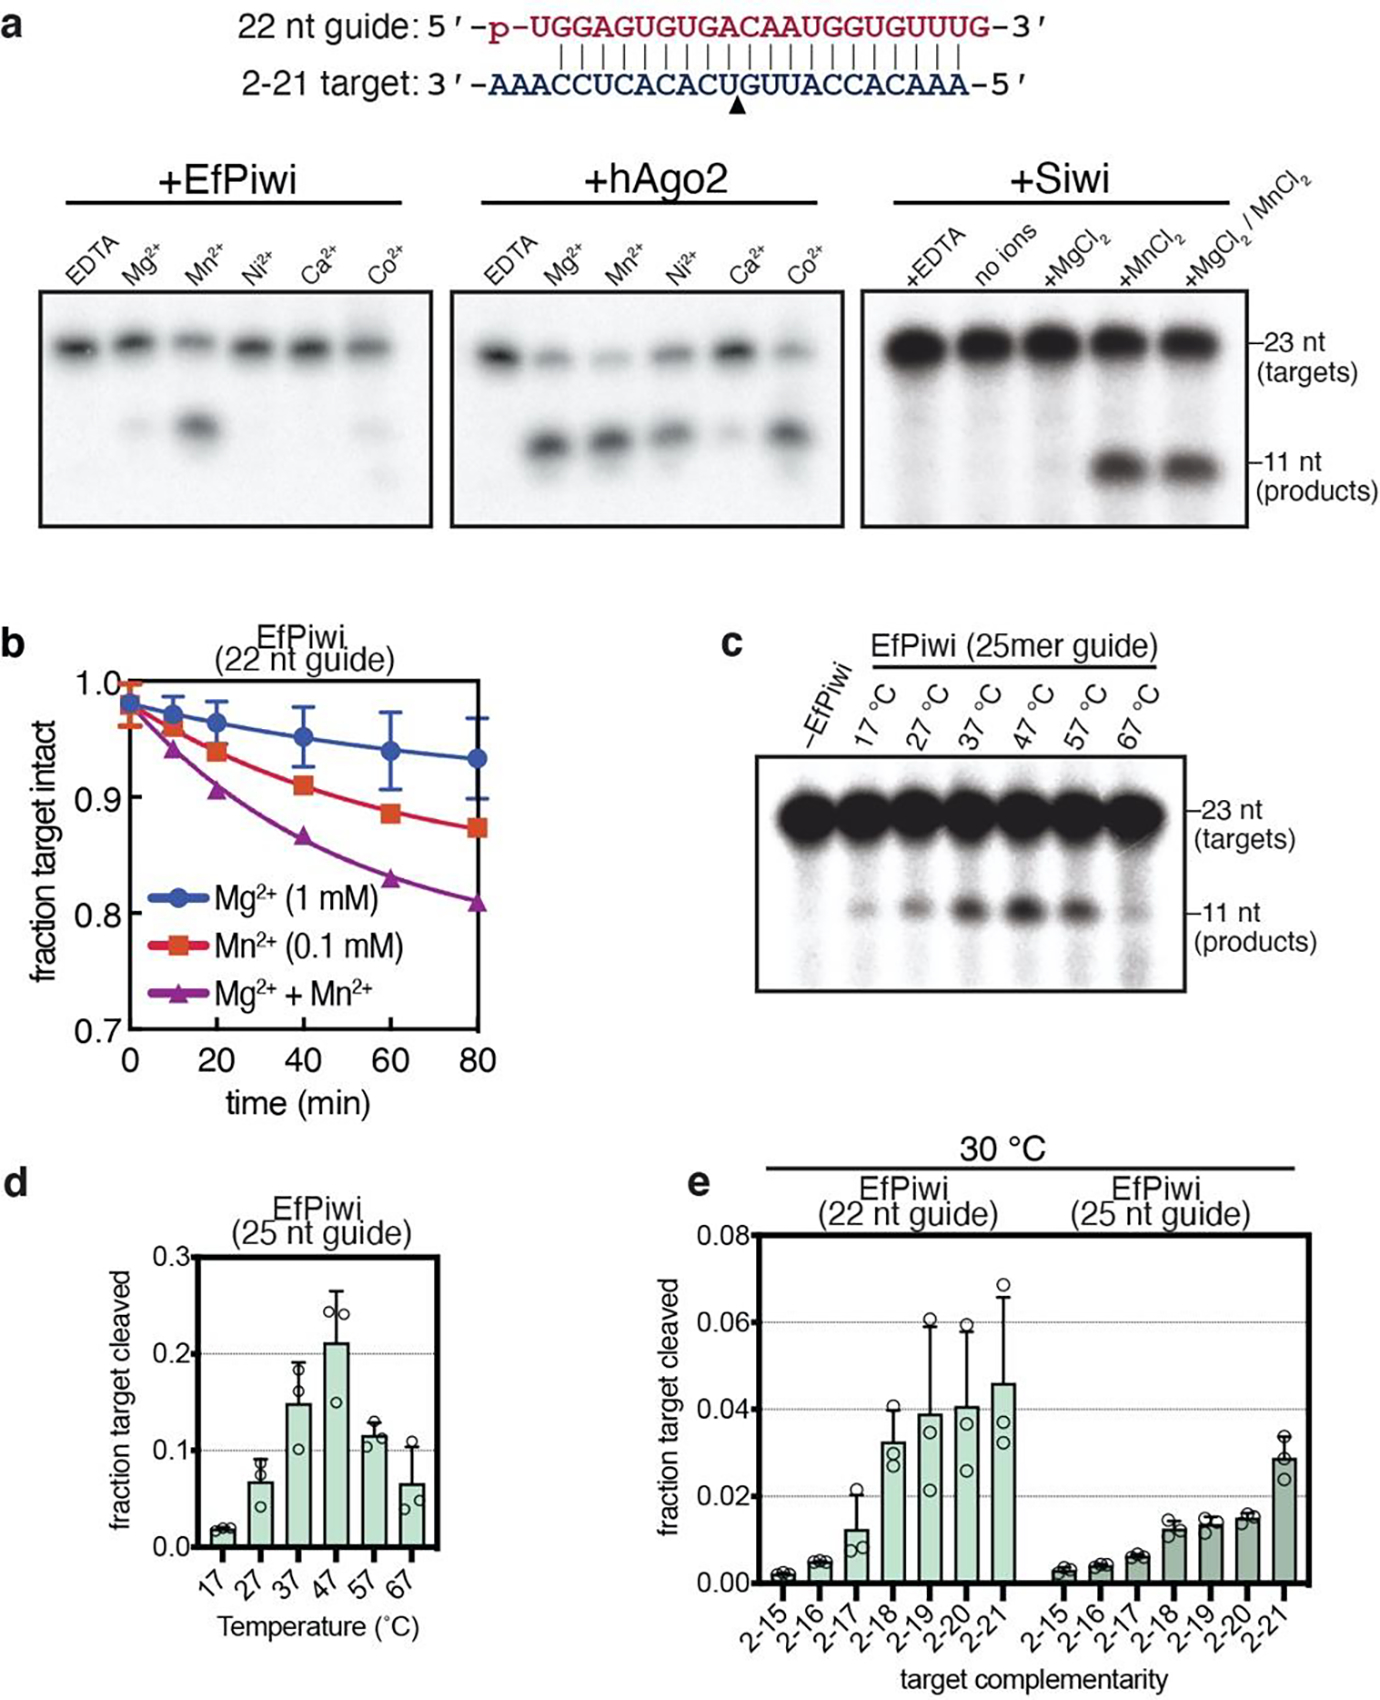
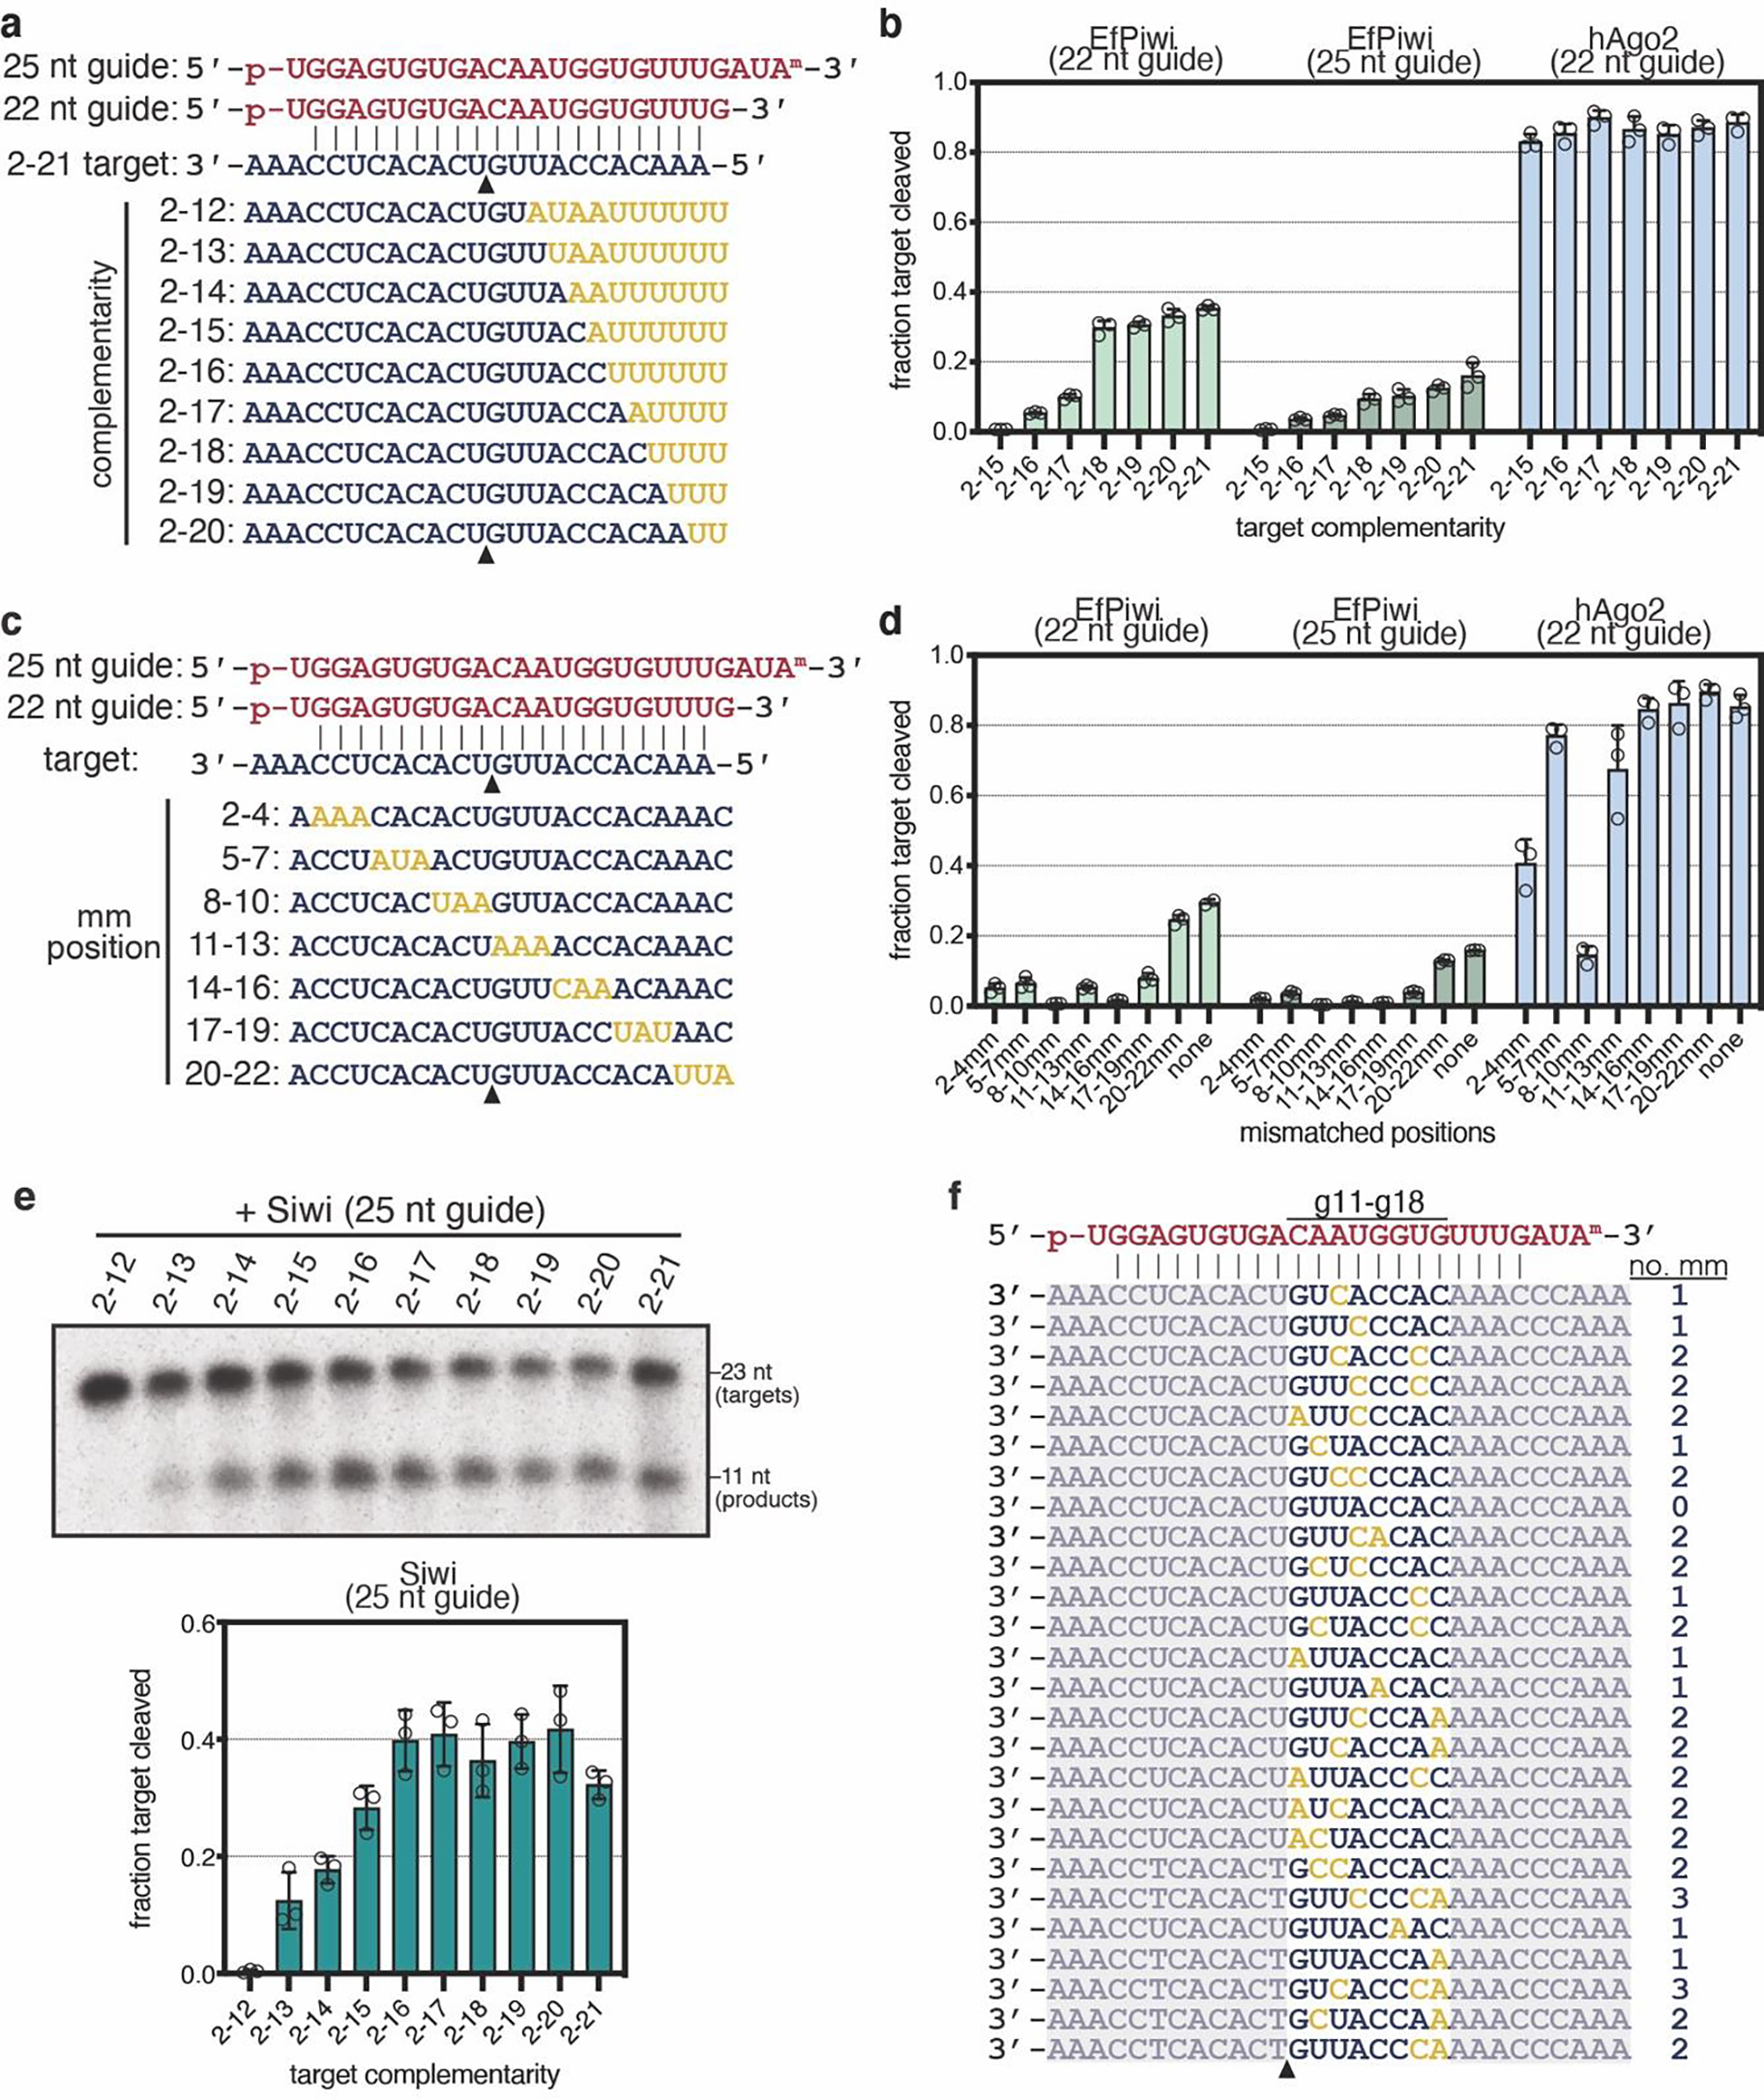
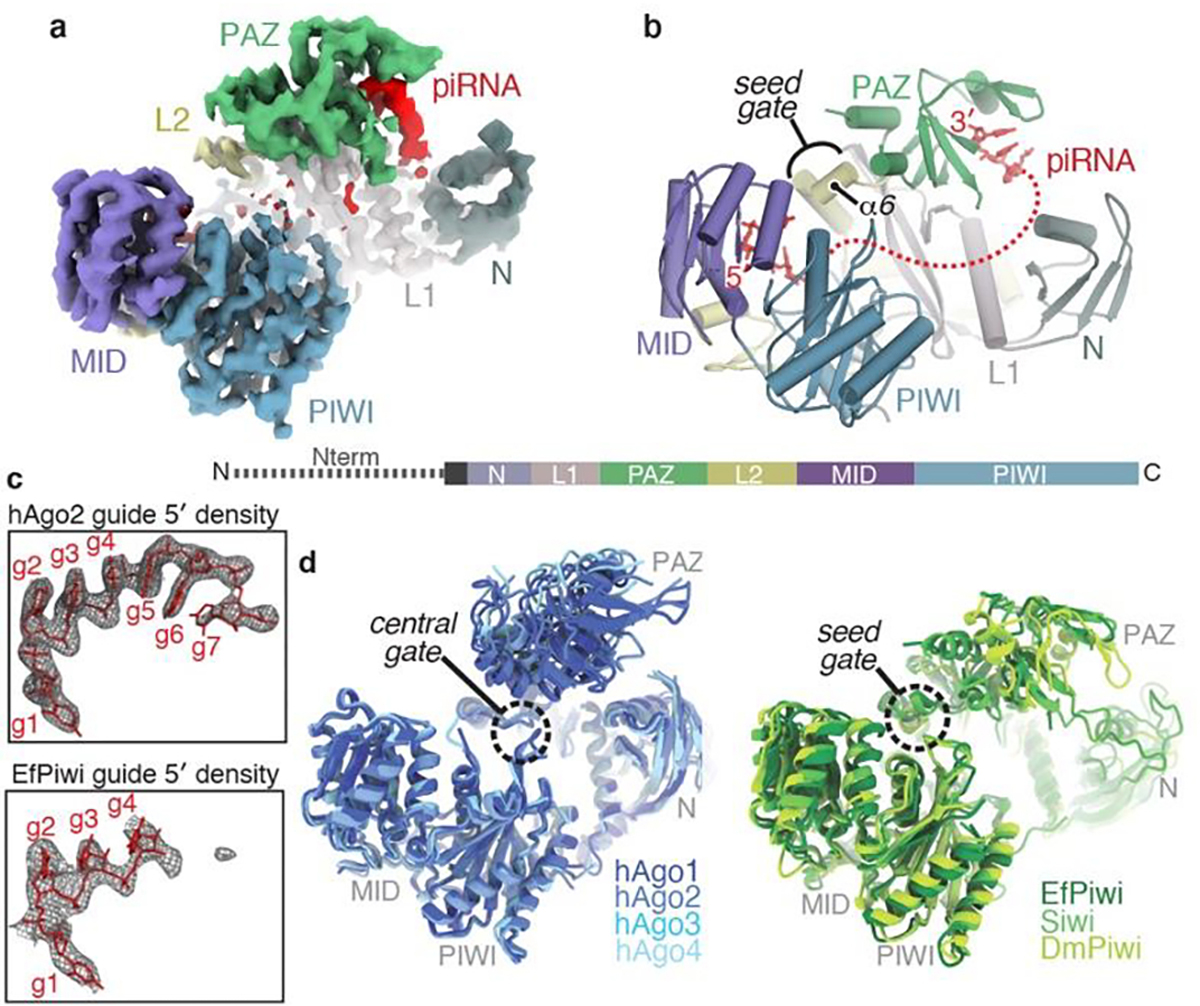
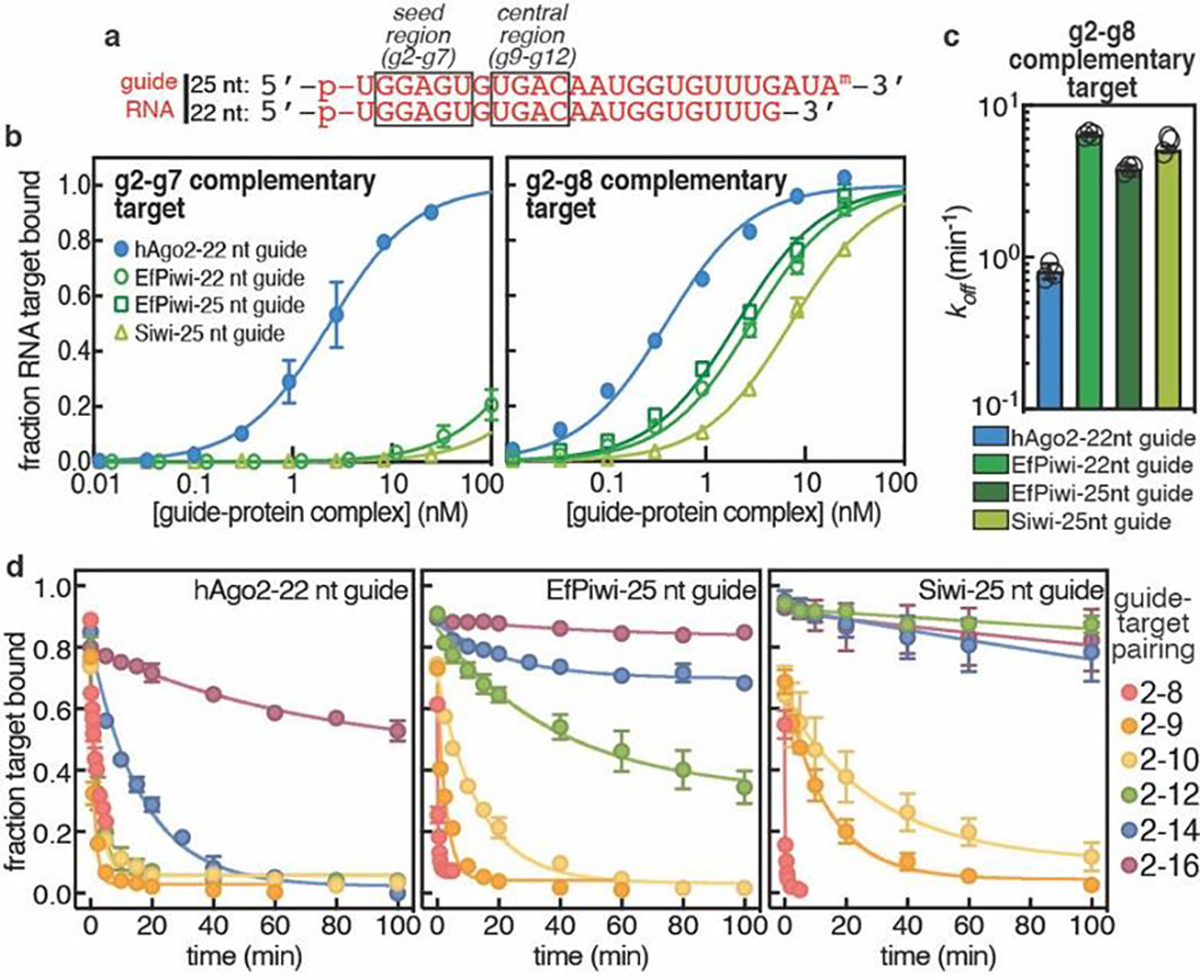
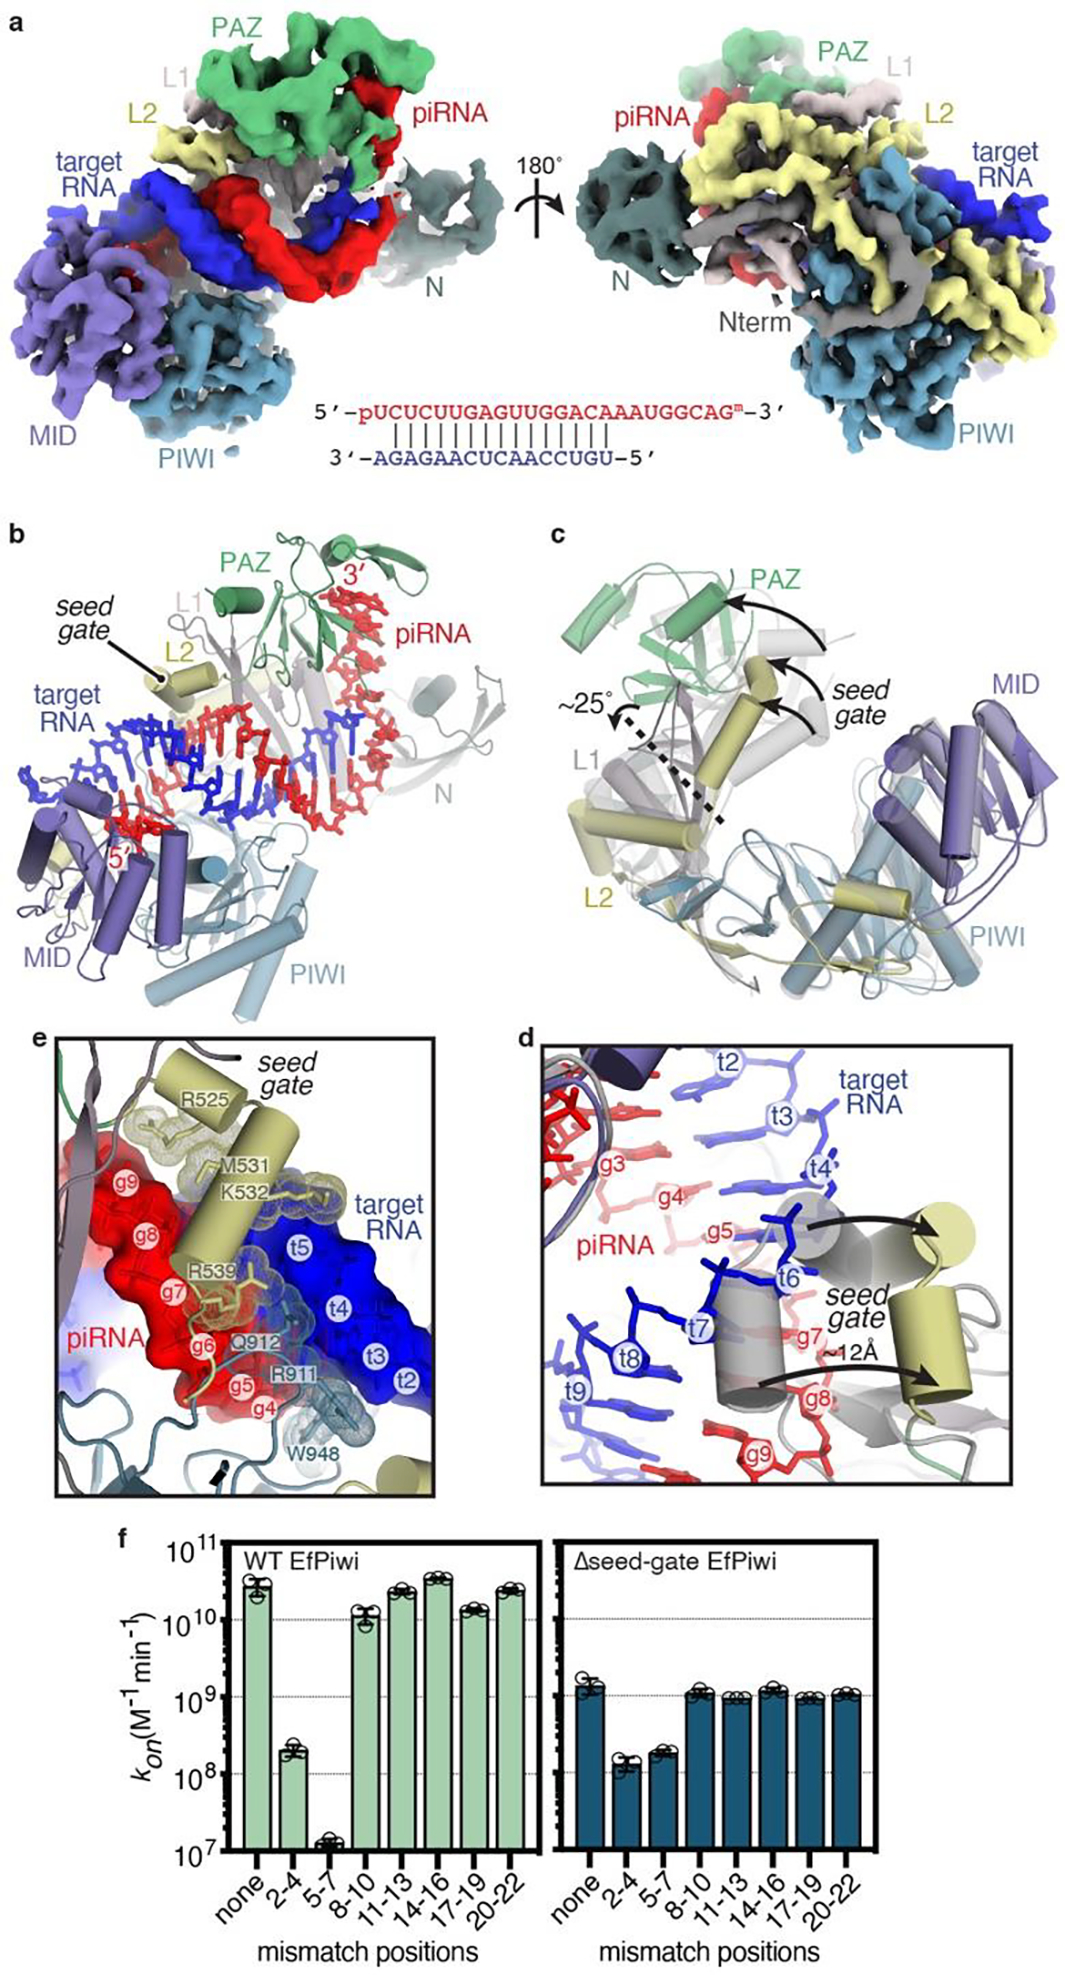
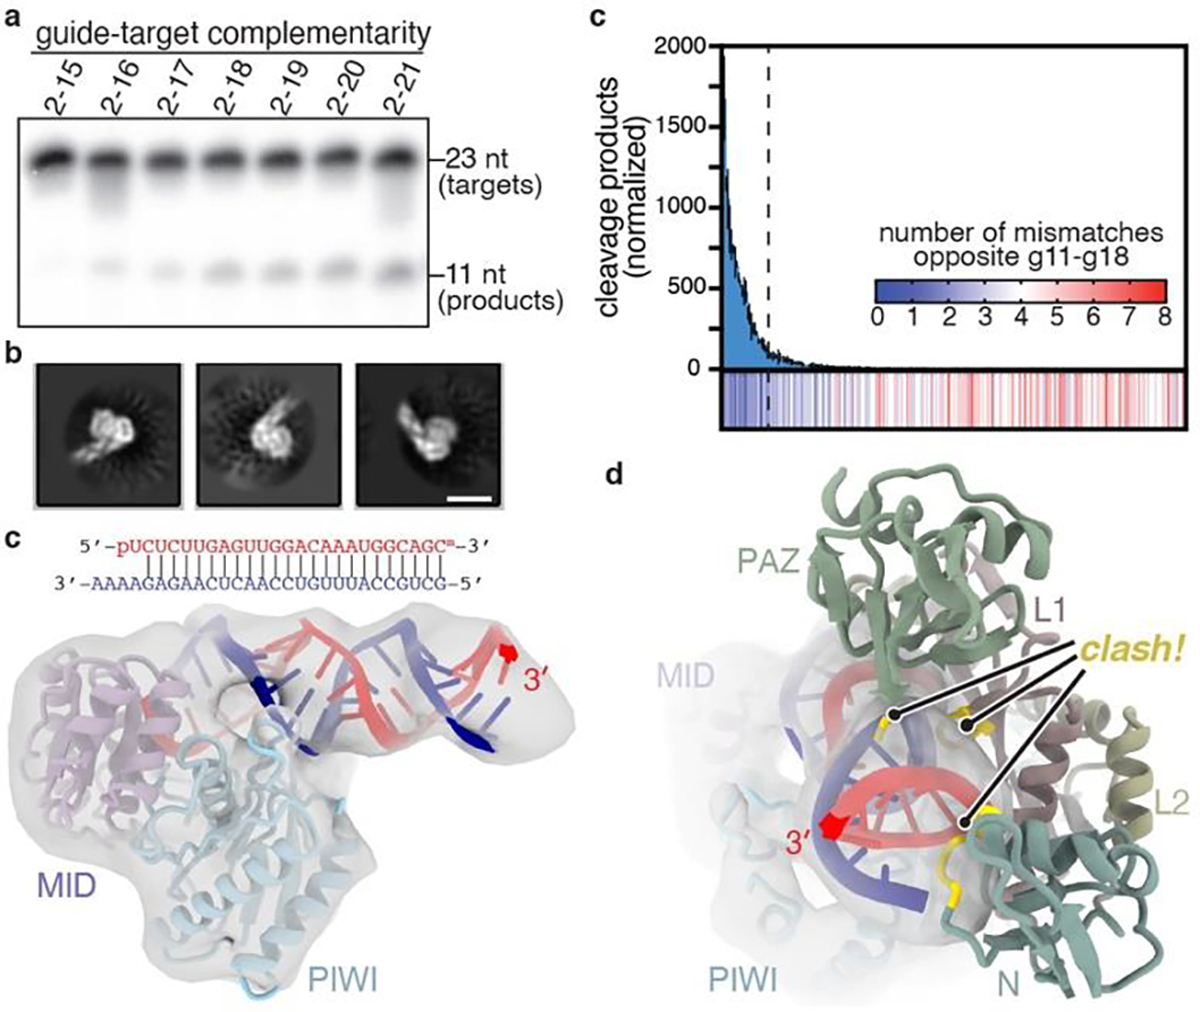
PIWI proteins use PIWI-interacting RNAs (piRNAs) to identify and silence transposable elements and thereby maintain genome integrity between metazoan generations1. The targeting of transposable elements by PIWI has been compared to mRNA target recognition by Argonaute proteins2,3, which use microRNA (miRNA) guides, but the extent to which piRNAs resemble miRNAs is not known. Here we present cryo-electron microscopy structures of a PIWI-piRNA complex from the sponge Ephydatia fluviatilis with and without target RNAs, and a biochemical analysis of target recognition. Mirroring Argonaute, PIWI identifies targets using the piRNA seed region. However, PIWI creates a much weaker seed so that stable target association requires further piRNA-target pairing, making piRNAs less promiscuous than miRNAs. Beyond the seed, the structure of PIWI facilitates piRNA-target pairing in a manner that is tolerant of mismatches, leading to long-lived PIWI-piRNA-target interactions that may accumulate on transposable-element transcripts. PIWI ensures targeting fidelity by physically blocking the propagation of piRNA-target interactions in the absence of faithful seed pairing, and by requiring an extended piRNA-target duplex to reach an endonucleolytically active conformation. PIWI proteins thereby minimize off-targeting cellular mRNAs while defending against evolving genomic threats.


Conflict of interest statement

Competing financial interest

The authors declare no competing financial interests.

Figures

Extended Data Fig. 1.
Extended Data Fig. 1.. PIWI protein purification and extended PIWI family tree.
a, Coomassie-stained SDS PAGE of piRNA-loaded PIWI proteins captured using an immobilized complementary oligonucleotide. Input shows partially purified protein samples that were incubated with capture resin. Unbound shows protein that did not bind the resin. Captured shows protein retained on the resin after washing (eluted by boiling in SDS). After elution shows protein retained on the resin after incubation with the competitor oligonucleotide (eluted by boiling in SDS). b, capture-purified PIWI proteins before and after anion exchange purification. Input fraction shows samples after elution by competitor oligonucleotide in capture-purification step. Purified indicates the final purification products. Note: Δseed-gate Siwi was captured at such low levels that it was unclear whether any active Siwi was obtained until observing the sample’s ability to specifically bind 32P-labeled target RNAs. c, phylogenetic tree of PIWI proteins shows EfPiwi belongs to the ancient Drosophila AGO3-like branch.
Extended Data Fig. 2.
Extended Data Fig. 2.. Imaging and processing of the EfPiwi-piRNA complex (and EfPiwi-piRNA-long target complex).
a, Representative cryo-EM micrograph (1,765 micrographs collected in total). Input sample contained EfPiwi-piRNA and a long target RNA (complementary to piRNA nucleotides g2–g25). b, Cryo-EM data processing workflow. The data set contained two populations of well resolved particles, one for the binary EfPiwi-piRNA complex and another for the ternary EfPiwi-piRNA-long target complex. Particles isolated from micrographs were sorted by reference-free 2D classification. Only particles containing high-resolution features for the intact complex were selected for downstream processing. 3D classification was used to further remove low-resolution or damaged particles, and the remaining particles were refined to obtain a 3.8 Å reconstruction for the EfPiwi-guide complex, and 8.6 Å for the ternary EfPiwi-piRNA-long target complex. c, The final 3D map for the EfPiwi-piRNA complex colored by local resolution values, where the majority of the map was resolved between 3.5 Å and 4 Å with the flexible PAZ and N domains having lower resolution. d, Angular distribution plot showing the Euler angle distribution of the EfPiwi-piRNA particles in the final reconstruction. The position of each cylinder corresponds to the 3D angular assignments and their height and color (blue to red) corresponds to the number of particles in that angular orientation. e, Directional Fourier Shell Correlation (FSC) plot representing 3D resolution anisotropy in the reconstructed map, with the red line showing the global FSC, green dashed lines correspond to ±1 standard deviation from mean of directional resolutions, and the blue histograms correspond to percentage of directional resolution over the 3D FSC. F. EM density quality of EfPiwi-piRNA complex. Individual domains of EfPiwi fit into the EM density, EM density shown in mesh; molecular models (colored as in Fig. 2) shown in cartoon representation with side chains shown as sticks; piRNA shown in stick representation.
Extended Data Fig. 3.
Extended Data Fig. 3.. Conserved structural features in extended PIWI family.
a, Surface of hAgo2 (left) and EfPiwi (right), highlighting g5-g6 nucleotide-binding loops. Superimposing g5-g6 nucleotides (red sticks) from hAgo2 onto EfPiwi results in steric clashes. b, g5-g6 loop in AGO structures (left) is kinked, enabling pre-organization of seed 3’ end. Equivalent loop in PIWI structures (right) cannot kink due to bulky residues (labeled positions 1 and 2), conserved in PIWI family. c, Close up superposition of central-gate and seed-gate structures in AGO and PIWI proteins, respectively. d, Superposition of seed-gate regions from all known PIWI (left) and AGO (right) structures, with secondary structure schematics shown above. e, Secondary structure predictions indicate the α6 extension is a defining feature of the PIWI family. Predictions were by PSIPRED 4.0. f, L1-L2 interface near seed-gate in EfPiwi. Hydrophobic residues buried at the L1-L2 interface are shown. g, Sequence alignment shows L1-L2 interface residues in EfPiwi are broadly conserved in PIWIs (green) and distinct from the equivalent residues in AGOs (blue).
Extended Data Fig. 4.
Extended Data Fig. 4.. Target release from hAgo2 and EfPiwi loaded with identical guides.
a, Schematic of pairing between guide RNAs and seed-matched target RNAs used in main text Fig. 2b,c. b, Schematic of pairing between 22 nt guide RNA and target RNAs spanning the seed and central regions. c. Release of 32P-labeled target RNAs from EfPiwi-22 nt guide in the presence of excess unlabeled target RNA over time. d. Release rates of target RNAs from hAgo2–22 nt guide (data from main text Fig. 2d, left panel) and EfPiwi-22nt guide (panel c). Results show hAgo2 and EfPiwi create distinct binding properties for the same guide RNA. All plotted data are the mean values of triplicate measurements. Error bars indicate SD. e, Ribbon representation of hAgo2, EfPiwi, and an overlay illustrating relative positions of the central-gate and seed-gate. In c-d, n=3 independent experiments, data are mean ± s.d.
Extended Data Fig. 5.
Extended Data Fig. 5.. Imaging and processing of the EfPiwi-piRNA-target complex.
a, Representative cryo-EM micrograph of EfPiwi-piRNA-target complex (1,881 micrographs collected in total). b, Workflow for processing EfPiwi-piRNA-target complex data set. Particles isolated from micrographs were sorted by reference-free 2D classification. Only particles containing high-resolution features for the intact complex were selected for downstream processing. 3D classification was used to further remove low-resolution or damaged particles, and the remaining particles were refined to obtain a 3.5 Å map. c, The EfPiwi-piRNA-target complex map colored by local resolution. d, Euler angle distribution plot for the EfPiwi-piRNA-target complex particles. e, Directional Fourier Shell Correlation (FSC) plot representing 3D resolution anisotropy in the reconstructed map. Red line shows global FSC; green dashed lines ±1 standard deviation from mean of directional resolutions; blue histograms indicate percentage of directional resolution over the 3D FSC. f, EM density quality of EfPiwi-piRNA-target complex. Individual domains of EfPiwi and RNAs fit into the EM density; EM density shown in mesh; protein models shown in cartoon representation (colored as in Fig. 5) with side chains shown as sticks; RNAs shown in stick representation.
Extended Data Fig. 6
Extended Data Fig. 6. EfPiwi target binding data.
a, Raw data for kon values shown in Fig. 3f. Plots of target RNAs with mismatches (sequences shown in Extended Data Fig. 6c) binding to EfPiwi-piRNA complexes over time. Protein concentrations used in each experiment are indicated at top of each graph. 95% confidence limits of observed association rates (kobs) and kon values indicated. WT EfPiwi (black), Δseed-gate EfPiwi (red). b, Raw data for koff values shown in Extended Data Fig. 7e. Plots of target RNAs with mismatches (mm) dissociating from EfPiwi-piRNA complexes over time. All data were fit to a plateau value of 0.15. 95% confidence limits of kon values indicated. All data points were measured three times. Error bars indicate SEM. Center line indicates best fit to data. Surrounding lines indicate 95% confidence limits. In all panels, n=3 independent experiments, data are mean ± s.d.
Extended Data Fig. 7.
Extended Data Fig. 7.. Target binding with mismatches
a, Guide-target pairing schematic for select mismatched targets binding Siwi-piRNA complexes. Mismatches colored gold. b, Association rates of target RNAs (shown in panel a) with wild-type Siwi (left) and Δseed-gate Siwi. Indicated p-values from two-sided t-test are 6.11 × 10⁻⁵ and 0.205 for wild-type and Δseed-gate Siwi, respectively. c, Guide-target pairing schematic for mismatched targets used in main text Fig. 3f, and panels d and e here. Mismatches colored gold. d, Dissociation rates of 32P-labeled target RNAs with three consecutive mismatches from wild-type EfPiwi. Most mismatched segments had moderate (~10-fold) effects on koff, except 14–16 mismatches, which increased koff ~70 fold. e, Dissociation constants (KD) calculated from kon and koff values for target RNAs binding wild-type EfPiwi-guide complex. f, Surface representation of the modeled piRNA-target duplex. piRNA nucleotides numbered at the Watson-Crick face. Non-hydrogen RNA atoms positioned ≤ 4 Å from an EfPiwi atom colored purple. In b,d, and e, n=3 independent experiments, data are mean ± s.d.
Extended Data Fig. 8.
Extended Data Fig. 8.. Target cleavage by EfPiwi and Siwi (part I).
a, Denaturing gels showing cleavage of g2-g21 matched 32P-labeled target RNA by EfPiwi, hAgo2 or Siwi in the presence of various divalent cations (2 mM each). Schematic of piRNA-target pairing shown (top). Gels are representative results for n=3 independent experiments for EfPiwi and hAgo2, and n=2 independent experiments for Siwi. b, Time course showing cleavage of g2-g21 paired 32P-labeled target RNA by EfPiwi in the presence of Mg2+, Mn2+, or both at approximate physiological divalent cation concentrations. c, Cleavage of g2-g21 matched 32P-labeled target RNA by EfPiwi at various temperatures shows activity over the full physiological range (17–30°C). Gel is representative of n=3 independent experiments. d, Quantitation of results (and replicates) in c. e, Cleavage of target RNAs with varying degrees of 3’ complementarity by EfPiwi at 30°C. In b, d and e, n=3 independent experiments, data are mean ± s.d.
Extended Data Fig. 9.
Extended Data Fig. 9.. Target cleavage by EfPiwi and Siwi (part II).
a, Guide-target pairing schematic for targets with varying degrees of complementarity to piRNA 3’ end used in Fig. 4a (main text) and panels b and e (here). b, Quantification target RNAs (1 nM) cleaved after treating with excess (100 nM) EfPiwi loaded with a 22 or 25 nt guide or hAgo2 loaded with a 22 nt guide for 1 hour. n=3 independent experiments, data are mean ± s.d. c, Guide-target pairing schematic for targets with 3 nt mismatched regions. d, Quantification mismatched target RNAs (1 nM) cleaved after treating with excess (100 nM) EfPiwi loaded with a 22 or 25 nt guide or hAgo2 loaded with a 22 nt guide for 1 hour. n=3 independent experiments, data are mean ± s.d. e, Cleavage of targets with varying degrees of complementarity to piRNA 3’ end (shown panel a) by Siwi (2 mM MnCl2, 37°C). Gel is representative of n=3 independent experiments, with data plotted as mean ± s.d. shown below. f, From Fig. 4c: sequences of the 26 target RNAs, with 0–8 mismatches opposite piRNA nucleotides g11–g18, that were most readily cleaved by EfPiwi (listed in order of cleavage product abundance). Mismatched nucleotides colored yellow. Grayed out sequences indicate constant regions shared by all target RNAs. Triangle indicates cleavage site.
Fig. 1.
Fig. 1.. Structural features unique to PIWIs.
a, Segmented EfPiwi-piRNA cryo-EM reconstruction, colored by domain. b, Cartoon representation of EfPiwi model. Disordered piRNA nucleotides, dashed red line. Linear domain schematic shown below. c, Density maps (grey mesh) in space occupied by seed regions of hAgo2 (PDB 4OLA) and EfPiwi. Modeled guide RNAs as red sticks. d, Superposition of miRNA-class AGO structures (left, PDB: 4KXT, 4OLA, 5VM9, 6OON) and known PIWI structures (right, PDB: 7KX7, 5GUH, 6KR6). AGO central-gate and PIWI seed-gate structures indicated.
Fig. 2.
Fig. 2.. piRNAs are more selective than miRNAs.
a, Schematic of guide RNAs used. b, Fraction of target RNAs bound by hAgo2-guide, EfPiwi-guide, and Siwi-guide RNA complexes at equilibrium versus protein-guide concentration. c, Release rates of g2-g8 complementary target protein-guide RNA complexes. d, Release of 32P-labeled target RNAs from indicated protein-guide complexes in the presence of excess unlabeled target RNA over time. In b-c n=3 independent experiments, data are mean ± s.d.
Fig. 3.
Fig. 3.. Structural basis for piRNA target binding.
a, Segmented EfPiwi-piRNA-target RNA cryo-EM reconstruction, colored as in Fig 1. piRNA-target base pairing schematic shown below. b, Cartoon representation of EfPiwi-piRNA-target RNA model. c, Superposition of EfPiwi-piRNA (gray, semi-transparent) and EfPiwi-piRNA-target (colored and solid) structures. Arrows indicate movements to target-bound structure. Dashed line indicates hinge in L1 stalk. d, Closeup view showing the seed-gate shifts ~12 Å upon target binding. Arrows indicate direction of movement from guide-only to target-bound conformation. e, Interactions between EfPiwi and the piRNA-target duplex around the seed region. f, Association rates of target RNAs with three consecutive mismatches binding wild-type (left) and Δseed-gate (right) EfPiwi. n=3 independent experiments, data are mean ± s.d.
Fig. 4.
Fig. 4.. Extensive pairing activates piRNA-target cleavage.
a, Representative denaturing gel showing intact and cleaved target RNAs, with increasing amounts of complementarity to a piRNA, after incubation with excess EfPiwi-piRNA for one hour (results typical of 3 replicates). b, relative number of RNA-seq reads of cleavage products after treating a pool of 256 target RNAs with excess EfPiwi-piRNA. Heatmap indicates number of mismatches opposite piRNA nucleotides g11–g18 in each sequence. Dashed line denotes 26 most abundant products. n=3 independent experiments, data are mean ± s.d. d, Three examples of 2D class averages of EfPiwi-piRNA complex bound to a target with complementarity from g2-g25. Scale bar is 5 nm. e, 3D cryo-EM reconstruction fit with the MID/PIWI lobe and extended piRNA-target duplex. piRNA 3’ end indicated. g, Docking the EfPiwi-piRNA-target model with pairing limited to g2-g16 (see Fig. 3) reveals the N, L1, and PAZ domains sterically clash (gold highlights) with the extended piRNA-target duplex.

References

    1. Ozata DM, Gainetdinov I, Zoch A, O’Carroll D & Zamore PD PIWI-interacting RNAs: small RNAs with big functions. Nature reviews. Genetics 20, 89–108, doi: 10.1038/s41576-018-0073-3 (2019). - DOI - PubMed
    1. Shen EZ et al. Identification of piRNA Binding Sites Reveals the Argonaute Regulatory Landscape of the C. elegans Germline. Cell 172, 937–951 e918, doi: 10.1016/j.cell.2018.02.002 (2018). - DOI - PMC - PubMed
    1. Gou LT et al. Pachytene piRNAs instruct massive mRNA elimination during late spermiogenesis. Cell Res 24, 680–700, doi: 10.1038/cr.2014.41 (2014). - DOI - PMC - PubMed
    1. Grimson A et al. Early origins and evolution of microRNAs and Piwi-interacting RNAs in animals. Nature 455, 1193–1197, doi: 10.1038/nature07415 (2008). - DOI - PMC - PubMed
    1. Lewis BP, Shih IH, Jones-Rhoades MW, Bartel DP & Burge CB Prediction of mammalian microRNA targets. Cell 115, 787–798 (2003). - PubMed

Methods References

    1. Sheu-Gruttadauria J & MacRae IJ Phase Transitions in the Assembly and Function of Human miRISC. Cell 173, 946–957 e916, doi: 10.1016/j.cell.2018.02.051 (2018). - DOI - PMC - PubMed
    1. Flores-Jasso CF, Salomon WE & Zamore PD Rapid and specific purification of Argonaute-small RNA complexes from crude cell lysates. RNA 19, 271–279, doi: 10.1261/rna.036921.112 (2013). - DOI - PMC - PubMed
    1. Suloway C et al. Automated molecular microscopy: the new Leginon system. J Struct Biol 151, 41–60, doi: 10.1016/j.jsb.2005.03.010 (2005). - DOI - PubMed
    1. Zheng SQ et al. MotionCor2: anisotropic correction of beam-induced motion for improved cryo-electron microscopy. Nature methods 14, 331–332, doi: 10.1038/nmeth.4193 (2017). - DOI - PMC - PubMed
    1. Lander GC et al. Appion: an integrated, database-driven pipeline to facilitate EM image processing. J Struct Biol 166, 95–102, doi: 10.1016/j.jsb.2009.01.002 (2009). - DOI - PMC - PubMed

Publication types

MeSH terms