. 2021 Aug 20;2(3):100767.
doi: 10.1016/j.xpro.2021.100767. eCollection 2021 Sep 17.

Protocol for assessing real-time changes in mitochondrial morphology, fission and fusion events in live cells using confocal microscopy

Affiliations

Protocol for assessing real-time changes in mitochondrial morphology, fission and fusion events in live cells using confocal microscopy

Irene Bertolini et al. STAR Protoc. .

Abstract

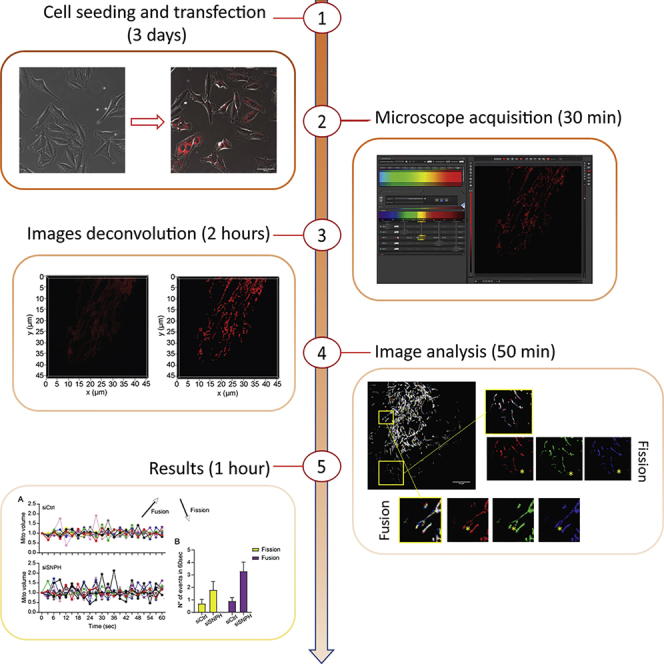
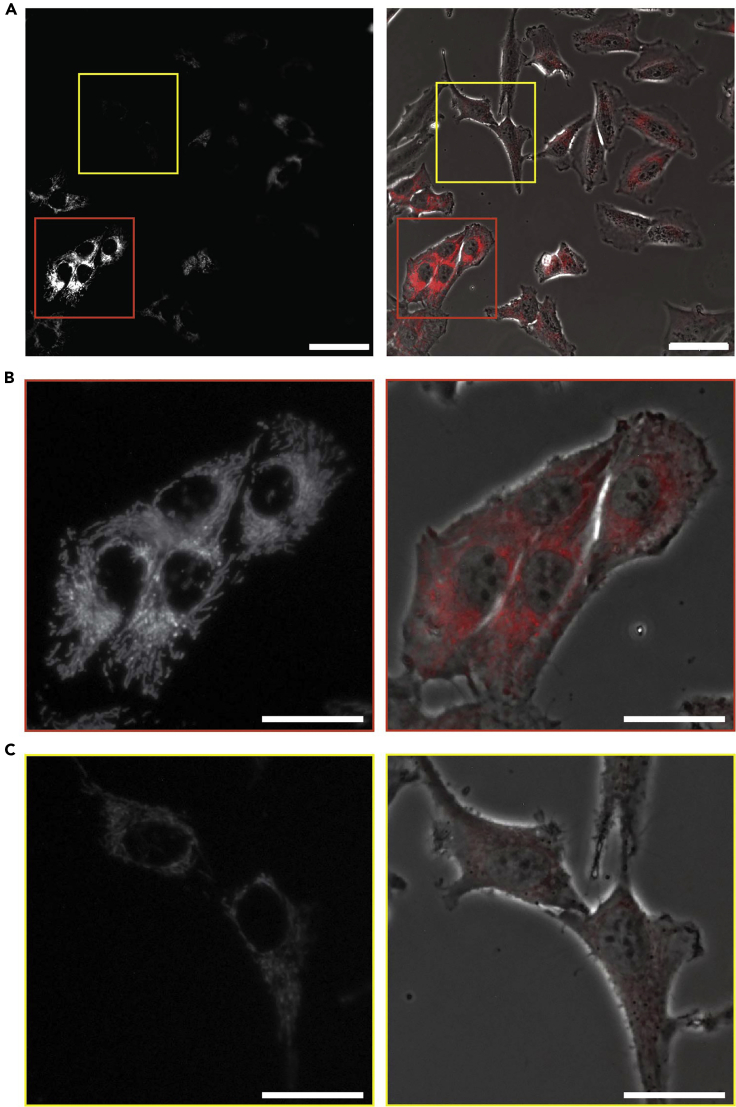
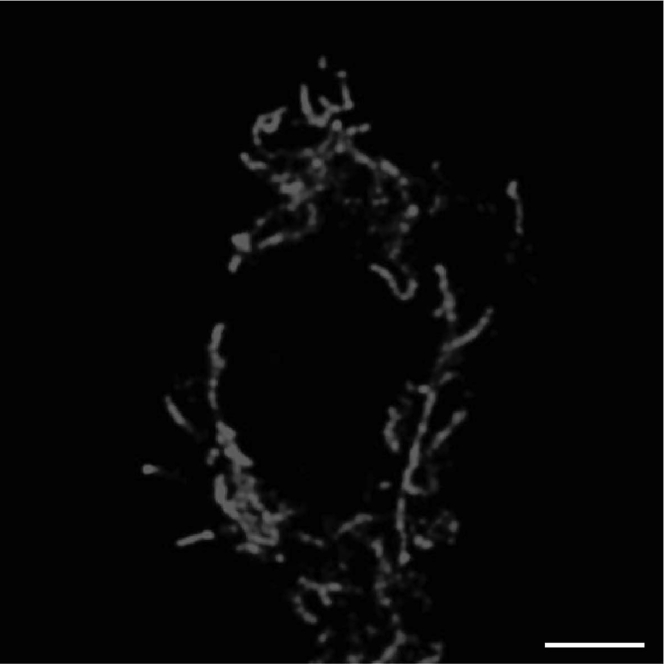
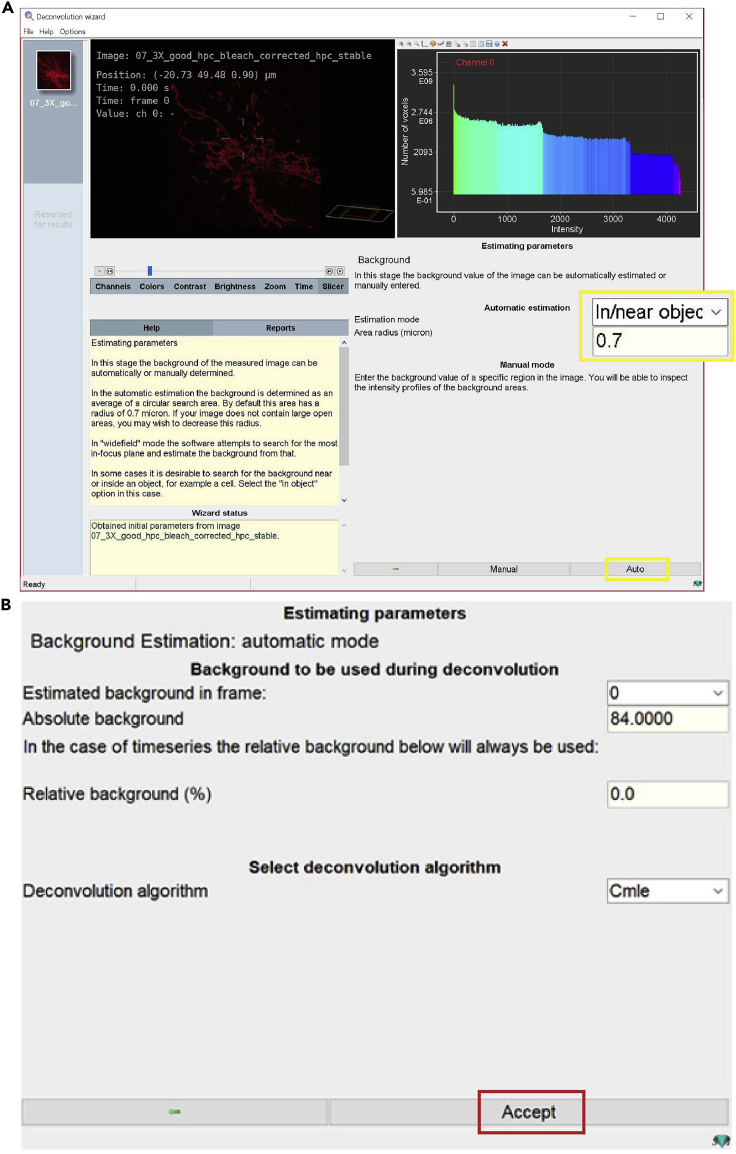
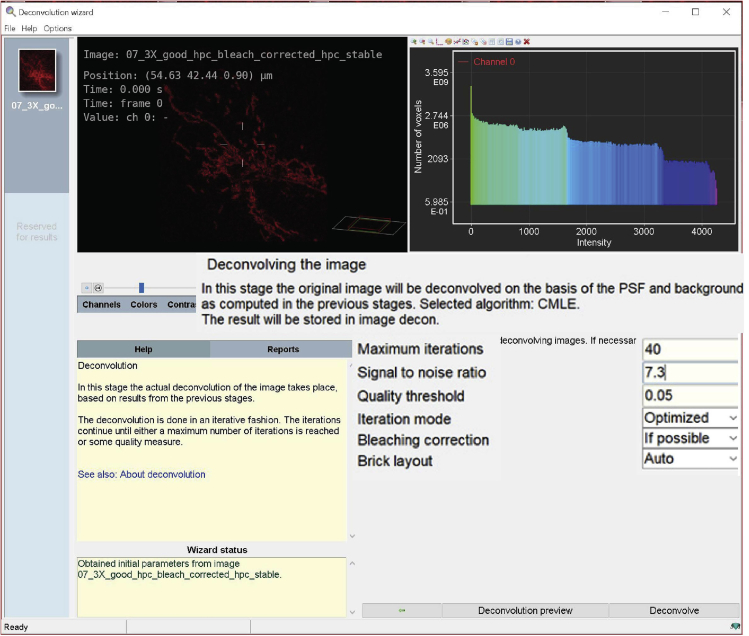
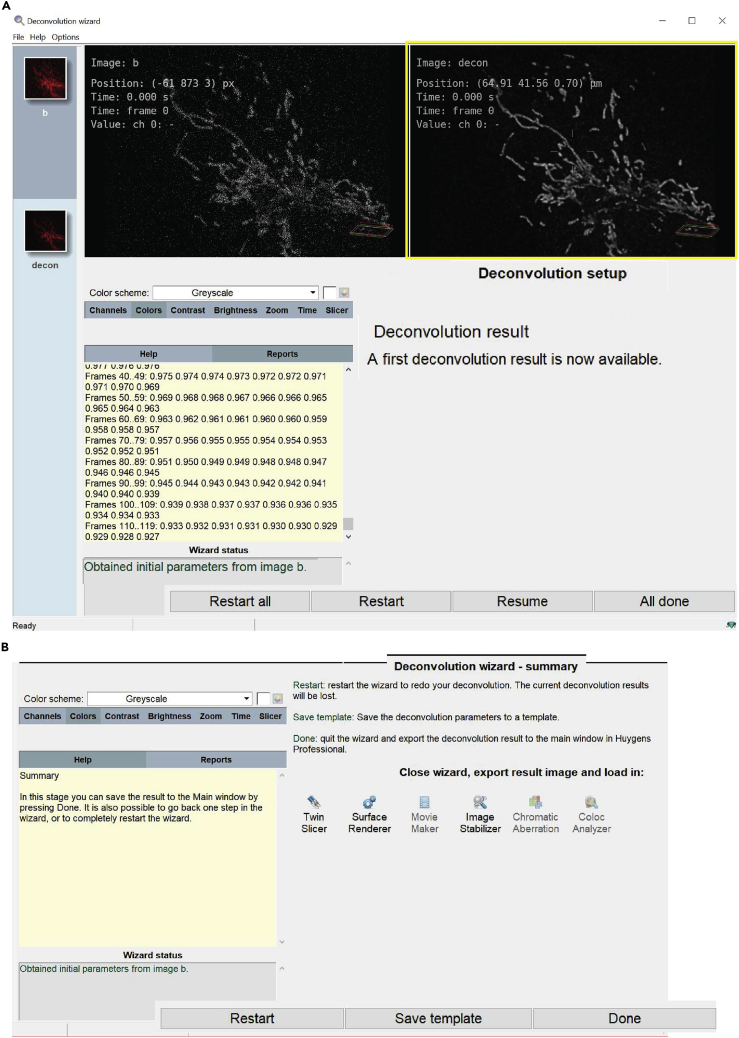
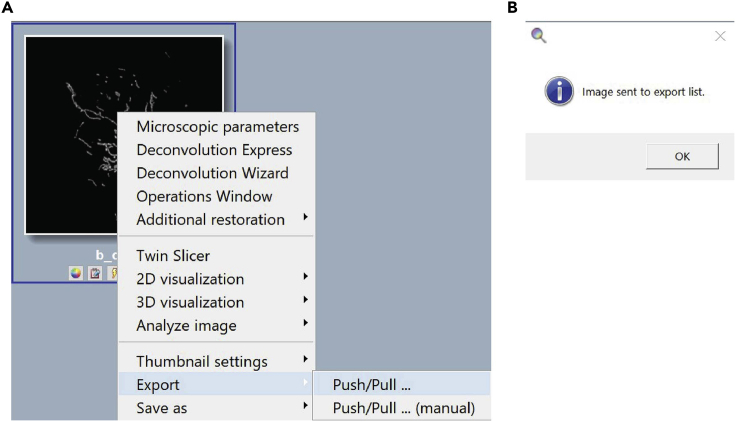
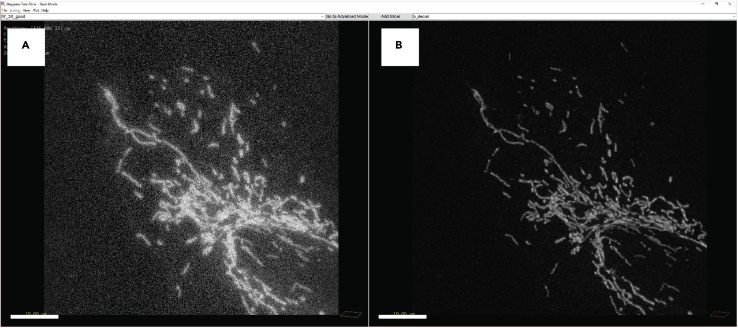
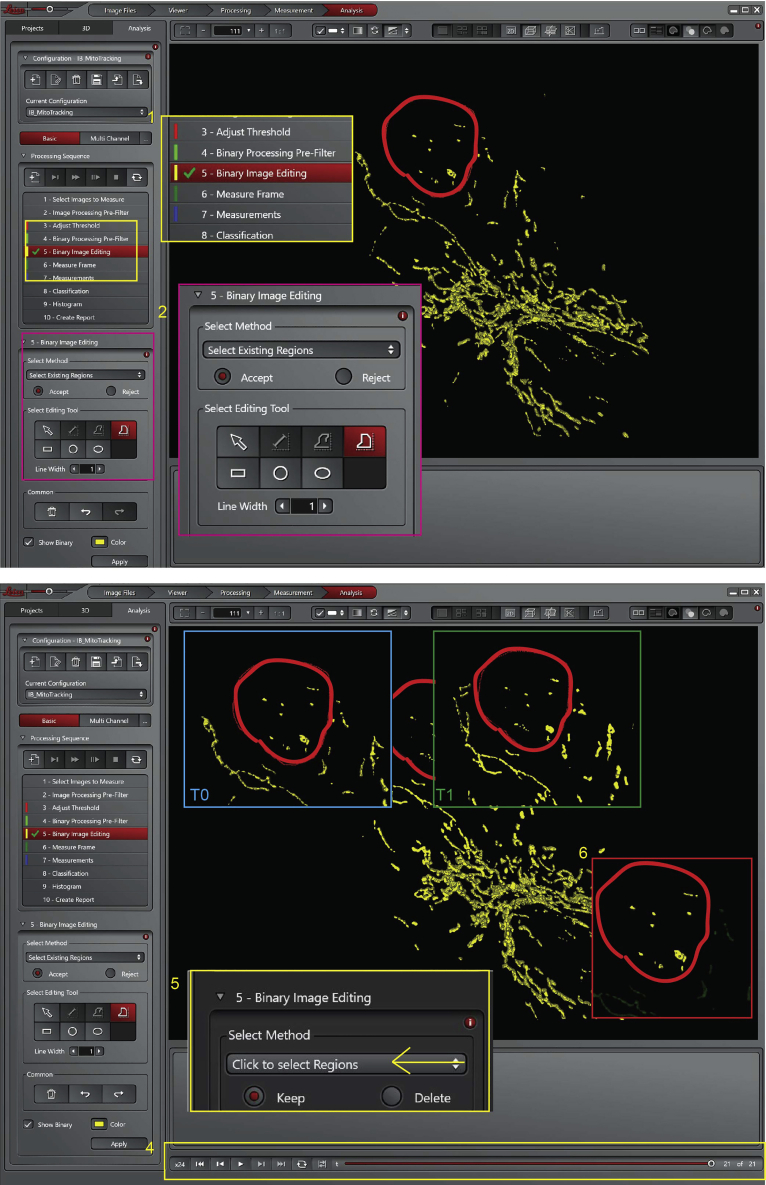
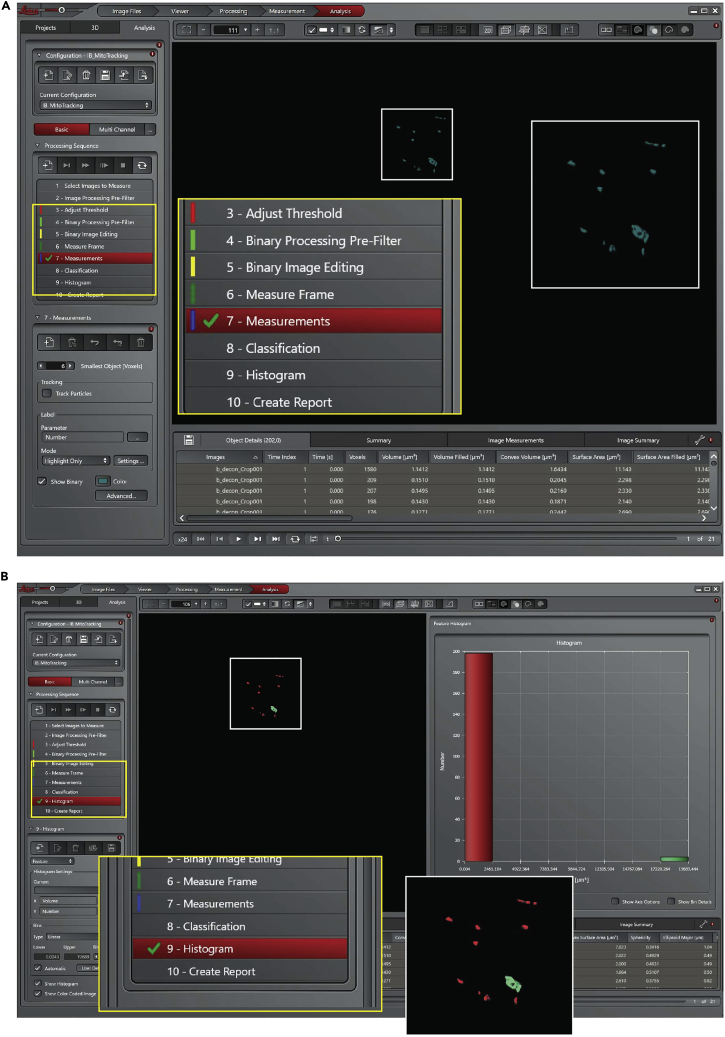
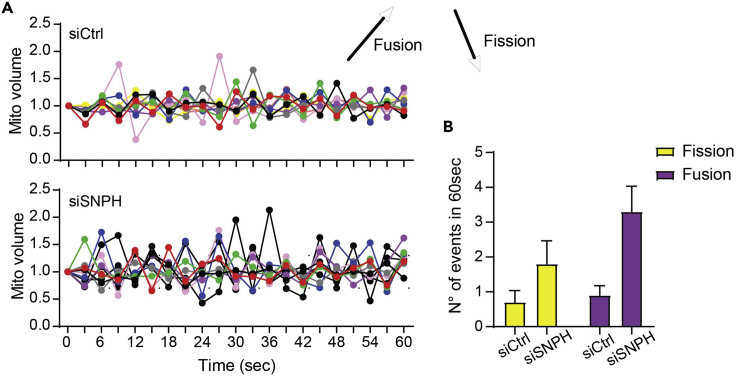
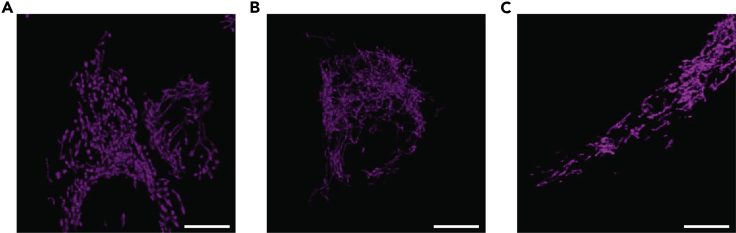
Changes in mitochondrial size, shape, and subcellular position, a process collectively known as mitochondrial dynamics, are exploited for various cancer traits. Modulation of subcellular mitochondrial trafficking and accumulation at the cortical cytoskeleton has been linked to the machinery of cell movements, fueling cell invasion and metastatic spreading. Here, we detail a technique to track changes in mitochondrial volume using a commercial CellLight™ Mitochondria-RFP/GFP reporter and live confocal microscopy. This allows a real-time study of mitochondrial dynamics in live cells. For complete details on the use and execution of this protocol, please refer to Bertolini et al. (2020).

Keywords: Cancer; Microscopy; Molecular/Chemical Probes.


Conflict of interest statement

The authors declare no competing interests.

Figures

None
Graphical abstract
Figure 1
Figure 1
Representative images of cells (A) On the left representative image of cells at the appropriate confluence; on the right representative image of too dense cells. Scale bar = 100 μm. (B) On the left, representative image of well-spread cells; on the right representative image of rounded cells, not properly attached to the dish. Scale bar = 25 μm.
Figure 2
Figure 2
Fluorescence images (40×) of cells transfected with BacMan 2.0 overnight (A) Representative image of non-uniform transfection between different cells. Scale bar = 50 μm. (B) Zoom of well labeled cells that can be used for subsequent study. (C) Zoom of cells with weak mitochondria labeling, not appropriate for subsequent study. Left: B/W image of BacMan 2.0 transfection, right: overlap between BF image and fluorescence image. Scale bar = 25 μm.
Figure 3
Figure 3
Microscope setting
Figure 4
Figure 4
Representative image (acquire with a confocal microscope, 63×) of well-defined mitochondria Scale bar = 100 μm.
Figure 6
Figure 6
Leica Las X software setting Leica Las X software (A) File opening settings, (B) how to open a project, and (C) how to obtain image properties detail.
Figure 7
Figure 7
Export image from Leica Las X to Huygens professional software
Figure 8
Figure 8
Step 13 of the deconvolution process, edit image parameters (A) Open the Edit Microscope Parameters window. (B) Edit Microscope Parameters window.
Figure 9
Figure 9
Steps 14a and 14b of the deconvolution process, starts the deconvolution wizard (A) Open Deconvolution Wizard. (B) Enter Deconvolution Wizard.
Figure 10
Figure 10
Step 14c of the deconvolution process, select the P.S.F. setting
Figure 11
Figure 11
Step 14d of the deconvolution process, cropping tool
Figure 12
Figure 12
Step 14e of the deconvolution process, inspecting the image histogram
Figure 13
Figure 13
Step 14f of the deconvolution process, measurement of the background (A) Automatic estimation of the background. (B) Background estimation.
Figure 14
Figure 14
Step 14g of the deconvolution process, sets up the deconvolution parameters
Figure 15
Figure 15
Step 14h of the deconvolution process, starts the deconvolution (A) Deconvolution results. (B) Save deconvolution template.
Figure 16
Figure 16
Export the deconvolved image from Huygens professional to Leica Las X software (A) Export image to Leica Las X software. (B) Message that confirm the image export.
Figure 5
Figure 5
Example of a 3D deconvolved image Representative 3D image before (A) and after (B) the deconvolution process. Scale bar = 10 μm.
Figure 17
Figure 17
Leica Las X software, step 16 of the analysis process, selects of the image to measure (A) Click on the 3D button. (B) Start the analysis.
Figure 18
Figure 18
Leica Las X software, step 17 of the analysis process, adjust the threshold
Figure 19
Figure 19
Leica Las X software, step 18 of the analysis process, split objects (A) Select objects tool. (B) Setting to split objects.
Figure 20
Figure 20
Leica Las X software, step 19 of the analysis process, selects of the R.O.I
Figure 21
Figure 21
Leica Las X software, steps 20 of the analysis process, measurements and create the histogram (A) Start the measurment of the objects over time. (B) Histogram of the size distribution of the analyzed objects.
Figure 22
Figure 22
Save button
Figure 23
Figure 23
Example of mitochondrial dynamics results (A) Variation of mitochondrial volume overtime, upper graph condition siCtrl and bottom graph condition siSNPH in LN229 cell line. (B) The total number of fission and fusion events in the two different conditions analyzed.
Figure 24
Figure 24
Examples of possible problems during imaging (A) Two cells in the same field of view. (B) Rounded cells not properly attached to the glass. (C) Cells growth with no problem, one cell for field of view and properly attached to the glass. Scale bar = 10 μm.

References

    1. Bertolini I., Ghosh J.C., Kossenkov A.V., Mulugu S., Krishn S.R., Vaira V., Qin J., Plow E.F., Languino L.R., Altieri D.C. Small extracellular vesicle regulation of mitochondrial dynamics reprograms a hypoxic tumor microenvironment. Dev. Cell. 2020;55:163–177.e6. - PMC - PubMed
    1. Caino M.C., Seo J.H., Aguinaldo A., Wait E., Bryant K.G., Kossenkov A.V., Hayden J.E., Vaira V., Morotti A., Ferrero S. A neuronal network of mitochondrial dynamics regulates metastasis. Nat. Commun. 2016;7:13730. - PMC - PubMed
    1. Caino M.C., Seo J.H., Wang Y., Rivadeneira D.B., Gabrilovich D.I., Kim E.T., Weeraratna A.T., Languino L.R., Altieri D.C. Syntaphilin controls a mitochondrial rheostat for proliferation-motility decisions in cancer. J. Clin. Invest. 2017;127:3755–3769. - PMC - PubMed
    1. Li J., Agarwal E., Bertolini I., Seo J.H., Caino M.C., Ghosh J.C., Kossenkov A.V., Liu Q., Tang H.Y., Goldman A.R. The mitophagy effector FUNDC1 controls mitochondrial reprogramming and cellular plasticity in cancer cells. Sci. Signal. 2020;13:eaaz8240. - PMC - PubMed
    1. Wang Y., Agarwal E., Bertolini I., Ghosh J.C., Seo J.H., Altieri D.C. IDH2 reprograms mitochondrial dynamics in cancer through a HIF-1alpha-regulated pseudohypoxic state. FASEB J. 2019;33:13398–13411. - PMC - PubMed

Publication types

Substances

LinkOut - more resources