. 2021 Nov 1;218(11):e20210777.
doi: 10.1084/jem.20210777. Epub 2021 Sep 2.

Arkadia-SKI/SnoN signaling differentially regulates TGF-β-induced iTreg and Th17 cell differentiation

Affiliations

Arkadia-SKI/SnoN signaling differentially regulates TGF-β-induced iTreg and Th17 cell differentiation

Hao Xu et al. J Exp Med. .

Abstract

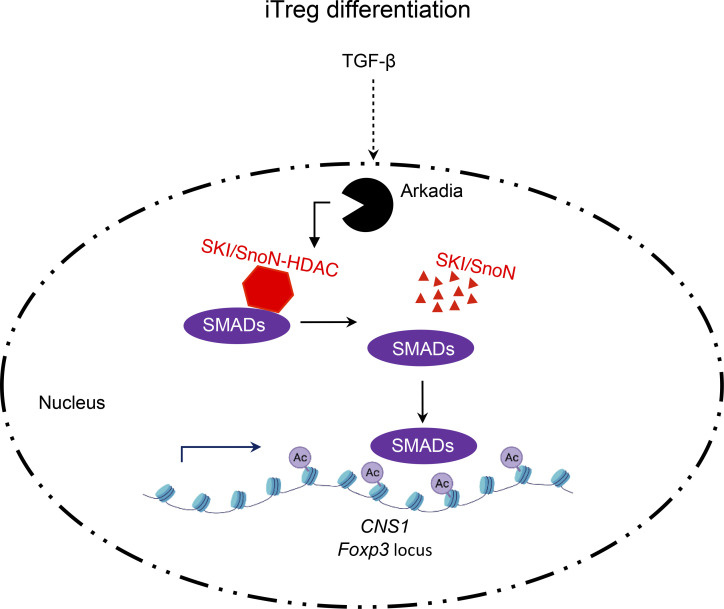
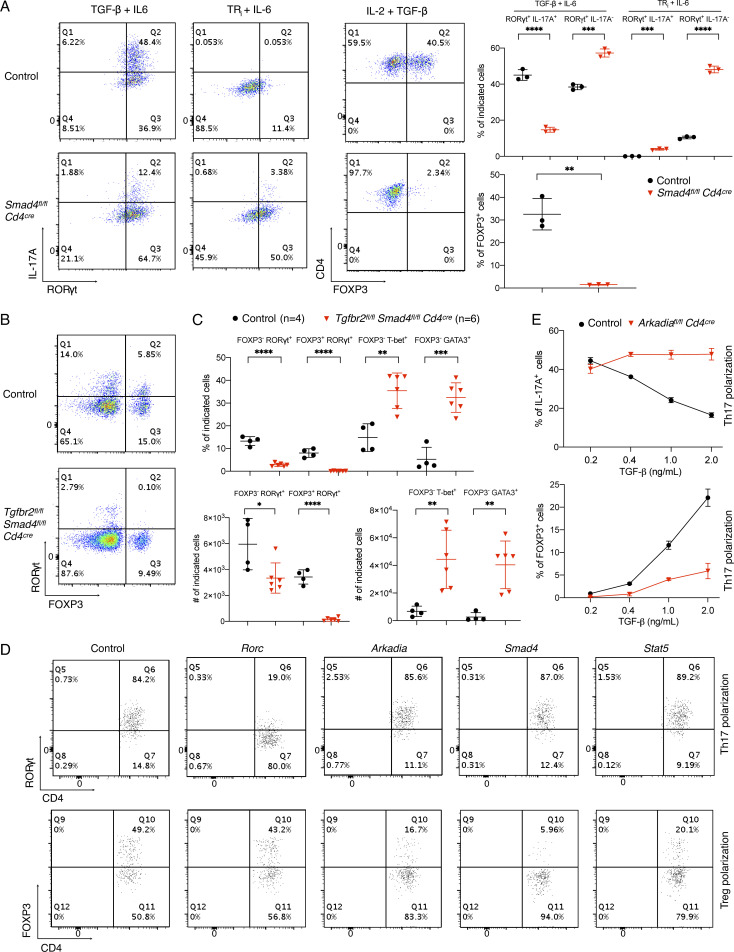
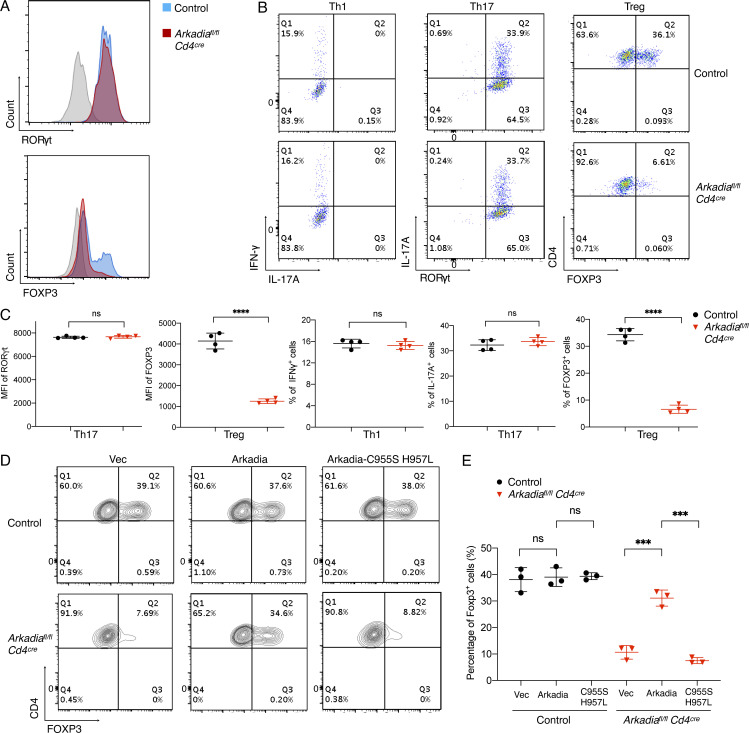
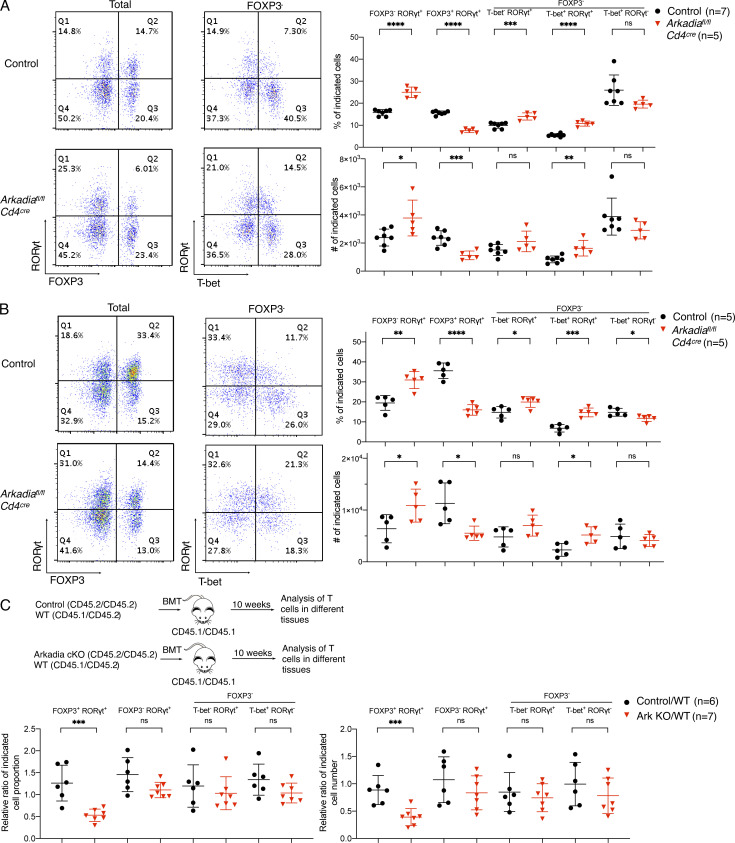
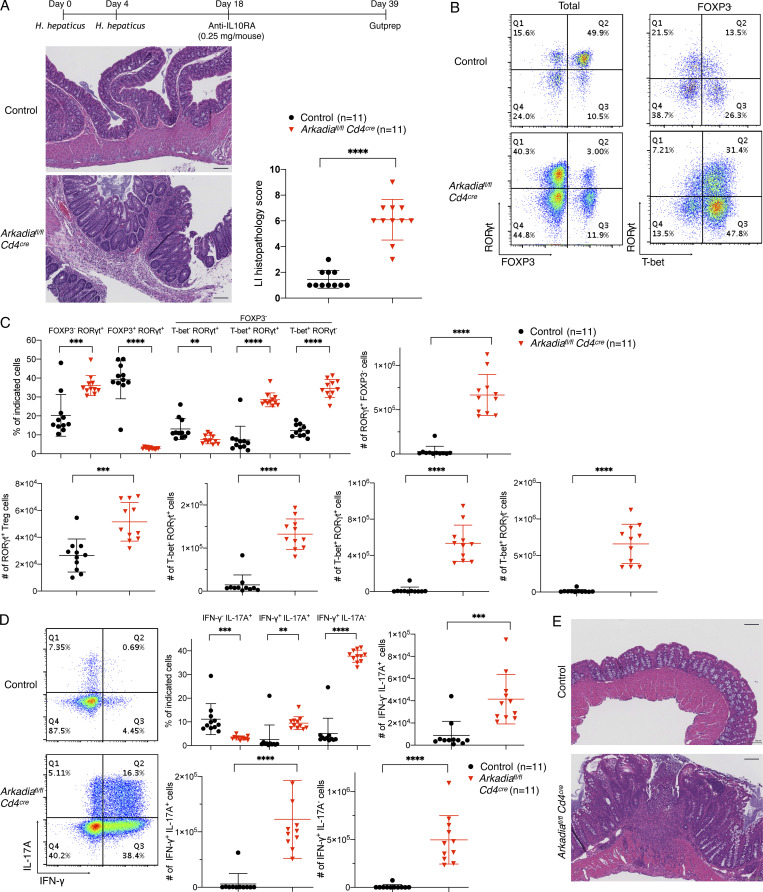
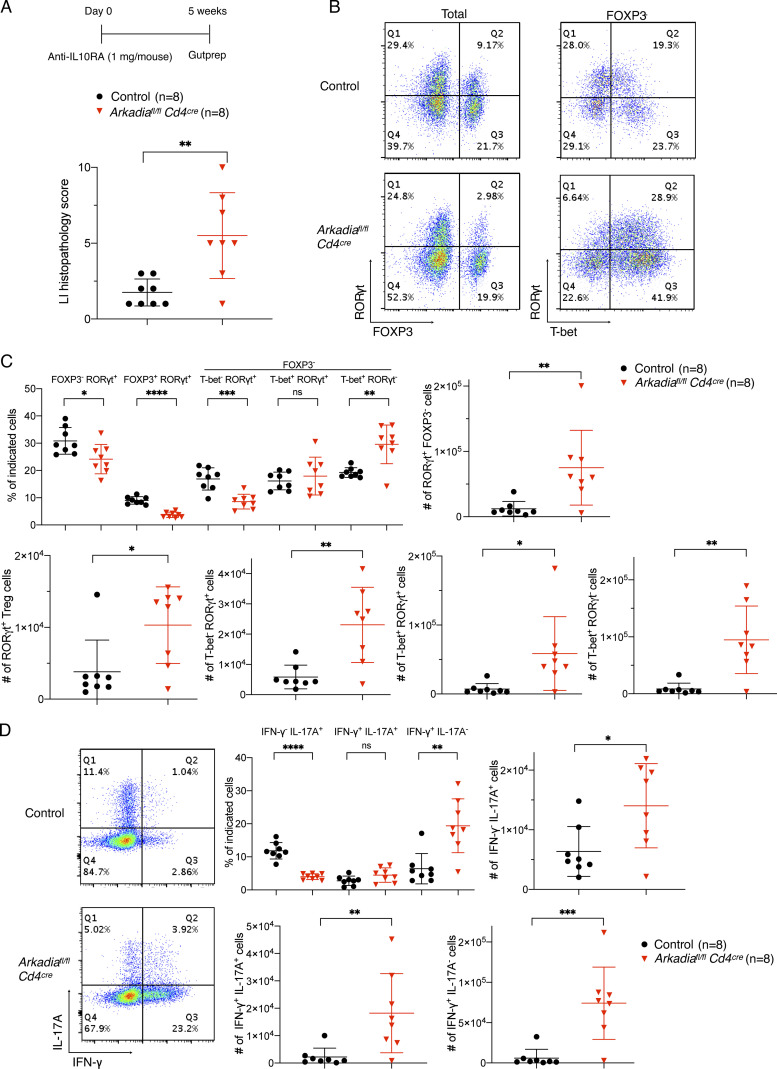
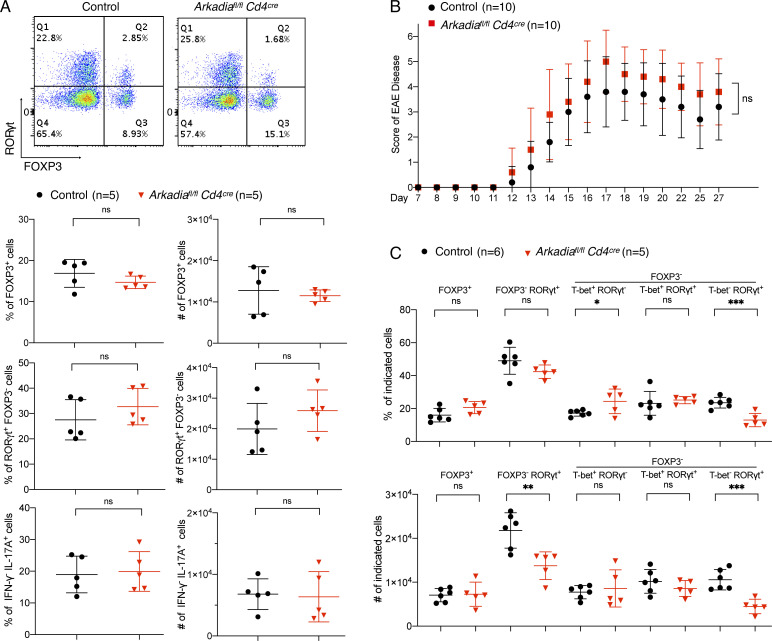
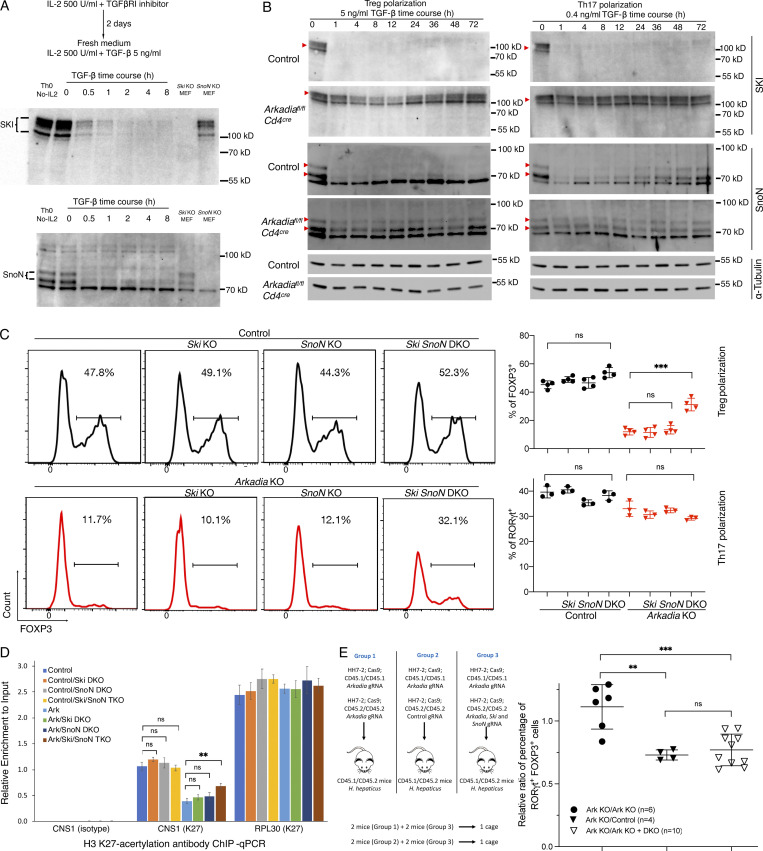
TGF-β signaling is fundamental for both Th17 and regulatory T (Treg) cell differentiation. However, these cells differ in requirements for downstream signaling components, such as SMAD effectors. To further characterize mechanisms that distinguish TGF-β signaling requirements for Th17 and Treg cell differentiation, we investigated the role of Arkadia (RNF111), an E3 ubiquitin ligase that mediates TGF-β signaling during development. Inactivation of Arkadia in CD4+ T cells resulted in impaired Treg cell differentiation in vitro and loss of RORγt+FOXP3+ iTreg cells in the intestinal lamina propria, which increased susceptibility to microbiota-induced mucosal inflammation. In contrast, Arkadia was dispensable for Th17 cell responses. Furthermore, genetic ablation of two Arkadia substrates, the transcriptional corepressors SKI and SnoN, rescued Arkadia-deficient iTreg cell differentiation both in vitro and in vivo. These results reveal distinct TGF-β signaling modules governing Th17 and iTreg cell differentiation programs that could be targeted to selectively modulate T cell functions.


Conflict of interest statement

Disclosures: D.R. Littman reported personal fees from Vor Biopharma, Vedanta Biosciences, and Immunai outside the submitted work. No other disclosures were reported.

Figures

None
Graphical abstract
Figure S1.
Figure S1.
Differential requirement of components of TGF-β signaling pathway in Treg and Th17 cell differentiation, related to Fig. 1. (A) Role of SMAD4 in Th17 and Treg cell differentiation. Left: Representative flow cytometry panels of T cells from control littermates and conditional Smad4 mutant mice, differentiated in vitro under Th17 and Treg cell conditions, or with blockade of TGF-β signaling with TRi (SB525334), an inhibitor of TGF-βR1. Right: Representative data of two independent experiments of T cells differentiated under the indicated conditions. Black circle, control T cells; red triangle, SMAD4-deficient T cells. P values were calculated by unpaired t test. **, P < 0.01; ***, P < 0.001; ****, P < 0.0001. (B) Representative RORγt and FOXP3 staining of CD4+ TCRβ+ T lymphocytes from LILP of control littermates (with at least one allele expressing intact SMAD4 and TGF-βR2) and Tgfbr2fl/fl Smad4fl/fl Cd4cre conditional DKO mice (4–6 wk old) kept under SPF conditions. (C) Proportion and total cell number of indicated T cell populations in the LILP from control (black circle) and Tgfbr2fl/fl Smad4fl/fl Cd4cre mice (red triangle), as shown in B. Data in B and C were combined from two independent experiments. Differences were determined by unpaired t test. *, P < 0.05; **, P < 0.01; ***, P < 0.001; ****, P < 0.0001. (D) Flow cytometry analysis of CD4+ T cells differentiated in vitro under Th17 and Treg conditions following transduction of retroviruses expressing the indicated gRNAs. Naive T cells were from Cas9 transgenic mice, and analysis was performed following gating on the Thy1.1 transduction marker. (E) Flow cytometry to assess percentage of IL-17A (top graph) and FOXP3 (bottom graph) expressing T cells from control littermates (black circle) and Arkadiaf/f Cd4Cre mice (red triangle) polarized in the presence of different concentration of TGF-β plus 20 ng/ml IL-6. Data in D and E are representative of three independent experiments. All error bars represent SD (A, C, and E).
Figure 1.
Figure 1.
Arkadia is selectively required for in vitro Treg cell differentiation. (A) Expression of RORγt and FOXP3 in control and Cd4Cre Arkadiafl/fl T cells differentiated in vitro under Th17 and Treg conditions, respectively. (B) Representative flow cytometry profiles of IFN-γ, IL-17A, RORγt, and FOXP3 in T cells polarized under indicated conditions. (C) Statistical analysis of mean fluorescence intensity (MFI) of RORγt and FOXP3 and percentage of cells expressing IFN-γ, IL-17A, and FOXP3 following in vitro differentiation. (D and E) Rescue of Treg cell differentiation in Arkadia-deficient CD4+ T cells. Representative flow cytometry panels (D) and composite data (E) for FOXP3 expression in control and Arkadia KO Treg cells transduced with lentivirus expressing empty vector (Vec), WT Arkadia (Arkadia), and E3 ligase activity–dead mutant (Arkadia-C955S H957L). Data in A–E are representative of three independent experiments. Error bars represent SD; black circle, control T cells; red triangle, Arkadia-deficient T cells (C and E). Statistics were calculated using unpaired t test. ***, P < 0.001; ****, P < 0.0001.
Figure S2.
Figure S2.
Loss of Arkadia in T cells results in elevated thymic Treg cells but no perturbations in the intestinal T cell compartment of SPF mice, related to Fig. 2. (A) Analysis of thymocyte subsets from control littermates and Arkadia conditional KO mice. Representative flow cytometry panels (left), and proportions and total numbers of double-positive thymocytes from multiple mice (right). (B) Analysis of nTreg cell proportions and numbers among CD4 single-positive T cells from different lymphoid organs of control littermates and Arkadia conditional KO mice. (C) Analysis of GATA3 and FOXP3 expression in CD4+ TCRβ+ T lymphocytes from LILP of control and Arkadia conditional KO mice under SPF conditions. (D) INF-γ and IL-17A production by CD4+ TCRβ+ T lymphocytes from LILP of control and Arkadia conditional KO mice in SPF conditions. Data for C and D are from one of three independent experiments, with n = 13 in the three experiments. Unpaired t test was used for statistical analysis. Black circle, control littermates; red triangle, Arkadia conditional KO mice (A–D). (E) Mice were the same as those in Fig. 2 C. CD4+ CD8 T lymphocytes from different tissues were stained for Helios and FOXP3 to analyze the development of nTreg cells. Relative ratios of frequency and cell number of nTreg cells (Helios+ FOXP3+) are shown, respectively. The relative ratios of cell number were normalized to the ratios of donor B cells in peripheral blood. C1 LN, cecal-colonic draining LN; control/WT, control cell frequency or cell number divided by that of WT cell (black circle); Ark KO/WT, Arkadia mutant cell frequency or cell number divided by that of WT cell (red triangle). Data were obtained from a single experiment with a total of 13 mice for two experimental groups. Ratios of cotransferred cells in each animal were calculated individually and combined for analysis with unpaired t test. All error bars represent SD (A–E).  *, P < 0.05; **, P < 0.01; ***, P < 0.001; ****, P < 0.0001.
Figure 2.
Figure 2.
Arkadia is required for iTreg, but not Th17, cell differentiation in vivo. (A) Analysis of CD4+ TCRβ+ T lymphocytes from LILP of control littermates and Arkadia conditional KO mice under SPF conditions. Left: Representative flow cytometry plots. Right: cell proportions (percentages) and numbers of indicated subpopulations. Data are from one of three independent experiments. n = 13 in the three experiments. (B) Analysis of CD4+ TCRβ+ T lymphocytes from LILP of control littermates and Arkadia mutant mice colonized with H. helicobacter. Data are representative of two independent experiments (n = 10). Statistical analyses in A and B were performed with unpaired t test. Black circle, control littermates; red triangle, Arkadia conditional KO mice (A and B). (C) Top: Experimental scheme for mixed bone marrow chimera experiment (see Materials and methods). Bottom: Relative ratios of iTreg, Th17, and Th1 lymphocytes in reconstituted mice (designated control/WT and Ark KO/WT). Relative ratios of cell number were normalized to the ratios of donor B cells in peripheral blood. Control/WT (black circle) and Ark KO/WT (red triangle): control or Arkadia mutant cell frequency or number divided by that of WT cells. Data are from one experiment with total 13 mice for two experimental groups. Ratios of cotransferred cells in each animal were calculated individually and combined for analysis with unpaired t test. *, P < 0.05; **, P < 0.01; ***, P < 0.001; ****, P < 0.0001. Error bars represent SD.
Figure 3.
Figure 3.
Arkadia is required in T cells to maintain mucosal homeostasis. (A) Top: Schematic of IL-10RA blockade in H. hepaticus–colonized control littermates and Arkadia mutant mice. Bottom: Representative large intestine sections (left) and colitis scores (right). Scale bars on the lower right in intestine sections represent 100 µm. (B) Representative RORγt, FOXP3, and T-bet staining in CD4+ TCRβ+ T lymphocytes isolated from LILP of indicated mice with IL-10RA blockade as shown in A. (C and D) Flow cytometry and statistical analysis of indicated T lymphocyte subpopulations with IL-10RA blockade shown in B. (C) Statistical analysis of indicated subpopulations. (D) Representative flow cytometry staining (left) and statistical analysis (right) of LILP lymphocytes expressing INF-γ and IL-17A. Data in A–D are from two independent experiments (n = 11) combined. (E) Representative H&E staining of large intestine sections from control littermates and Arkadia mutant mice with IL-10RA blockade maintained under SPF conditions. Data are from one experiment with eight mice for each group (n = 8). Scale bars represent 100 µm. Statistical analysis was performed with unpaired t test. (A, C, and D) Black circle, control littermates; red triangle, Arkadia mutant mice. Error bars represent SD. **, P < 0.01; ***, P < 0.001; ****, P < 0.0001.
Figure S3.
Figure S3.
Arkadia-deficient mice are susceptible to immune system perturbation, related to Fig. 3. (A) Scheme of IL-10RA blockade under SPF conditions and analysis of colitis scores in colon of control and Arkadia conditional KO littermates. (B–D) Representative flow cytometry and indicated T cell subpopulations (proportions and numbers) following IL-10RA blockade as shown in A. (B) Representative RORγt, FOXP3, and T-bet expression in CD4+ TCRβ+ T lymphocytes isolated from LILP of indicated mice. (C) Proportions and numbers of indicated T lymphocyte subpopulations. (D) Representative flow cytometry analysis of INF-γ and IL-17A expression (left) and frequencies of cells in each biological replicate (right). Data in A–D represent a single experiment with eight mice for each group (n = 8). Unpaired t test was used for statistical analysis. (A, C, and D) Black circle, control littermates; red triangle, Arkadia conditional KO mice. Error bars represent SD. *, P < 0.05; **, P < 0.01; ***, P < 0.001; ****, P < 0.0001.
Figure 4.
Figure 4.
Arkadia does not influence SFB-dependent Th17 cell differentiation or Th17 cell–mediated EAE. (A) Analysis of RORγt, FOXP3, and effector cytokine expression in T lymphocytes from small intestine lamina propria of mice colonized with SFB. Unpaired t test analysis for one experiment with five control littermates and five Arkadia mutant mice. (B) EAE disease score in control littermates and Arkadia mutant mice. Data are from one experiment with 10 mice per group. EAE clinical scores were analyzed by two-way ANOVA. (C) Statistical analysis of indicated cell populations at peak of EAE disease. Data were collected from six control littermates and five Arkadia mutant mice (independent experiments from B). Differences between experimental groups were determined by unpaired t test. Error bars represent SD. Black circle, control littermates; red triangle, Arkadia mutant mice. *, P < 0.05; **, P < 0.01; ***, P < 0.001.
Figure 5.
Figure 5.
Arkadia degrades SKI and SnoN to regulate iTreg cell differentiation. (A) Validation of SKI and SnoN antibodies. T cells were activated by plate-bound anti-CD3ε and anti-CD28 and cytokine as indicated. Lysates from SKI- or SnoN-deficient MEFs were used as control. Multiple bands of SKI on immunoblot are due to phosphorylation (Marcelain and Hayman, 2005), and there are two isoforms of SnoN (76.4 kD and 71.1 kD). (B) Immunoblot of time course of degradation of SKI and SnoN in control and Arkadia mutant T cells differentiated under the indicated conditions. Red arrowheads indicate SKI and SnoN proteins detected by corresponding antibodies. α-Tubulin (∼50 kD) served as loading control. Data in A and B are representative of two independent experiments. (C) DKO of Ski and SnoN rescues Arkadia-deficient Treg cell differentiation in vitro. T cells electroporated with indicated gRNAs were cultured under Treg or Th17 differentiation conditions (Materials and methods). Left: Representative flow cytometry of Foxp3 expression in Treg conditions. Right: Technical replicates of one of three independent experiments with Treg and Th17 differentiation of CD4+ T cells electroporated with control (circles) or Arkadia-targeting (triangles) gRNAs plus control, Ski, SnoN, and Ski/SnoN (DKO) gRNAs. Statistical analyses were performed with unpaired t test. ***, P < 0.001. Error bars represent SD. (D) Arkadia regulates FOXP3 expression through histone modification at the Foxp3 locus. Differentiated Treg cells electroporated with indicated gRNAs were harvested for ChIP analysis using anti-acetyl-H3K27 or isotype control antibodies. Control, Ski, SnoN, and Ark represent KO of genes by sgRNAs. TKO, triple KO. CNS1, Foxp3 CNS1 region; RPL30, Rpl30 intron 2 region. Representatives of three independent experiments. Statistical analyses were performed with an unpaired t test. Error bars represent SD. **, P < 0.01. (E) DKO of Ski and SnoN rescues iTreg cell differentiation in Arkadia-deficient T cells in vivo. The experiment was performed as shown in the schematic and is described in Materials and methods. Relative ratios of iTreg frequency were calculated by dividing iTreg frequency of CD45.1/CD45.1 cells by that of CD45.2/CD45.2 cells in the recipient mice. To compare experimental groups, the relative ratio in each animal was calculated individually and combined for analysis with unpaired t test. Error bars represent SD. **, P < 0.01; ***, P < 0.001. Data shown are from one experiment with a total of 20 mice.

References

    1. Akiyoshi, S., Inoue H., Hanai J., Kusanagi K., Nemoto N., Miyazono K., and Kawabata M.. 1999. c-Ski acts as a transcriptional co-repressor in transforming growth factor-beta signaling through interaction with smads. J. Biol. Chem. 274:35269–35277. 10.1074/jbc.274.49.35269 - DOI - PubMed
    1. Bettelli, E., Carrier Y., Gao W., Korn T., Strom T.B., Oukka M., Weiner H.L., and Kuchroo V.K.. 2006. Reciprocal developmental pathways for the generation of pathogenic effector TH17 and regulatory T cells. Nature. 441:235–238. 10.1038/nature04753 - DOI - PubMed
    1. Bonni, S., Wang H.R., Causing C.G., Kavsak P., Stroschein S.L., Luo K., and Wrana J.L.. 2001. TGF-beta induces assembly of a Smad2-Smurf2 ubiquitin ligase complex that targets SnoN for degradation. Nat. Cell Biol. 3:587–595. 10.1038/35078562 - DOI - PubMed
    1. Burchill, M.A., Yang J., Vogtenhuber C., Blazar B.R., and Farrar M.A.. 2007. IL-2 receptor beta-dependent STAT5 activation is required for the development of Foxp3+ regulatory T cells. J. Immunol. 178:280–290. 10.4049/jimmunol.178.1.280 - DOI - PubMed
    1. Carthy, J.M., Ioannou M., and Episkopou V.. 2019. Arkadia via SNON enables NODAL-SMAD2/3 signaling effectors to transcribe different genes depending on their levels. bioRxiv. (Preprint posted November 7, 2019) 10.1101/487371 - DOI

Publication types

MeSH terms