

Linear Relationships Between Total Hydrocarbons and Benzene, Toluene, Ethylbenzene, Xylene, and n-Hexane during the Deepwater Horizon Response and Clean-up
- PMID: 34473212
- PMCID: PMC8989044
- DOI: 10.1093/annweh/wxab064
Linear Relationships Between Total Hydrocarbons and Benzene, Toluene, Ethylbenzene, Xylene, and n-Hexane during the Deepwater Horizon Response and Clean-up
Erratum in
-
Correction to: The 2010 Deepwater Horizon Oil Spill: Exposure Assessment of Response and Clean-up Workers.Ann Work Expo Health. 2022 Apr 7;66(Supplement_1):i247-i249. doi: 10.1093/annweh/wxac018. Ann Work Expo Health. 2022. PMID: 35390132 Free PMC article. No abstract available.
Abstract
Objectives: Our objectives were to (i) determine correlations between measurements of THC and of BTEX-H, (ii) apply these linear relationships to predict BTEX-H from measured THC, (iii) use these correlations as informative priors in Bayesian analyses to estimate exposures.
Methods: We used a Bayesian left-censored bivariate framework for all 3 objectives. First, we modeled the relationships (i.e. correlations) between THC and each BTEX-H chemical for various overarching groups of measurements using linear regression to determine if correlations derived from linear relationships differed by various exposure determinants. We then used the same linear regression relationships to predict (or impute) BTEX-H measurements from THC when only THC measurements were available. Finally, we used the same linear relationships as priors for the final exposure models that used real and predicted data to develop exposure estimate statistics for each individual exposure group.
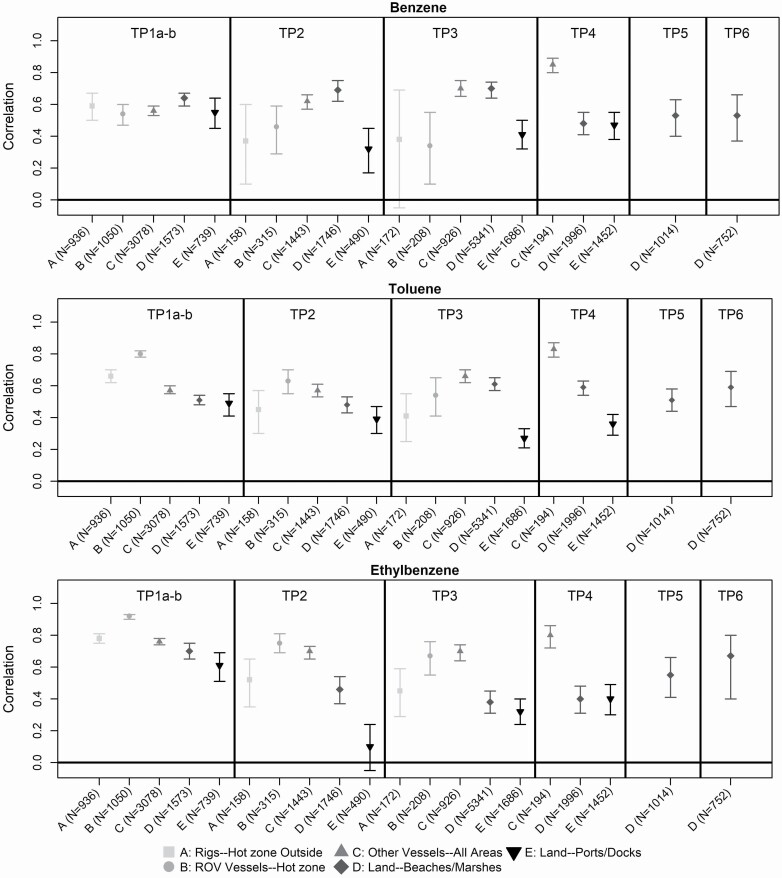
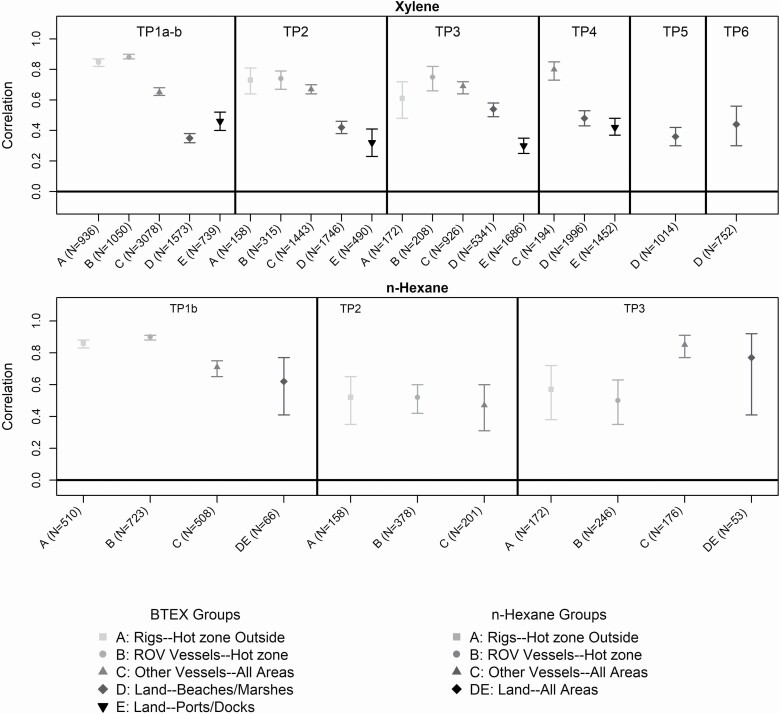
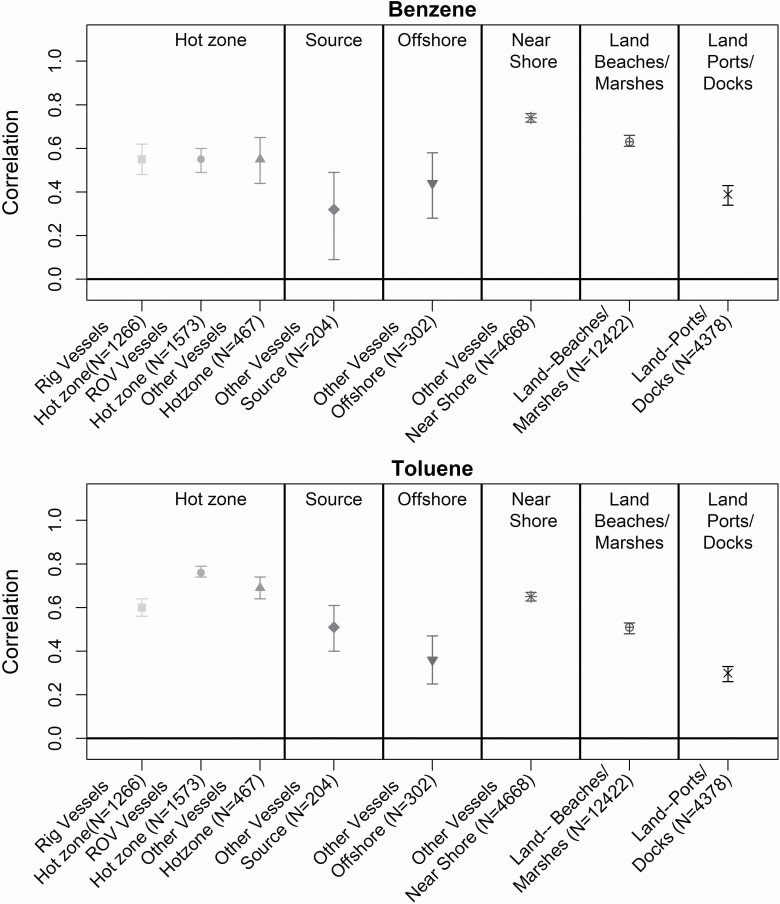
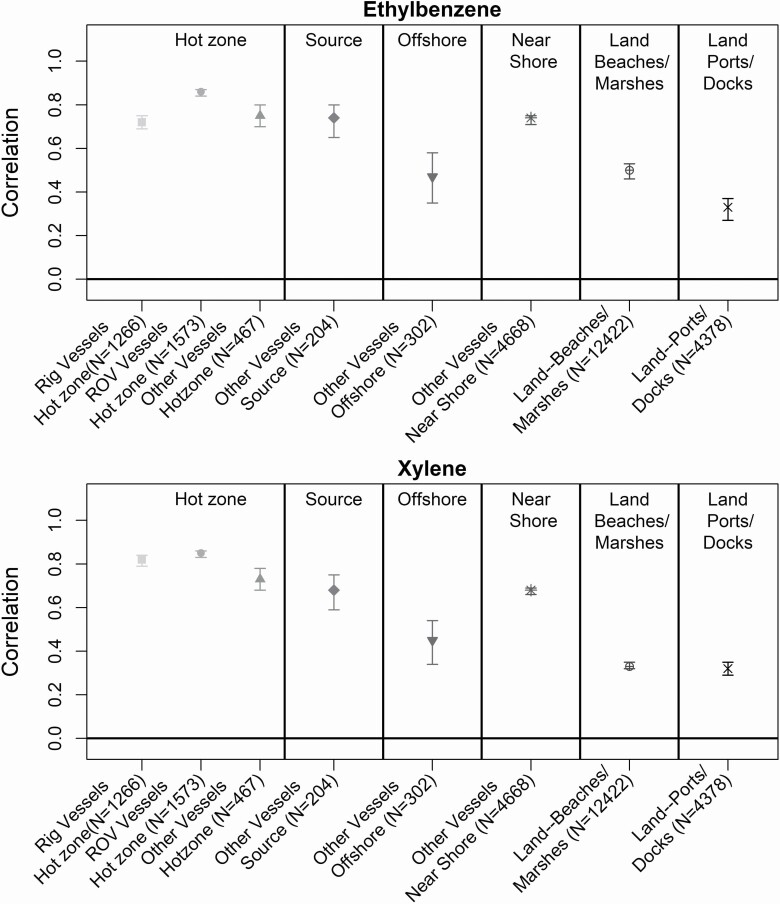
Results: Correlations between measurements of THC and each of the BTEX-H chemicals (n = 120 for each of BTEX, 36 for n-hexane) differed substantially by area of the Gulf of Mexico and by time period that reflected different oil-spill related exposure opportunities. The correlations generally exceeded 0.5. Use of regression relationships to impute missing data resulted in the addition of >23 000 n-hexane and 541 observations for each of BTEX. The relationships were then used as priors for the calculation of exposure statistics while accounting for censored measurement data.
Conclusions: Taking advantage of observed relationships between THC and BTEX-H allowed us to develop robust exposure estimates where a large amount of data were missing, strengthening our exposure estimation process for the epidemiologic study.
Keywords: Deepwater Horizon; n-hexane; BTEX; correlations; determinants of exposure.
© The Author(s) 2021. Published by Oxford University Press on behalf of the British Occupational Hygiene Society.
Figures
References
-
- Brooks S, Gelman A, Jones Get al. (2011) Handbook of Markov chain Monte Carlo. 1st edn.Boca Raton, FL: Chapman & Hall/CRC. ISBN 1420079417.
-
- Carlin BP, Louis TA. (2008) Bayesian methods for data analysis. 3rd edn.Boca Raton, FL: Chapman & Hall/CRC. ISBN 1584886978.
-
- Gelman A, Carlin B, Stern HSet al. (2013) Bayesian data analysis. 3rd edn.Boca Raton, FL: CRC Press. ISBN 1439840954.
-
- Gilks WR, Richardson S, Spiegelhalter D. (1996) Markov chain Monte Carlo in practice. Boca Raton, FL: Chapman & Hall/CRC. ISBN 0412055511.