. 2021 Sep 2;17(9):e1009878.
doi: 10.1371/journal.ppat.1009878. eCollection 2021 Sep.

Differential plasmacytoid dendritic cell phenotype and type I Interferon response in asymptomatic and severe COVID-19 infection

Affiliations

Differential plasmacytoid dendritic cell phenotype and type I Interferon response in asymptomatic and severe COVID-19 infection

Martina Severa et al. PLoS Pathog. .

Abstract

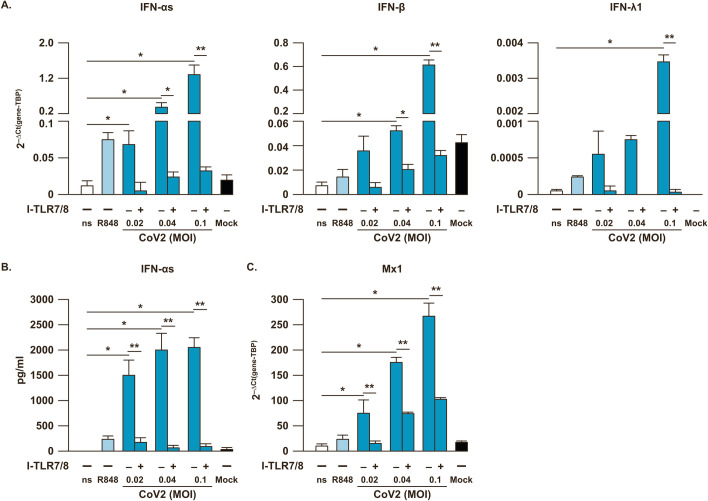
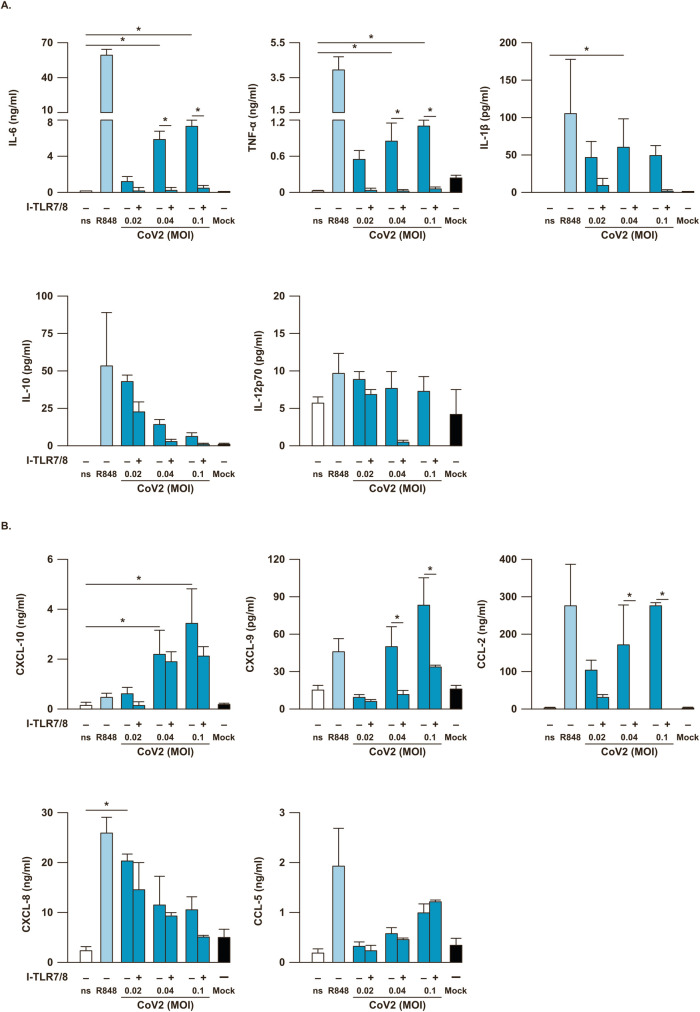
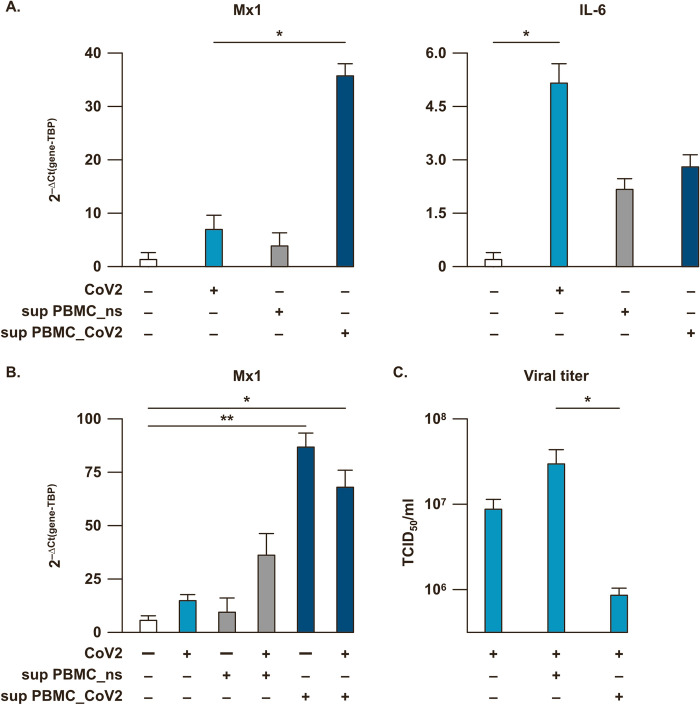
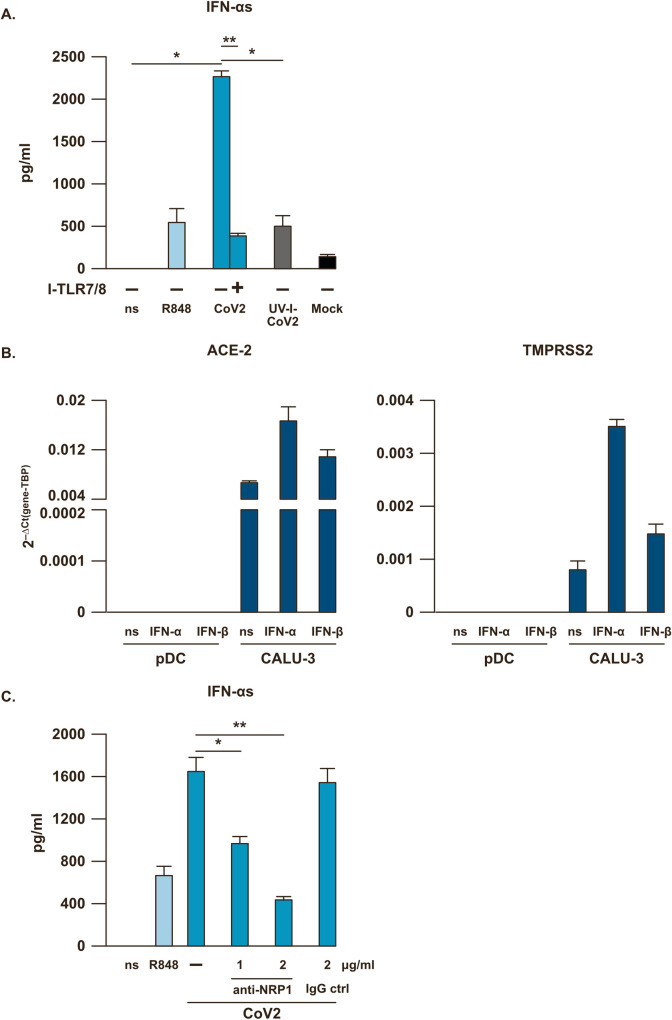
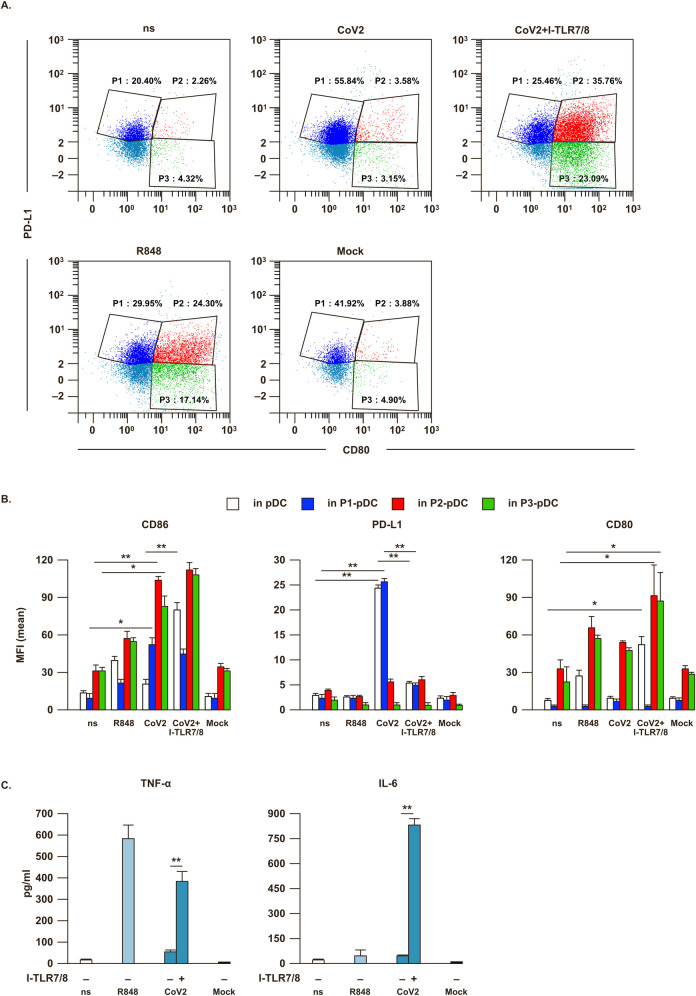
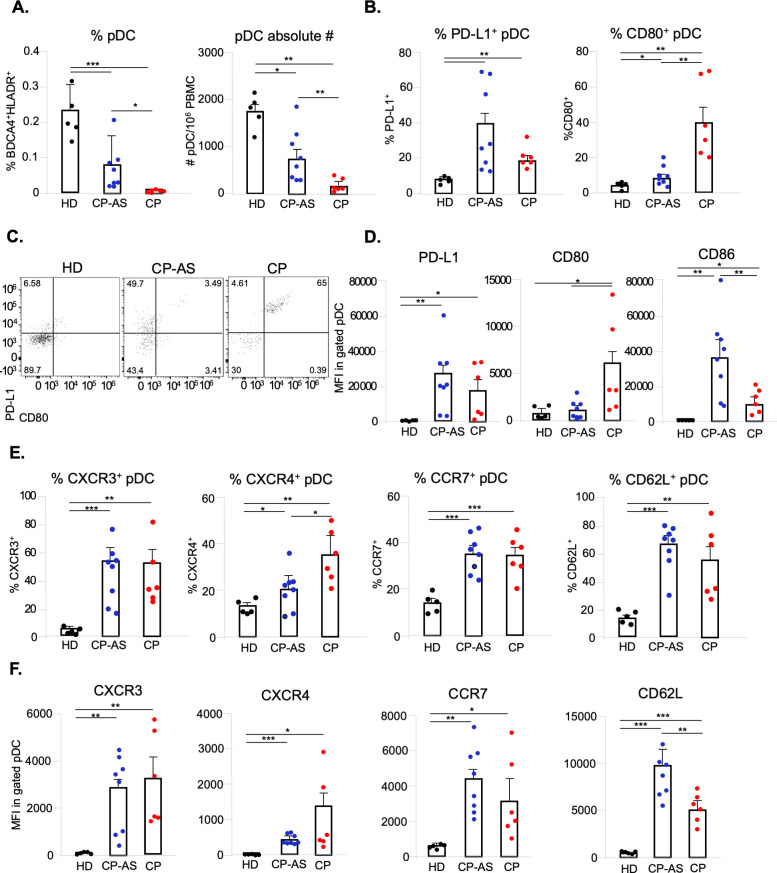
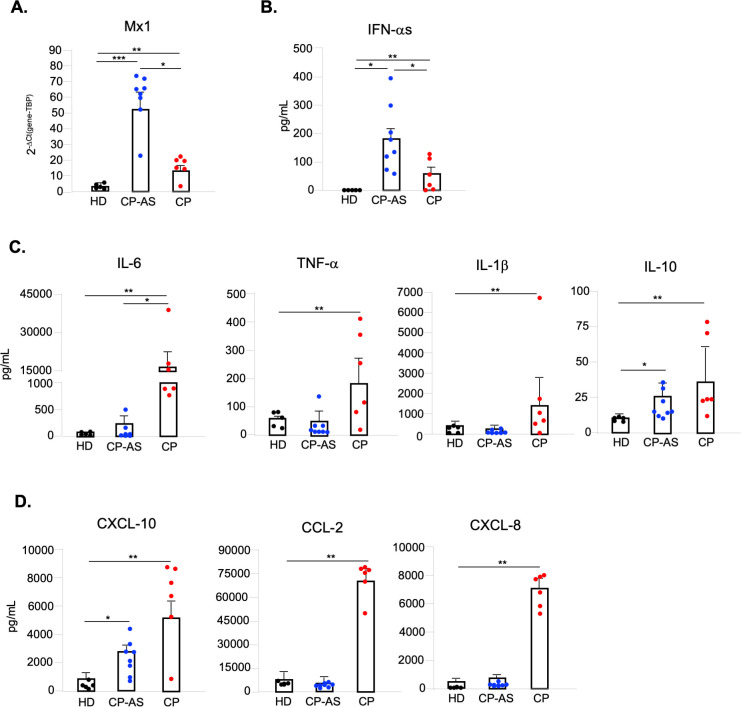
SARS-CoV-2 fine-tunes the interferon (IFN)-induced antiviral responses, which play a key role in preventing coronavirus disease 2019 (COVID-19) progression. Indeed, critically ill patients show an impaired type I IFN response accompanied by elevated inflammatory cytokine and chemokine levels, responsible for cell and tissue damage and associated multi-organ failure. Here, the early interaction between SARS-CoV-2 and immune cells was investigated by interrogating an in vitro human peripheral blood mononuclear cell (PBMC)-based experimental model. We found that, even in absence of a productive viral replication, the virus mediates a vigorous TLR7/8-dependent production of both type I and III IFNs and inflammatory cytokines and chemokines, known to contribute to the cytokine storm observed in COVID-19. Interestingly, we observed how virus-induced type I IFN secreted by PBMC enhances anti-viral response in infected lung epithelial cells, thus, inhibiting viral replication. This type I IFN was released by plasmacytoid dendritic cells (pDC) via an ACE-2-indipendent but Neuropilin-1-dependent mechanism. Viral sensing regulates pDC phenotype by inducing cell surface expression of PD-L1 marker, a feature of type I IFN producing cells. Coherently to what observed in vitro, asymptomatic SARS-CoV-2 infected subjects displayed a similar pDC phenotype associated to a very high serum type I IFN level and induction of anti-viral IFN-stimulated genes in PBMC. Conversely, hospitalized patients with severe COVID-19 display very low frequency of circulating pDC with an inflammatory phenotype and high levels of chemokines and pro-inflammatory cytokines in serum. This study further shed light on the early events resulting from the interaction between SARS-CoV-2 and immune cells occurring in vitro and confirmed ex vivo. These observations can improve our understanding on the contribution of pDC/type I IFN axis in the regulation of the anti-viral state in asymptomatic and severe COVID-19 patients.


Conflict of interest statement

The authors have declared that no competing interests exist.

Figures

Fig 1
Fig 1. SARS-CoV-2 stimulation induces a TLR7/8-dependent type I and III IFN response in PBMC.
Peripheral blood mononuclear cells (PBMC) were left untreated (not stimulated, ns) or Mock-treated as negative controls, or stimulated for 24 hours with the TLR7/8 agonist R848 (5μM) as positive control, with SARS-CoV-2 (CoV2) at different multiplicity of infection (MOI; 0.02, 0.04 and 0.1) in presence or absence of a 30 minute pre-treatment with a specific TLR7/8 inhibitor (I-TLR7/8, 1μM). (A) Relative expression of IFN-αs, IFN-β, IFN-λ1 genes was measured by quantitative real time PCR analysis. All quantification data were normalized to TBP level by using the equation 2-ΔCt. (B) Production of IFN-αs was tested by specific ELISA in 24 hour-collected cell culture supernatants. (C) Mx1 gene expression was quantified by real time PCR as described above. Shown results were mean relative values ± SEM of 5 independent experiments. P-values were depicted as follows: *p≤0.05; ** p≤0.001.
Fig 2
Fig 2. SARS-CoV-2 stimulation induces a TLR7/8-dependent cytokine and chemokine production in PBMC.
Peripheral blood mononuclear cells (PBMC) were left untreated (not stimulated, ns) or Mock-treated as negative controls, or stimulated for 24 hours with the TLR7/8 agonist R848 (5μM) as positive control, with SARS-CoV-2 (CoV2) at different multiplicity of infection (MOI; 0.02, 0.04 and 0.1) in presence or absence of a 30 minute pre-treatment with a specific TLR7/8 inhibitor (I-TLR7/8, 1μM). Production of cytokines (IL-6, TNF-α, IL-1β, IL-10, IL-12p70) (A) and chemokines (CXCL-10, CXCL-9, CCL-2, CXCL-8, CCL-5) (B) was tested by multiparametric cytokine bead arrays in collected cell culture supernatants. Shown results were mean relative values ± SEM of 5 independent experiments. P-values were depicted as follows: *p≤0.05.
Fig 3
Fig 3. Type I IFN-induced anti-viral state impacts on SARS-CoV-2 infected Calu-3 lung epithelial cell line.
(A) The human lung epithelial cell line Calu-3 was left untreated (not stimulated, ns), infected for 24 hours with SARS-CoV-2 at the back titration dose calculated in peripheral blood mononuclear cells (PBMC) (104 TCID50/ml for 0.02 MOI) or treated with 24 hour-supernatants collected from either ns PBMC cultures (sup PBMC_ns) or from SARS-CoV-2 (MOI = 0.02)-treated PBMC cultures (sup PBMC_CoV2). Relative expression of Mx1 and IL-6 genes was measured by quantitative real time PCR analysis. All quantification data were normalized to TBP level by using the equation 2-ΔCt. (B) Calu-3 cell line was infected with SARS-CoV-2 at the back titrated dose calculated in PBMC (104 TCID50/ml for 0.02 MOI) in presence of 24 hour-supernatants collected from either ns PBMC cultures (sup PBMC_ns) or from SARS-CoV-2 (MOI = 0.02)-treated PBMC cultures (sup PBMC_CoV2). Mx1 gene expression was quantified by real time PCR and quantification data normalized to TBP level by using the equation 2-ΔCt. (C) Virus titers were evaluated in supernatants from infected Calu-3 cultures described in (B) by Endpoint Dilution Assay by using the Reed-Muench formula and reported as TCID50/ml. Shown results were mean relative values ± SEM of 3 independent experiments. P-values were depicted as follows: *p≤0.05; ** p≤0.001.
Fig 4
Fig 4. SARS-CoV-2-induced IFN-α production is dependent on TLR7 and Neuropilin 1 in pDC.
(A) Purified plasmacytoid dendritic cells (pDC) were left untreated (not stimulated, ns) or Mock-treated as negative controls, or stimulated for 24 hours with the TLR7/8 agonist R848 (5μM) as positive control, with SARS-CoV-2 (CoV2; MOI = 0.1) in presence or absence of a 30 minute pre-treatment with a specific TLR7/8 inhibitor (I-TLR7/8, 1μM) or with UV-I-SARS-CoV-2 (UV-I-CoV2, MOI = 0.1). IFN-α production was tested by ELISA in collected cell culture supernatants. (B) pDC and Calu-3 cell line were stimulated with 1000 U/mL of recombinant IFN-α or IFN-β. Gene expression of ACE-2 and TMPRSS2 was measured by quantitative RT-PCR. (C) pDC were treated with CoV2 (MOI = 0.1) in presence or absence of a 30 minute pre-treatment with increasing doses of anti-Neuropilin 1 monoclonal antibody (anti-NRP1, 1 or 2 μg/ml) or anti-human IgG control (IgG ctrl, 2 μg/ml). IFN-α production was tested by ELISA in culture supernatants. Shown results were mean relative values ± SEM of 3 independent experiments. P-values were depicted as follows: *p≤0.05; ** p≤0.001.
Fig 5
Fig 5. SARS-CoV-2 stimulation drives TLR7-dependent phenotypical modification in pDC.
Purified plasmacytoid dendritic cells (pDC) were either left untreated (not stimulated, ns) or Mock-treated as negative controls, or stimulated for 24 hours with the TLR7/8 agonist R848 (5μM) as positive control, with SARS-CoV-2 (CoV2; MOI = 0.1) in presence or absence of a 30 minute pre-treatment with a specific TLR7/8 inhibitor (I-TLR7/8, 1μM). (A) pDC were then stained with anti-BDCA4, PD-L1, CD80 and CD86 antibodies. The percentage (%) of pDC sub-populations was evaluated by flow cytometry in live/single BDCA4+ pDC; in particular P1-pDC (PD-L1+CD80-, in blue), P2-pDC (PD-L1+CD80+, in red) and P3-pDC (PD-L1-CD80+, in green). Representative dot plot profile out of 3 different experiments independently conducted is shown. (B) Surface expression of CD86, PD-L1 and CD80 was determined as mean fluorescence intensity (MFI) by flow cytometer analysis. (C) Production of TNF-α and IL-6 was tested by cytometric bead assay in 24 hour-collected pDC culture supernatants. Shown results were mean relative values ± SEM of 3 independent experiments. P-values were depicted as follows: *p≤0.05; ** p≤0.001.
Fig 6
Fig 6. pDC differently activate and express chemokine receptors in COVID-19 asymptomatic and hospitalized patients.
Freshly isolated peripheral blood mononuclear cells (PBMC) from asymptomatic (CP-AS, n = 8) and hospitalized COVID-19 patients (CP, n = 6) as well as matched healthy donors (HD, n = 5) were stained with a cocktails of antibodies to study by flow cytometry plasmacytoid dendritic cell (pDC) frequency and absolute number (A), diversification and activation status (Lineage, CD123, BDCA-4, HLA-DR, PD-L1, CD80 and CD86) (B, C, D), as well as expression of chemokine receptors (CXCR4, CXCR3, CCR7 and CD62-L) (E, F). The percentage (%) of shown pDC sub-populations (B, C, E) was evaluated in live/single Lineage-CD123+BDCA4+HLADR+ gated pDC and depicted for each studied patients or HD together with mean ± SEM values. Surface expression of PD-L1, CD80, CD86 (D) and CXCR4, CXCR3, CD62-L, CCR7 (F), was determined as mean fluorescence intensity (MFI) and shown results were mean relative values ± SEM of analyzed patients or HD. P-values were depicted as follows: *p≤0.05; ** p≤0.001; *** p≤0.0001.
Fig 7
Fig 7. COVID-19 asymptomatic and hospitalized patients display a specular anti-viral and pro-inflammatory profile.
Peripheral blood mononuclear cells (PBMC) and sera were collected from asymptomatic (CP-AS, n = 8) and hospitalized COVID-19 patients (CP, n = 6) as well as matched healthy donors (HD, n = 5). (A) Relative expression of Mx1 gene was measured by quantitative real time PCR analysis and normalized to TBP level by using the equation 2-ΔCt in total RNA isolated from ex vivo PBMC. (B) Production of IFN-αs was tested in serum samples by a specific ELISA kit. Production of cytokines (IL-6, TNF-α, IL-1β, IL-10) (C) and chemokines (CXCL-10, CCL-2, CXCL-8) (D) was tested by multiparametric cytokine bead arrays in collected serum samples. Shown results were mean relative values ± SEM of analyzed patients or HD. P-values were depicted as follows: *p≤0.05; ** p≤0.001; *** p≤0.0001.

References

    1. Huang C., Wang Y., Li X., Ren L., Zhao J., Hu Y., et al., Clinical features of patients infected with 2019 novel coronavirus in Wuhan, China. Lancet, 2020. 395(10223): p. 497–506. doi: 10.1016/S0140-6736(20)30183-5 - DOI - PMC - PubMed
    1. Lavezzo E., Franchin E., Ciavarella C., Cuomo-Dannenburg G., Barzon L., Del Vecchio C., et al., Suppression of a SARS-CoV-2 outbreak in the Italian municipality of Vo’. Nature, 2020. 584(7821): p. 425–429. doi: 10.1038/s41586-020-2488-1 - DOI - PubMed
    1. Ding Q., Lu P., Fan Y., Xia Y., and Liu M., The clinical characteristics of pneumonia patients coinfected with 2019 novel coronavirus and influenza virus in Wuhan, China. J Med Virol, 2020. doi: 10.1002/jmv.25781 - DOI - PMC - PubMed
    1. McGonagle D., O’Donnell J.S., Sharif K., Emery P., and Bridgewood C., Immune mechanisms of pulmonary intravascular coagulopathy in COVID-19 pneumonia. Lancet Rheumatol, 2020. 2(7): p. e437–e445. doi: 10.1016/S2665-9913(20)30121-1 - DOI - PMC - PubMed
    1. Byambasuren O., Cardona M., Bell K., Clark J., McLaws M., and Glasziou P., Estimating the extent of asymptomatic COVID-19 and its potential for community transmission: Systematic review and meta-analysis JAMMI, 2020. 10.3138/jammi-2020-0030. - DOI - PMC - PubMed

Publication types

MeSH terms