. 2021 Nov 3;109(21):3402-3420.e9.
doi: 10.1016/j.neuron.2021.08.003. Epub 2021 Sep 1.

Stem cell-derived neurons reflect features of protein networks, neuropathology, and cognitive outcome of their aged human donors

Affiliations

Stem cell-derived neurons reflect features of protein networks, neuropathology, and cognitive outcome of their aged human donors

Valentina N Lagomarsino et al. Neuron. .

Abstract

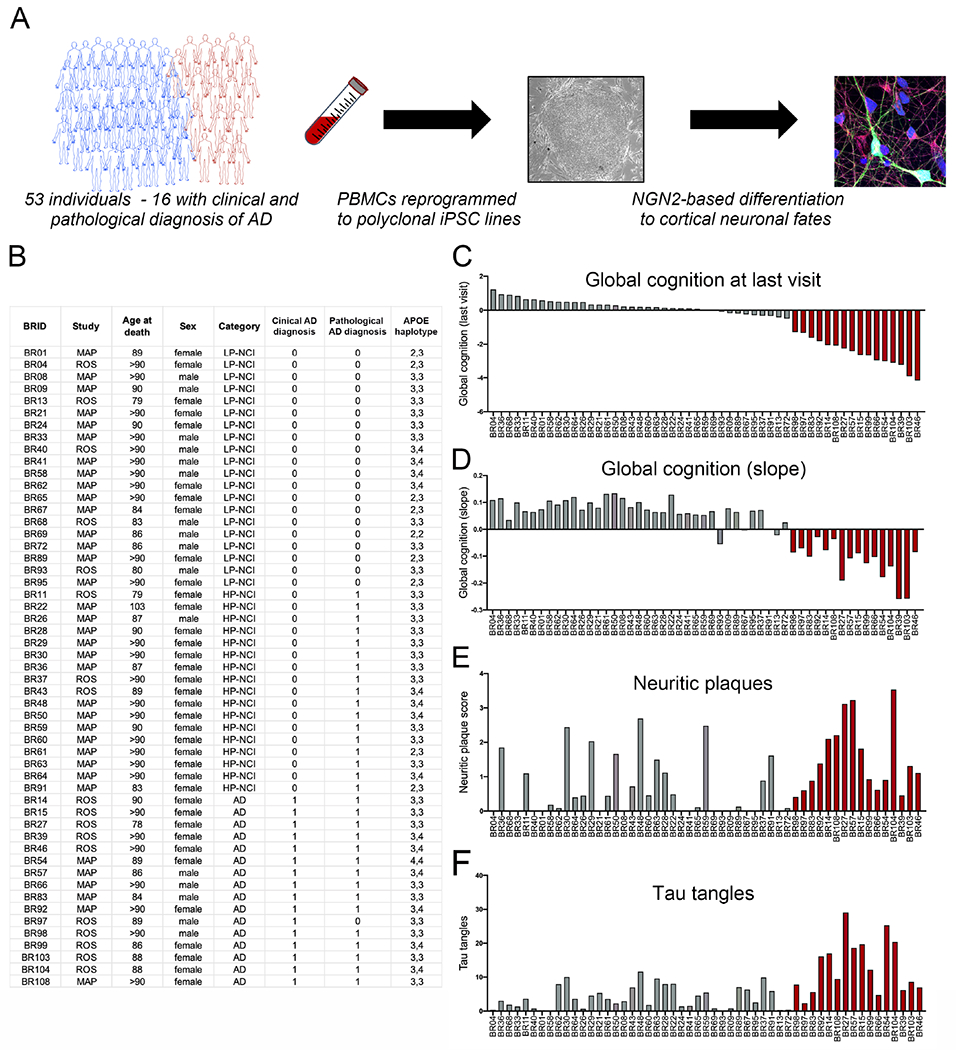
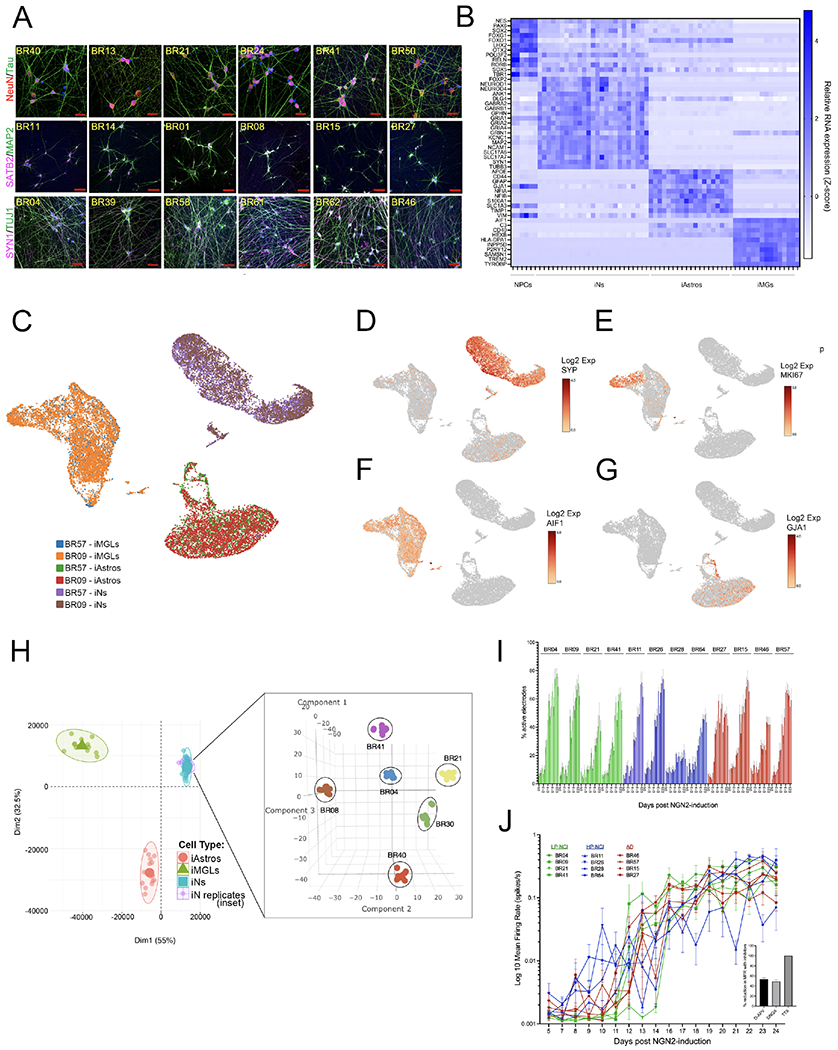
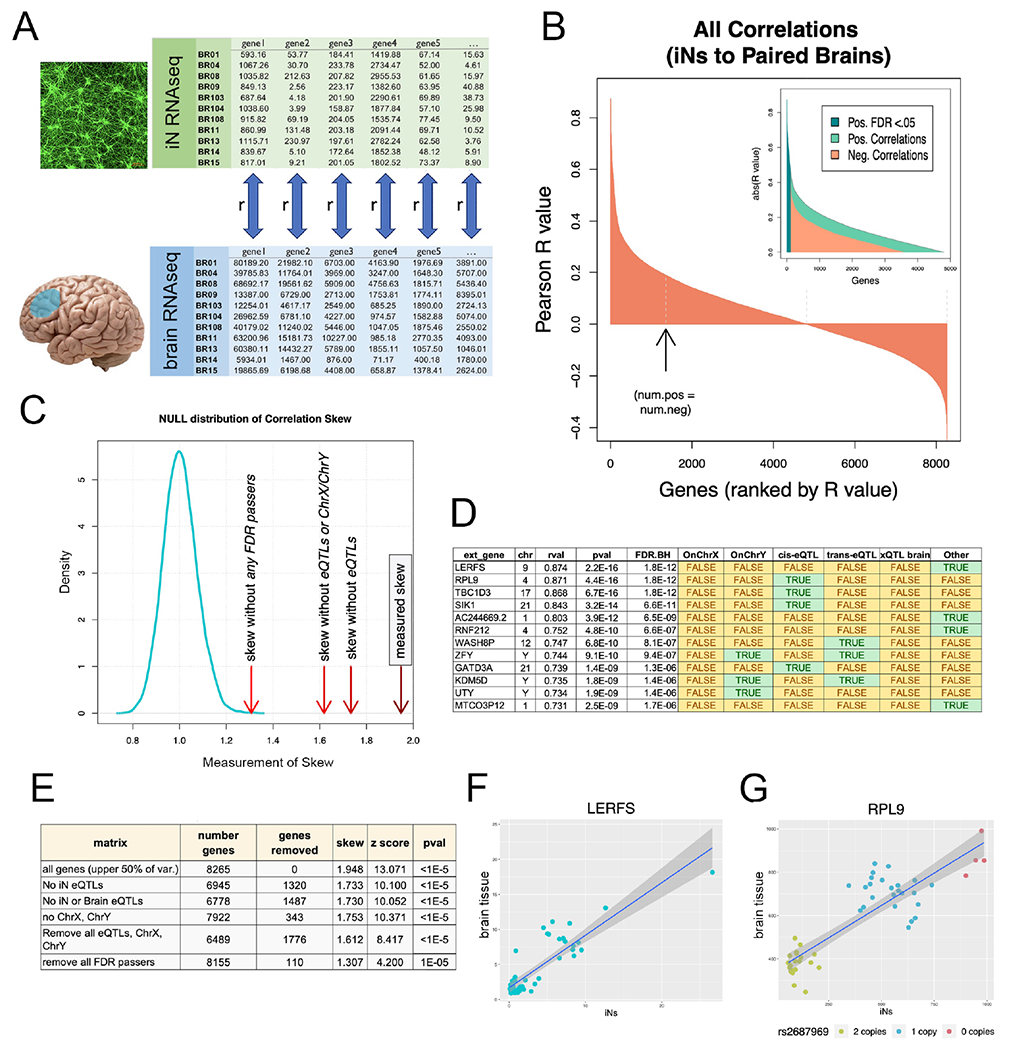
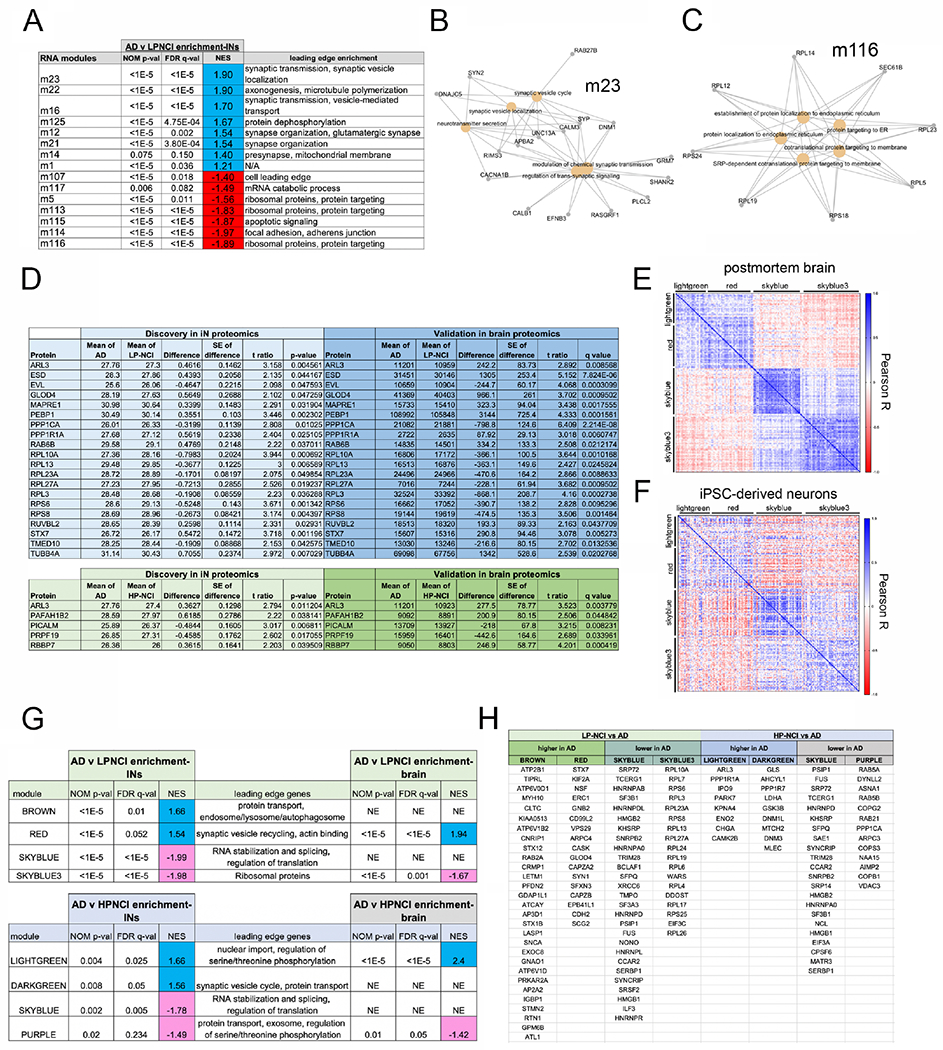
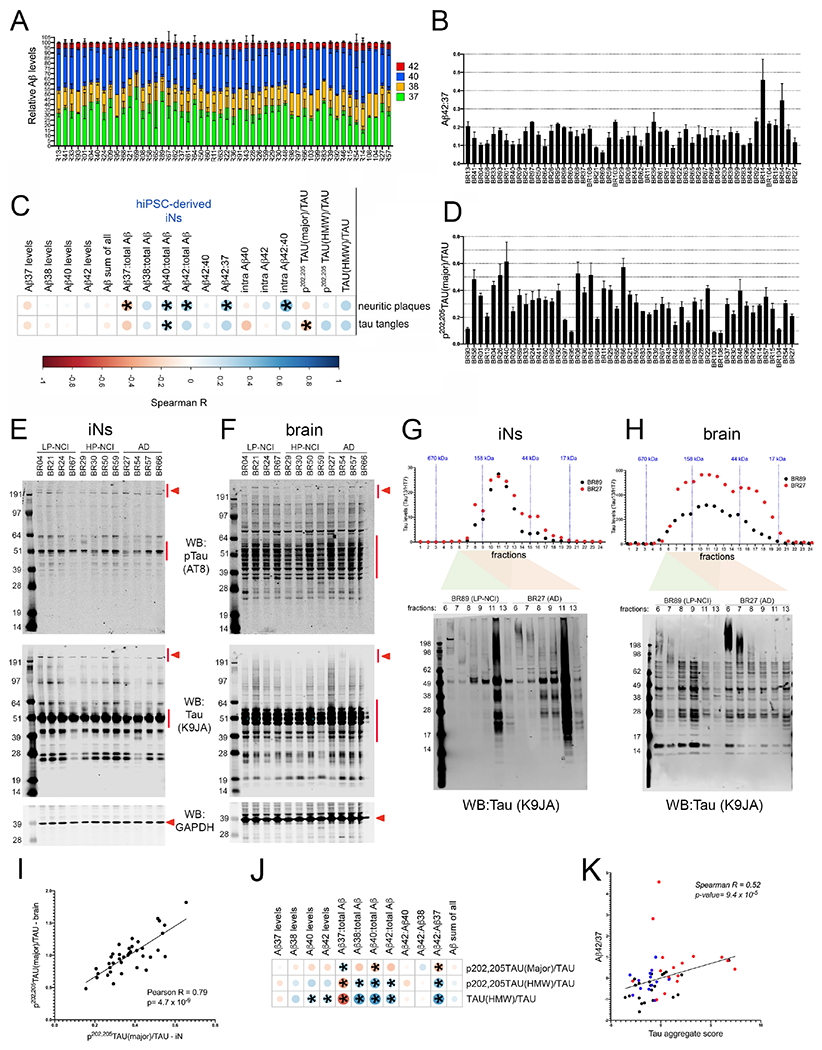
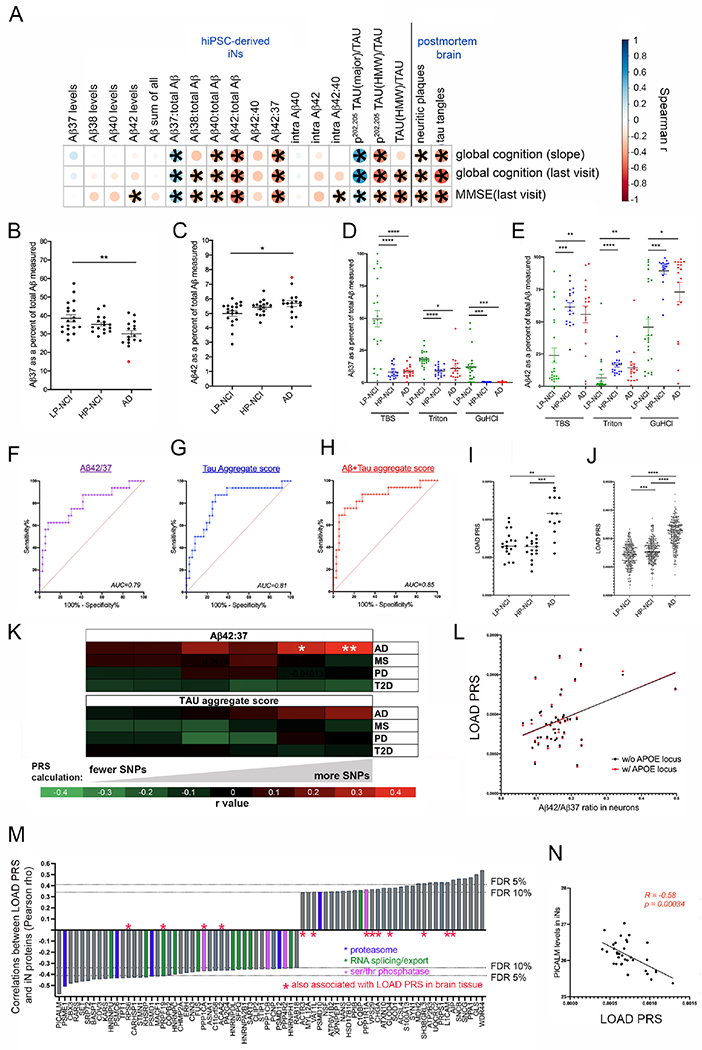
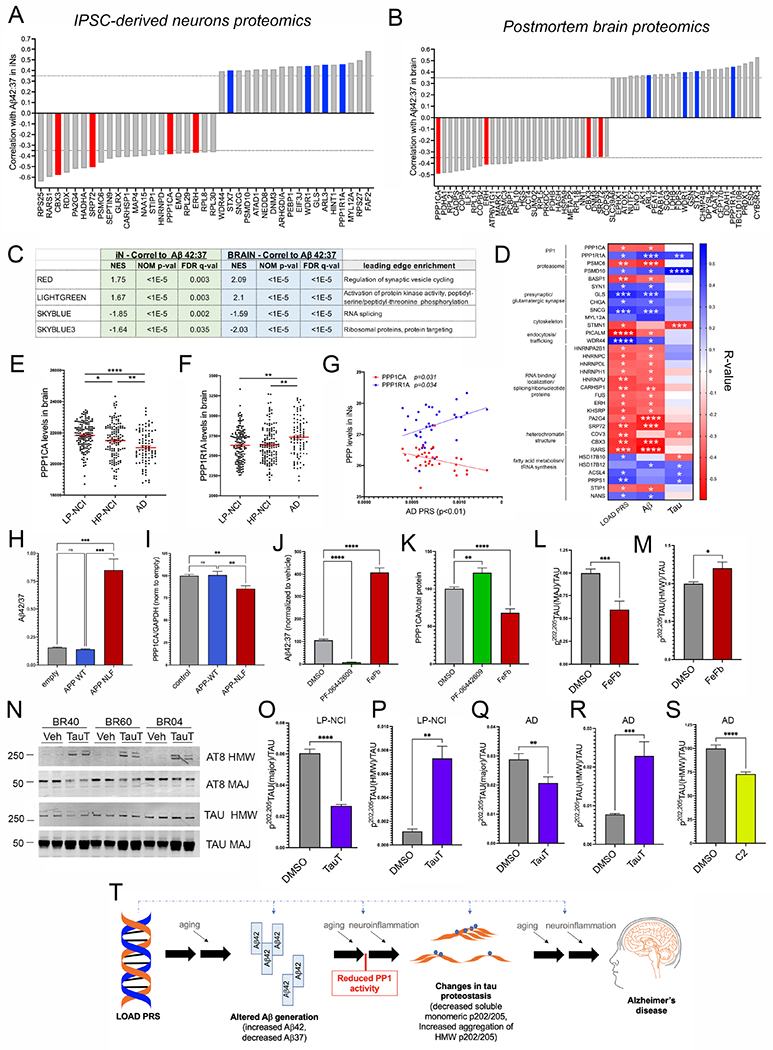
We have generated a controlled and manipulable resource that captures genetic risk for Alzheimer's disease: iPSC lines from 53 individuals coupled with RNA and proteomic profiling of both iPSC-derived neurons and brain tissue of the same individuals. Data collected for each person include genome sequencing, longitudinal cognitive scores, and quantitative neuropathology. The utility of this resource is exemplified here by analyses of neurons derived from these lines, revealing significant associations between specific Aβ and tau species and the levels of plaque and tangle deposition in the brain and, more importantly, with the trajectory of cognitive decline. Proteins and networks are identified that are associated with AD phenotypes in iPSC neurons, and relevant associations are validated in brain. The data presented establish this iPSC collection as a resource for investigating person-specific processes in the brain that can aid in identifying and validating molecular pathways underlying AD.

Keywords: Alzheimer’s; Aβ; LOAD; MAPT; PP1; PRS; genetics; iPSC; neuron; tau.


Conflict of interest statement

Declaration of interests D.J.S. is a director and consultant for Prothena Biosciences.

Figures

Figure 1.
Figure 1.. Generation of human iPSC lines from ROS and MAP cohorts.
(A) Overview of the study. (B-F) Relevant data on ROS/MAP participants from whom iPSC lines were generated, each line identified using a BWH identifier (BRID). Quantification of plaques in the brain by modified Bielschowsky’s Silver Stain (E), paired helical filament tau by immunostaining using AT8 (F). Red bars display data from those individuals with both a clinical and pathological diagnosis of AD. See also Figures S1, S2.
Figure 2.
Figure 2.. Consistent differentiation of iPSC lines to neuronal fate.
(A) Example images of immunostaining for neuronal markers across iNs from multiple iPSC lines. DNA is stained with DAPI, scale bars = 50μM (B) Heat map of cell fate markers in iNs across lines, determined by RNAseq and compared to other iPSC-derivatives including neural progenitor cell (NPC), astrocyte (iAstro), and microglialike (iMG) fates. There were no significant differences in cell fate marker expression between NCI and AD individuals (t-test, with Holm-Sidak multiple comparisons test; q-values all >0.75). (C-G) iPSCs from two donors (BR09, BR57) differentiated to neuronal, astrocyte, and microglial fates in parallel. On the day of harvest iNs were d21, iAstros were d28 and iMGs were d43. Cells from the two donors were pooled and single nucleus RNAseq libraries prepared. UMAP plots show consistency across lines at the single cell level (C), with expression of the neuronal marker SYP (D) in >95% of cells in iN cultures, and <1% of the iN cells expressed the proliferation marker MKI67 (E), the microglial marker AIF1 (IBA1), or the astrocyte marker GJA1 (G). (H) Bulk RNAseq was performed on iNs derived from 6 lines over 6 different batches of differentiation. After controlling for sequencing batch, tSNE analysis showed tight clustering of iN samples by genotype. Data are shown as an inset within another plot showing their location within PCA space relative to other iPSC-derived cell types. (I,J) Percentage of active electrodes up to d24 of differentiation (I) and well-level mean firing rate over time (J), measured in multi-electrode arrays for 12 lines, n=8 wells/line (16 electrodes/well). After the last recording, wells were treated either with vehicle, TTX, DNQX or AP-5 and activity recorded for 30 mins. Inset shows the electrode-level percent reduction in mean firing rate (MFR) with each compound relative to vehicle, comparing pre-treatment recording to the post-treatment recording. Shown is mean +/−SEM, n>195 electrodes/condition. See also Figure S3.
Figure 3.
Figure 3.. Congruence of gene expression profiles between neuronal cultures and brain.
(A) RNAseq profiles from iNs and corresponding brain samples (mPFC) were compared. For each gene in the upper half of percentage variance, a Pearson correlation (rval) was calculated between iNs and brain across 49 human subjects. (B) Waterfall plot of rvals for all 8,265 genes. Arrow denotes point where the number of positive rvals equals the number of negative rvals. 110 genes had correlations that individually passed Benjamini-Hochberg multiple comparisons testing (FDR q<0.05). (C) Positive skew of all rvals as a population was measured by dividing the sum of the highest 100 rvals to the absolute value of the lowest 100 rvals. Density plot of null distribution of skews is shown. The measured skew is significantly higher than what would be expected by chance even after successively removing eQTLs and sex chromosome genes from the dataset (red arrows to the right of null distribution). (D) Top 12 genes with expression correlated between iN and brain. Green shaded cells indicate membership in one of the tested gene sets (sex chromosomes, iN cis and trans eQTLs, brain eQTLs). (E) Table of the number of genes compared after successive gene set removal and effect on skew and significance (z score and pvals) of skew comparison to null distribution. (F) Correlation plot of top correlation (LERFS) between iNs and brain. Each dot indicates a single human subject with expression in iNs on the x-axis and expression in brain on the y-axis. (G) Same plot for RPL9, top cis-eQTL correlation. Dot colors indicate copy number of rs2687969 SNP. See also Figure S4, Table S1.
Figure 4.
Figure 4.. Brain-derived modules of RNA and protein co-expression are associated with AD diagnosis in both iNs and prefrontal cortex.
(A-C) Differential gene expression analyses were performed between LP-NCI and AD iNs and between HP-NCI and AD iNs, with GSEA to examine enrichment in brain-derived co-expression modules generated from ROS-MAP DL-PFC brain tissue (Mostafavi et al., 2018). See also Table S2 showing all genes with an uncorrected p-value<0.05 (t-test) in the iN RNAseq dataset that then showed concordant differences (FDR q<0.05) in a better powered brain RNAseq data set (Mostafavi et al., 2018). A) Table of modules significantly enriched in genes upregulated (blue) or down regulated (red) in AD. For iNs n=18 LP-NCI, 15 HP-NCI, 16 AD; t-tests performed. For brain, n=196 LP-NCI, 171 HP-NCI, 212 AD; t-test with multiple comparisons testing: FDR calculation using Benjamini, Krieger, and Yekutieli (BKY). (B, C) Gene-concept networks of GSEA leading edge genes in m23 and m116. (D-H) Proteomic analyses of iNs, comparing AD to LP-NCI or HP-NCI. Shown in (D) are all proteins that met an uncorrected p-val<0.05 in iNs, which then showed concordant changes in a better powered brain dataset (FDR q<0.05). For iNs n=16 LP-NCI, 14 HP-NCI, 8 AD; t-tests performed. For brain, n=138 LP-NCI, 131 HP-NCI, 100 AD; t-test with multiple comparisons testing: FDR calculation using BKY. (E-H) GSEA using protein modules from frontal cortex to compare proteomic results between AD and LP-NCI or HP-NCI iNs. Pearson correlations between each module protein for both brain (E) and iNs (F). Heat maps of correlations show concordant patterns of association between modules and within modules between brain and iNs. Table (G) shows brain-derived modules enriched in AD vs LPNCI and AD vs HPNCI comparisons using GSEA analysis. Rank files for GSEA analyses of all genes were generated by calculating the −log10(pval) from Student’s t (2-sided unpaired, heteroscedastic) comparison and signed to reflect the directionality of differential expression. Leading edge genes for each module with significant enrichment are shown (H). NE = not enriched; NES = normalized enrichment score. See also Figure S5, Table S3.
Figure 5.
Figure 5.. Significant association between Aβ and tau species in neuronal cultures and postmortem plaque and tangle pathology in the brain.
A-F) Aβ37, 38, 40 and 42 were quantified from the media of iNs and Aβ40 and 42 also were measured in cell lysate (“intraAβ”) by ELISA. Tau was quantified in cell lysates via WB. Tau was detected using K9JA (“tau”) and AT8 (p-tau). Measurements were made in at least 3 differentiations (average of 7 differentiations), 2-3 wells per differentiation. (A) Stacked bar graph showing relative levels of each Aβ peptide measured in the media across lines (mean +/− SEM). (B) Aβ42:37 for each individual across differentiations (mean +/− SEM shown). Lines are listed in order of increasing neuritic plaque burden in the brain. C) The mean for each metric was calculated across differentiations and a rank-order correlation coefficient calculated between each in vitro measure and neuritic plaque burden or tau tangle burden in the postmortem brain across 51 ROS/MAP individuals. Asterisks mark those associations with p<0.05. D) Quantification across lines of the level of the major band of ptau relative to tau. Lines are listed in order of increasing tau tangle burden in the brain. E,F) Representative WBs of iN lysates using AT8, K9JA, and GAPDH for iN (E) and brain tissue (F) lysates. Red arrowheads indicate “HMW” tau and red lines indicate “major” bands quantified. G,H) iN and brain tissue lysates from two subjects (BR89, LP-NCI and BR27, AD) were fractionated using size exclusion chromatography and tau levels quantified in each fraction via ELISA (Tau13/HT7). Select fractions also were run on reducing gels and immunoblotted for tau (K9JA). I) P-tau/tau in iNs (x-axis) relative to p-tau/tau in brain tissue (y-axis) quantified by WB (each dot represents data from a single individual). J) Spearman correlations between Aβ and tau measures in iNs. Asterisks mark those associations with p<0.05. K) Graph showing the relationship between Aβ42:37 and tau aggregate score in iNs. Tau aggregate scores were calculated by summation of the z-scores of: tau(HMW)/tau, p-tau(HMW)/tau, and −(p-tau(major)/tau). Red dots=AD; blue dots=HP-NCI; black dots=LP-NCI. See also Figures S6–S8.
Figure 6.
Figure 6.. Significant association between Aβ and tau measurements in neuronal cultures and cognitive trajectory in the same individuals.
(A) Spearman correlation coefficients were calculated between measures of Aβ and tau in the iNs and slope of global cognition over age, global cognition at last visit and MMSE (n=52 individuals). Also shown are the correlations between brain pathology scores and measures of cognition for the same individuals. (B,C) Plots of the mean value for each individual across the three diagnostic categories for Aβ37 (B) and Aβ42 (C) as a percent of all Aβ measured. One-way ANOVA with Tukey’s multiple comparisons test comparing across categories. Data points in red highlight an individual that we discovered had a PSEN1 coding variant (see main text). (D,E) Sequential extractions were performed on postmortem brain (mPFC) of ROS/MAP individuals. Aβ levels were measured in sequential fractions (TBS-soluble, Triton-soluble and GuHCl-soluble) by ELISA. One-way ANOVA with Dunnett’s multiple comparison’s test. F-H) Area under the curve (AUC) was calculated by plotting the receiver operating characteristic curve between NCI (n=36) and AD (n=16) iNs for Aβ42:37 (F), tau aggregate score (G) and Aβ+tau aggregate score (H). Aβ+tau aggregate score was calculated by summing the z-scores of tau aggregate score and Aβ42:37. I,J) Polygenic risk scores (PRS) were calculated for each subject in our iPSC cohort (I) and in the entire ROS/MAP cohort (J) by incorporating all SNPs with p<0.1 association with LOAD. One-way ANOVA with Kruskal-Wallis test. (K) Heat map showing Pearson correlations between iN Aβ42:37 or tau aggregate score and LOAD PRS, calculated using different thresholds of inclusion for SNPs. White asterisks show significant associations (*p=0.026; **p=0.008). Also shown are the absence of associations between Aβ42:37 or tau aggregate score and unrelated diseases: MS=multiple sclerosis; PD=Parkinson’s disease; T2D=type-2 diabetes. (L) Correlation between Aβ42:37 and LOAD PRS with (p=0.008) and without (p=0.009) inclusion of the APOE locus (chr19: 44,000,000-47,000,000). (M) Waterfall blot of the strongest correlations between LOAD PRS and proteomic measurements acquired from iNs. Protein components related to the proteasome, RNA splicing/export, and serine threonine phosphatases are highlighted by colored bars, as indicated. Red asterisks denote those proteins that also were observed in brain tissue to be associated with LOAD PRS (defined by p<0.05). (N) Correlation between PICALM protein levels in iNs and LOAD PRS. For A-J, *p<0.05, **p<0.01, ***p<0.005, ****p<0.001. See also Figure S9.
Figure 7.
Figure 7.. Elevated Aβ42:37 induces a reduction in PP1 which in turn affects tau proteostasis in human neurons.
Waterfall plots of top associations (Pearson correlations, p-values ranging from 0.02-1.6x10⁻⁵) between Aβ42:37 and proteomic measurements acquired from iNs (A) and between brain Aβ42:37 (Triton-soluble fraction) and proteomic measurements acquired from brain tissue of the same individuals (B). Associations highlighted in red and blue were shared between the iNs and brain, a number greater than would be expected by chance (Chi-square test, p=0.0024). (C) GSEA analysis of protein correlations in iNs highlight two brain-derived co-expression modules that are enriched with higher and two with lower Aβ42:37. These same protein modules also are associated with Aβ42:37 in the brain tissue. Rank files were generated using the −log10(pValue)*(r value) to factor both the significance as well as the magnitude and directionality of effect. D) Heat map of all proteins associated with at least 2 of the 3 measures shown (LOAD PRS, Aβ42:37, tau aggregate score). E,F) Protein levels of PPP1CA are significantly lower and PPP1R1A levels higher in AD brain compared to HP-NCI and LP-NCI. One-way ANOVA with Tukey’s multiple comparisons test. G) Correlation between PPP1CA and PPP1R1A protein levels in iNs (as quantified by proteomics) and LOAD PRS. H,I) IPSCs were transduced with lentivirus encoding either wild type APP, APP-NLF, or else with control lentivirus and differentiated to iNs. Aβ was measured in the media and WBs run on lysates to measure PPP1CA levels. Aβ42:37 levels were elevated (H) and PPP1CA levels reduced (I) with APP-NLF expression. Shown are data from three independent differentiations, >11 wells per condition. One-way ANOVA with Tukey’s multiple comparisons test. J,K) iNs were treated with γ-secretase modulators to reduce (PF-06442609; 0.5 μM) or elevate (FeFb, 100 μM) the generation of longer versus shorter Aβ peptides. iNs were treated for 48-72 hours, and media collected for ELISA for Aβ (J) and cell lysates collected and WB performed for PPP1CA (K). Data show mean +/−SEM from six differentiations, 3 iPSC lines (BR15, BR21, BR89); n=20 wells per condition, each line normalized to vehicle. One-way ANOVA with Tukey’s multiple comparisons test. L,M) Treatment of LP-NCI iNs with FeFb induces a reduction in p-tau(major)/tau, and an elevation in p-tau(HMW)/tau. Data show mean +/−SEM from three differentiations, 4 iPSC lines (BR21, BR40, BR60, BR89); n=14 wells per condition, each line normalized to vehicle. Welch’s t-test. N-R) iNs were treated with tautomycin (TauT, 1μM) or vehicle (DMSO) for 24 hrs. Cells were lysed and WBs performed to measure levels of p-tau and total tau. Representative WB of 3 LP-NCI lines (N; see also Figure S11 for AD representative WB). Quantification across LP-NCI iNs (O,P) and AD iNs (Q,R). Data in O-R show mean +/−SEM from 5-7 differentiations, 5 LP-NCI iPSC lines (BR21, BR89, BR04, BR40, BR60), and 5 AD iPSC lines (BR27. BR54, BR14, BR46, BR103), n=18 wells per condition, each line normalized to vehicle. Welch’s t-test. S) AD iNs (BR27, BR46, BR57, BR83, BR92) were treated with 10 μM C2-ceramide for 48 hours, lysed and tau analyzed by WB. Data shows mean +/−SEM, n=21 wells per condition, each line normalized to mean of vehicle treated wells within each differentiation round. Welch’s t-test. For D-S, *p<0.05, **p<0.01, ***p<0.005, ****p<0.001. See also Figure S10, S11. T) Schematic overview outlining cellular phenotypes and hypotheses regarding the cascade of events contributing to AD pathogenesis. Graphic created with BioRender.com.

References

    1. ABUD EM, RAMIREZ RN, MARTINEZ ES, HEALY LM, NGUYEN CHH, NEWMAN SA, YEROMIN AV, SCARFONE VM, MARSH SE, FIMBRES C, CARAWAY CA, FOTE GM, MADANY AM, AGRAWAL A, KAYED R, GYLYS KH, CAHALAN MD, CUMMINGS BJ, ANTEL JP, MORTAZAVI A, CARSON MJ, POON WW & BLURTON-JONES M 2017. iPSC-Derived Human Microglia-like Cells to Study Neurological Diseases. Neuron, 94, 278–293 e9. - PMC - PubMed
    1. AGGARWAL NT, WILSON RS, BECK TL, BIENIAS JL & BENNETT DA 2005. Mild cognitive impairment in different functional domains and incident Alzheimer’s disease. J Neurol Neurosurg Psychiatry, 76, 1479–84. - PMC - PubMed
    1. BARNES LL, NELSON JK & REUTER-LORENZ PA 2001. Object-based attention and object working memory: overlapping processes revealed by selective interference effects in humans. Prog Brain Res, 134, 471–81. - PubMed
    1. BARNES LL, SCHNEIDER JA, BOYLE PA, BIENIAS JL & BENNETT DA 2006. Memory complaints are related to Alzheimer disease pathology in older persons. Neurology, 67, 1581–5. - PMC - PubMed
    1. BENNETT DA, BUCHMAN AS, BOYLE PA, BARNES LL, WILSON RS & SCHNEIDER JA 2018. Religious Orders Study and Rush Memory and Aging Project. J Alzheimers Dis, 64, S161–S189. - PMC - PubMed

Publication types