. 2021 Oct 25;31(20):4571-4583.e4.
doi: 10.1016/j.cub.2021.08.013. Epub 2021 Sep 1.

Rats use memory confidence to guide decisions

Affiliations

Rats use memory confidence to guide decisions

Hannah R Joo et al. Curr Biol. .

Abstract

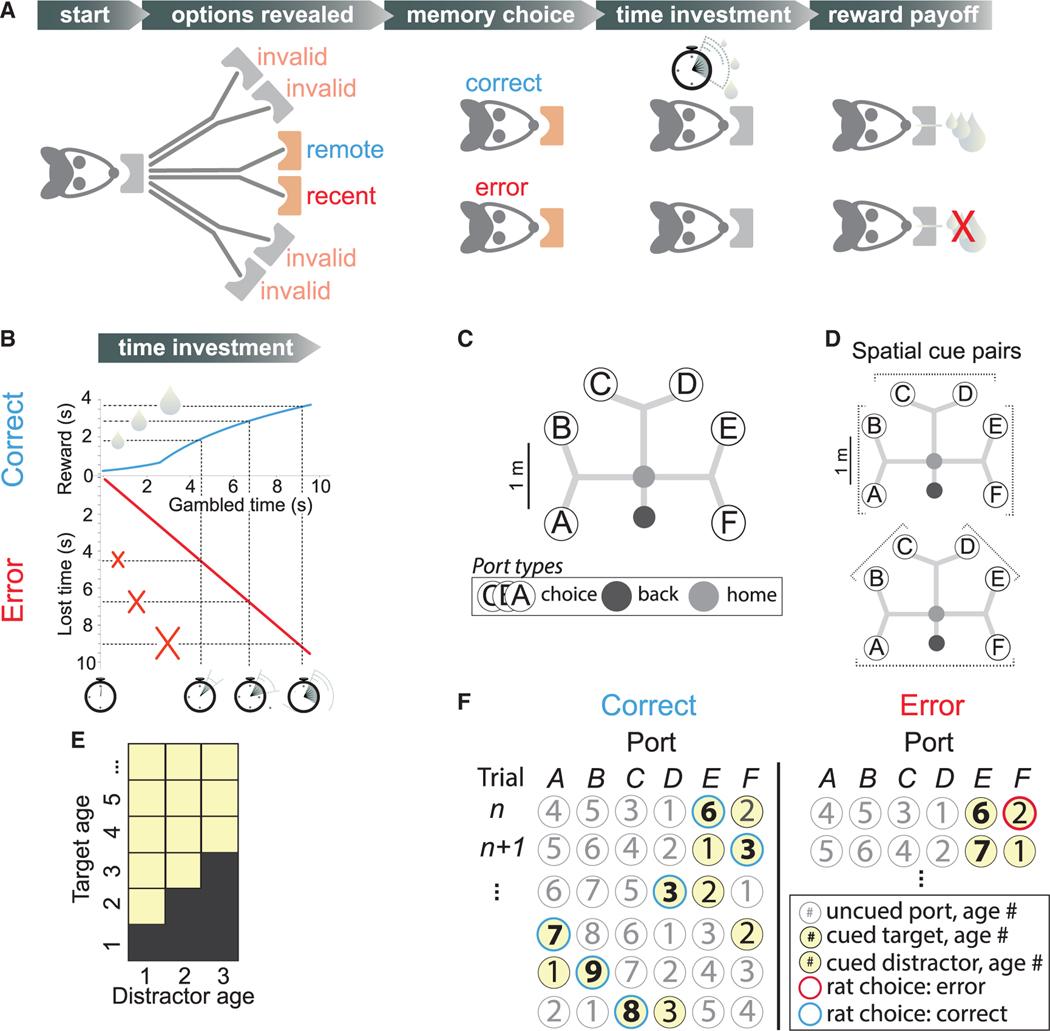
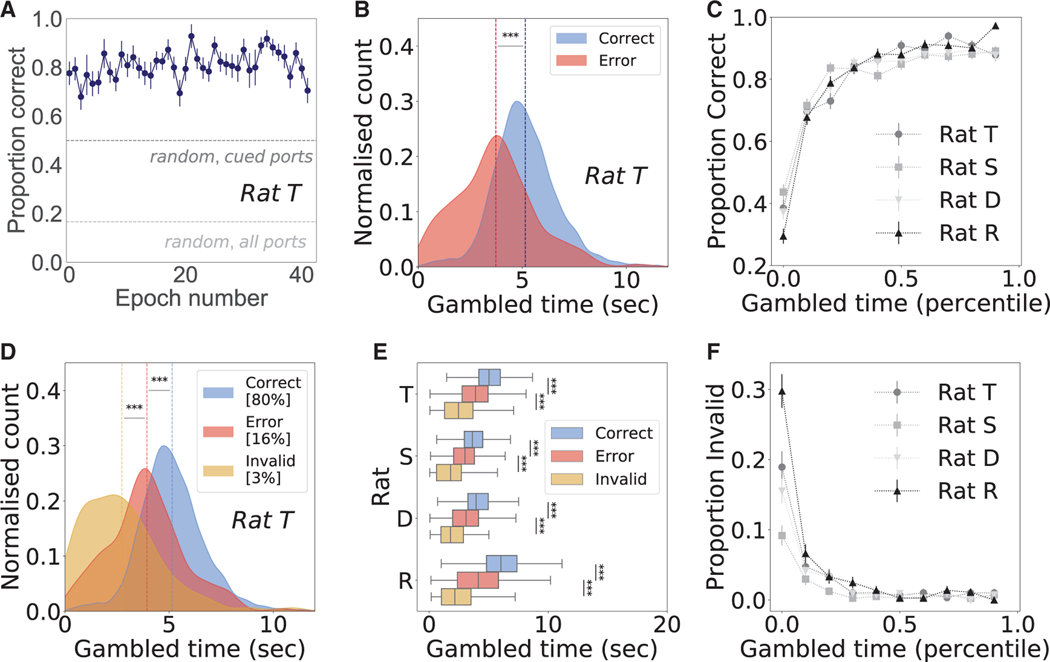
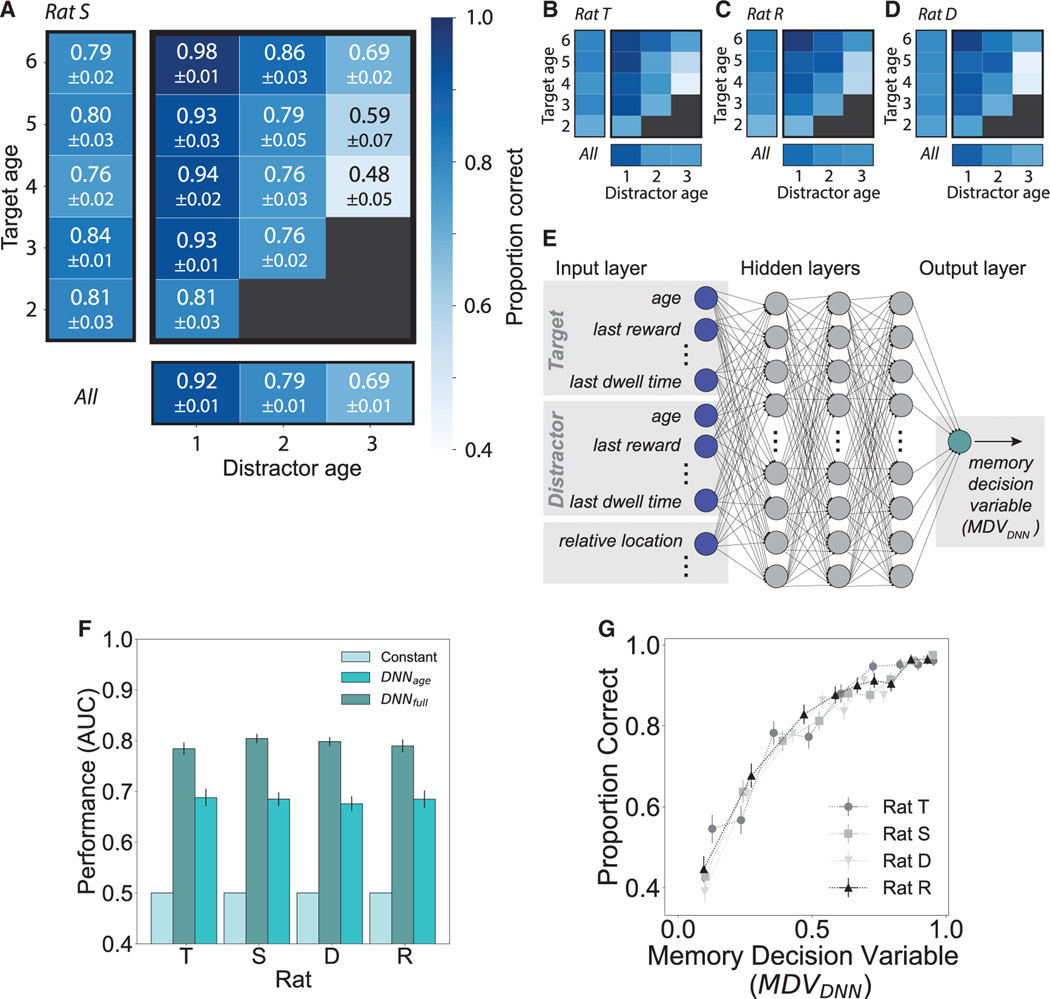
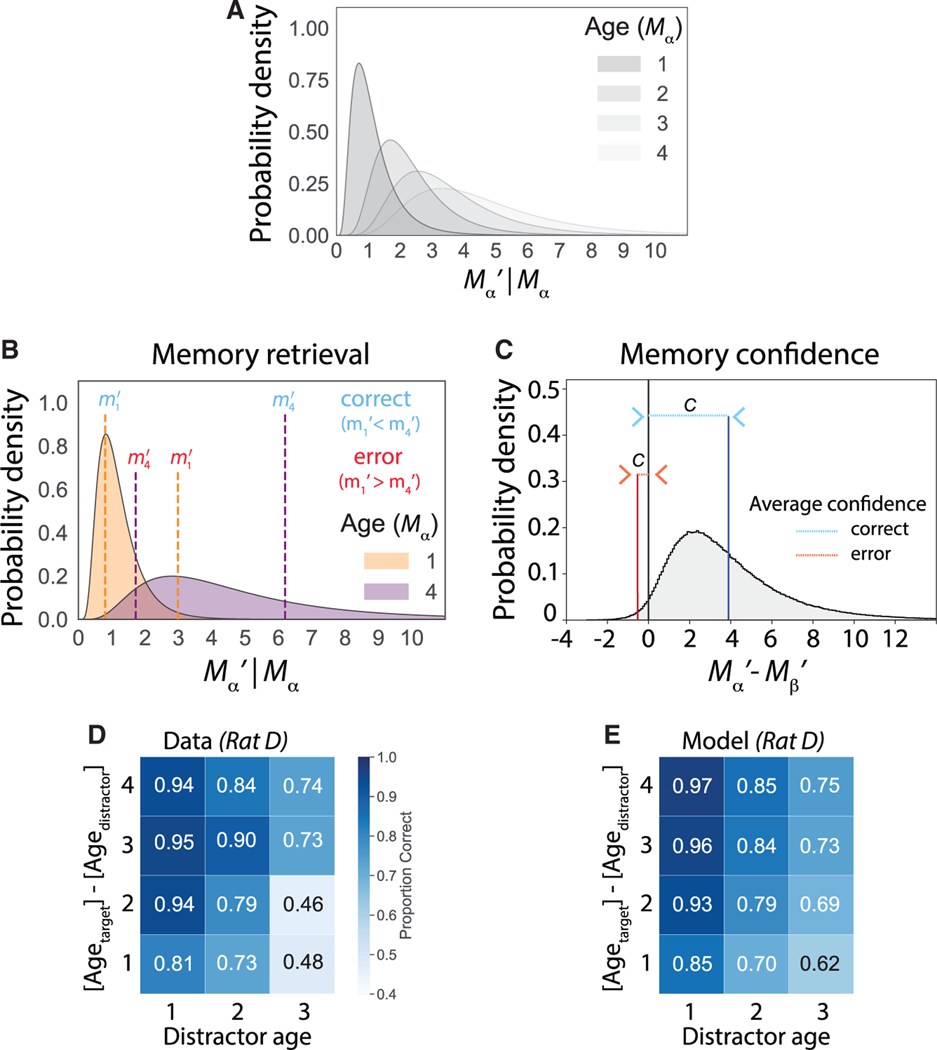
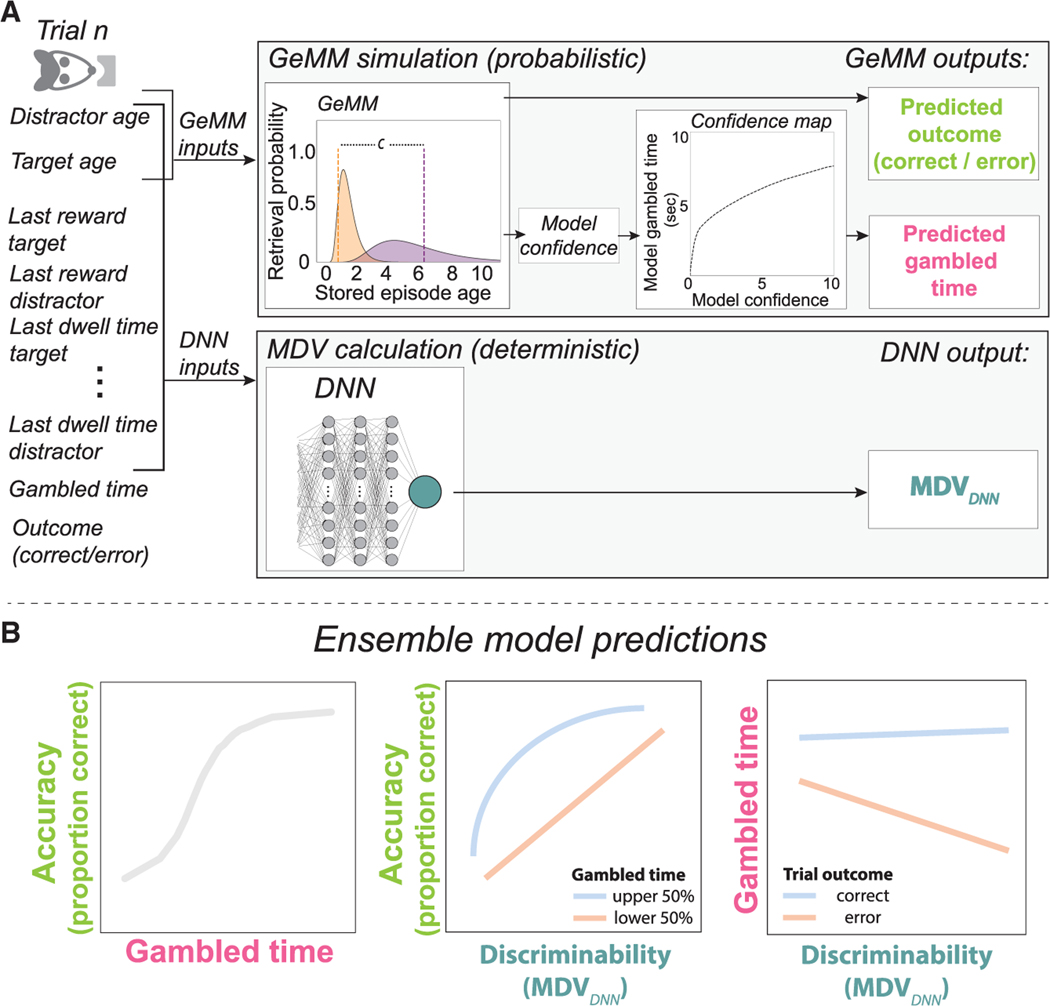
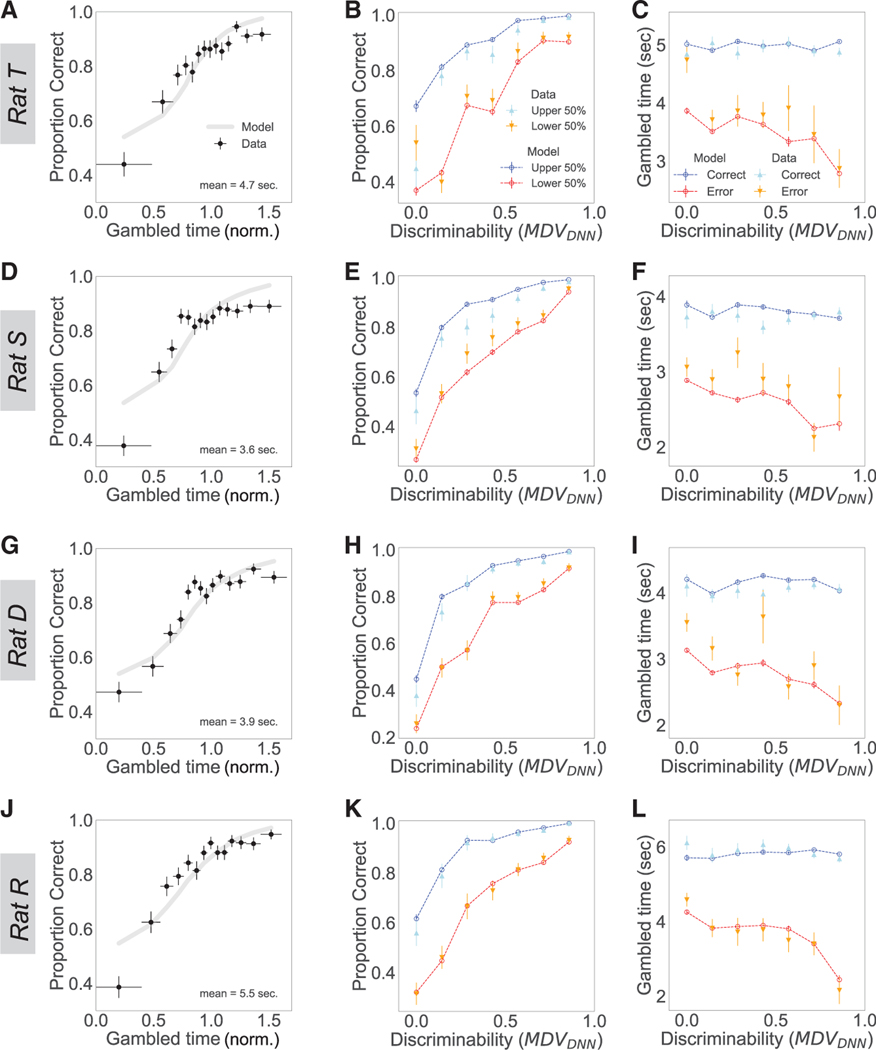
Memory enables access to past experiences to guide future behavior. Humans can determine which memories to trust (high confidence) and which to doubt (low confidence). How memory retrieval, memory confidence, and memory-guided decisions are related, however, is not understood. In particular, how confidence in memories is used in decision making is unknown. We developed a spatial memory task in which rats were incentivized to gamble their time: betting more following a correct choice yielded greater reward. Rat behavior reflected memory confidence, with higher temporal bets following correct choices. We applied machine learning to identify a memory decision variable and built a generative model of memories evolving over time that accurately predicted both choices and confidence reports. Our results reveal in rats an ability thought to exist exclusively in primates and introduce a unified model of memory dynamics, retrieval, choice, and confidence.

Keywords: behavior; confidence; decision making; deep neural network; machine learning; memory; metamemory; rat; spatial memory.


Conflict of interest statement

Declaration of interests The authors declare no competing interests.

Figures

Figure 1.
Figure 1.. Memory task with time gambling
(A) Self-paced trials are initiated by nose poke at a home port. Two choice port options are cued with a light; four are uncued, invalid options that are not correct. One cued port was visited longer ago in the ongoing visit sequence (remote, the target) than the other (recent, the distractor), and is correct. Memory choice is indicated by nose poke at a port. Time investment, rats gamble on the choice outcome by maintaining the nose-poke position for a self-determined interval. Reward payoff depends, for correct trials only, on gambled time. (B) Reward amount (blue) is a function of gambled time and is received at the choice port. On error trials (red), no reward is received. (C) Track geometry showing back (black), home (gray), and choice ports A–F. After leaving choice port, rats receive at back port the same, gamble-dependent reward, completing the trial. Scale bar, 1 m. (D) Cued ports are always adjacent, producing three pairs on the same branch that differ by a stem (top, stem trials: AB; CD; and EF) and three that differ by both branch and stem (bottom, branch trials: BC; DE; and FA) trials. Scale bar, 1 m. (E) Distractor ages 1, 2, and 3, with targets older than given distractor, are allowed (yellow). (F) Example sequence (top to bottom) of cued ports (yellow) and correct (left, blue outlines) or error (right, red outlines) choices for a range of target (bold number) and distractor (number) ages. After each trial, unvisited port ages increment; last-visited port is set to age 1. Note that trials following error could, but did not usually, present again the same ports. See also Figure S1 and Video S1.
Figure 2.
Figure 2.. Gambled time predicts choice accuracy
(A) Choice accuracy is stable per epoch, as shown for representative rat T at 80.9% ± 0.9%, significantly above random choice between all six ports (light gray line, 17%) or the two cued ports (dark gray line, 50%). (B) For representative rat T, average gambled times (dashed vertical lines) were significantly higher for correct (blue) than error choices (red), inclusive over all trials in all epochs (p = 4.8 × 10−69). (C) For each rat, gambled time (10 percentile bins) predicts choice accuracy, measured as proportion correct. For rats T, S, D, R, n trials = 2,978, 4,111, 4,369, and 3,660. (D) For representative rat T, average gambled times (dashed vertical lines) were significantly shorter for invalid choices (yellow) than for errors to the cued port (red; p = 2.5 × 10⁻¹⁰). Invalid choices represented the following percentages of total trials: rat T, 3.3%; rat S, 1.7%; rat D, 2.7%; and rat R, 4.6%. Excluding invalid choices, average gambled time on correct trials (blue dashed line) is still significantly longer than for errors (red dashed line; p = 6.6 × 10−48). (E) For all four rats, gambled times for correct trials were significantly higher than error trials (rat S, p = 4.9 × 10−60; rat D, p = 5.0 × 10−81; rat R, p = 6.5 × 10−118), which were significantly higher than invalid error trials (rat S, p = 2.2 × 10⁻⁹; rat D, p = 5.6 × 10⁻¹⁴; rat R, p = 2.2 × 10⁻¹⁷). (F) Low gambled times (10 percentile bins) predict a higher proportion of invalid trials for all four rats. All error bars represent SEM, and all statistical tests were one-sided rank sum. See also Figures S2–S4.
Figure 3.
Figure 3.. Defining a memory decision variable
(A–D) Choice accuracy depends on target and distractor ages. For rats S, T, R, and D, the proportion of correct trials decreases with distractor age (columns) and, for a given distractor, increases with target age (rows); marginal performance at left and bottom, respectively. Black boxes indicate trial types not permitted by task logic. (A) For rat S, proportion correct and SEM are annotated. Target ages below 6 are shown, with n trials: rat S, 2,720; rat T, 2,008; rat R, 2,499; and rat D, 2,881. Color bar (A) applies to all four rats. (E) A DNN trained by 5-fold cross-validation for each rat takes as input 20 features, a subset of which are depicted in the input layer (left, dark blue). The DNN hasthree hidden layers, each with 32 nodes (gray), and outputs a detection statistic related to the probability a trial will be correct, defined as a memory decision variable (MDVDNN) (green). (F) Performance (receiver operating characteristic, area under the curve [ROC AUC]) of the DNN trained on the full feature set far exceeded that of a constant model using only the overall proportion correct (constant, cyan), as well as that of a model trained on target and distractor ages only (teal). Error bars = SEM. (G) For all four rats, a higher MDVDNN predicts a higher proportion of correct choices. Horizontal and vertical error bars = SEM.
Figure 4.
Figure 4.. The generative memory model (GeMM)
(A) Family of lognormal distributions representing the probability density of recalled episode ages Mα’|Mα = mα as the true age mα increments from 1 to 4 for port α. Uppercase symbols denote random variables (e.g., Mα’ and Mα) while lowercase symbols represent realizations of those random variables (e.g., mα’ and mα). (B) Example trial has target port with age mα = 4 and distractor port with age mβ = 1. A correct (blue) and error (red) realization of the recalled ages for the two ports is shown as vertical dashed lines for the target (purple) and distractor (orange) at values mα’ and mβ’, respectively. (C) The probability density of Mα’ – Mβ’ given Mα and Mβ; the area to the right of 0 is the proportion correct for this target-distractor age pair. Confidence (c) is computed as | mα’ – mβ’ |, and the average confidence is indicated for correct (blue) and error (red) trials. (D) Observed choice accuracy across 12 specifiedtrial types, excluding invalid choices. (E) Model-predicted choice accuracy across 12 specified trial types, excluding invalid choices. Representative rat D is used for all plots. For rat D, the GeMM uses fitted parameters a0 = 1.20, a1 = 0.32, a2 = 0.38, and σ0 = 0.38 for a lognormal distribution with mean a0mα and standard deviation σ0(1 + a1mα + a2mα2):Positive a1 and a2 define distributions with increasing variance with elapsed trials; σ0 << 1 sets a low overlap between neighboring densities, consistent with high observed choice accuracy. See also Figures S5 and S6.
Figure 5.
Figure 5.. Ensemble model
(A) For each trial in data, task features (left) include the 20 features used to calculate the MDVDNN, gambled time, and trial outcome. A subset of these, the distractor age and target age, are input to the fitted GeMM (top panel) to simulate two GeMM outputs: a predicted trial outcome (correct or error; lime) and a predicted confidence value, which is converted by a monotonic mapping function, shown for representative rat T, to predicted gambled time (pink). The process is repeated n = 10 times per trial in data to produce a distribution of model-simulated gambled times per observed gambled time, all with the same MDVDNN (bottom panel). The MDVDNN is calculated from the 20 input features to the trained DNN (green). (B) The ensemble model makes three signature predictions of memory confidence based on accuracy (lime), gambled time (pink), and the MDVDNN (green), as a memory discriminability axis, to which trends in data can be compared (here, representative schematics). Middle: blue represents upper half of gambled times, and red represents lower half of gambled times. Right: blue represents correct trials, and red represents error trials.
Figure 6.
Figure 6.. The GeMM predicts trends in memory discriminability, choice, and gambled times in data
Each plot shows GeMM predictions (lines) with data (points) overlaid. (A, D, G, and J) GeMM-predicted calibration curves (gray lines) for accuracy as a function of mean-normalized gambled time compared to data (black points), for the lowest 14 of n = 15 percentile bins. Horizontal bars represent bin widths. (B, E, H, and K) Conditioned psychometric curve predicted by the GeMM shows proportion correct for upper half (dark blue) versus lower half (red) of gambled times compared to proportion correct in upper half (light blue) versus lower half (orange) in data, each in n = 7 percentile bins. (C, F, I, and L) Vevaiometric curve depicts gambled times predicted by the GeMM for correct (dark blue) and error (red) trials compared to correct (light blue) and error (orange) in data, each in n = 7 percentile bins. Vertical error bars represent SEM for all plots.

Comment in

Similar articles

Cited by

References

    1. Grimaldi P, Lau H, and Basso MA (2015). There are things that we know that we know, and there are things that we do not know we do not know: confidence in decision-making. Neurosci. Biobehav. Rev 55, 88–97. - PMC - PubMed
    1. Pouget A, Drugowitsch J, and Kepecs A. (2016). Confidence and certainty: distinct probabilistic quantities for different goals. Nat. Neurosci 19, 366–374. - PMC - PubMed
    1. Bach DR, and Dolan RJ (2012). Knowing how much you don’t know: a neural organization of uncertainty estimates. Nat. Rev. Neurosci 13, 572–586. - PubMed
    1. Meyniel F, Sigman M, and Mainen ZF (2015). Confidence as Bayesian probability: from neural origins to behavior. Neuron 88, 78–92. - PubMed
    1. Pouget A, Beck JM, Ma WJ, and Latham PE (2013). Probabilistic brains: knowns and unknowns. Nat. Neurosci 16, 1170–1178. - PMC - PubMed

Publication types