. 2021 Nov 2;33(11):2277-2287.e5.
doi: 10.1016/j.cmet.2021.08.004. Epub 2021 Sep 1.

IL-33 causes thermogenic failure in aging by expanding dysfunctional adipose ILC2

Affiliations

IL-33 causes thermogenic failure in aging by expanding dysfunctional adipose ILC2

Emily L Goldberg et al. Cell Metab. .

Abstract

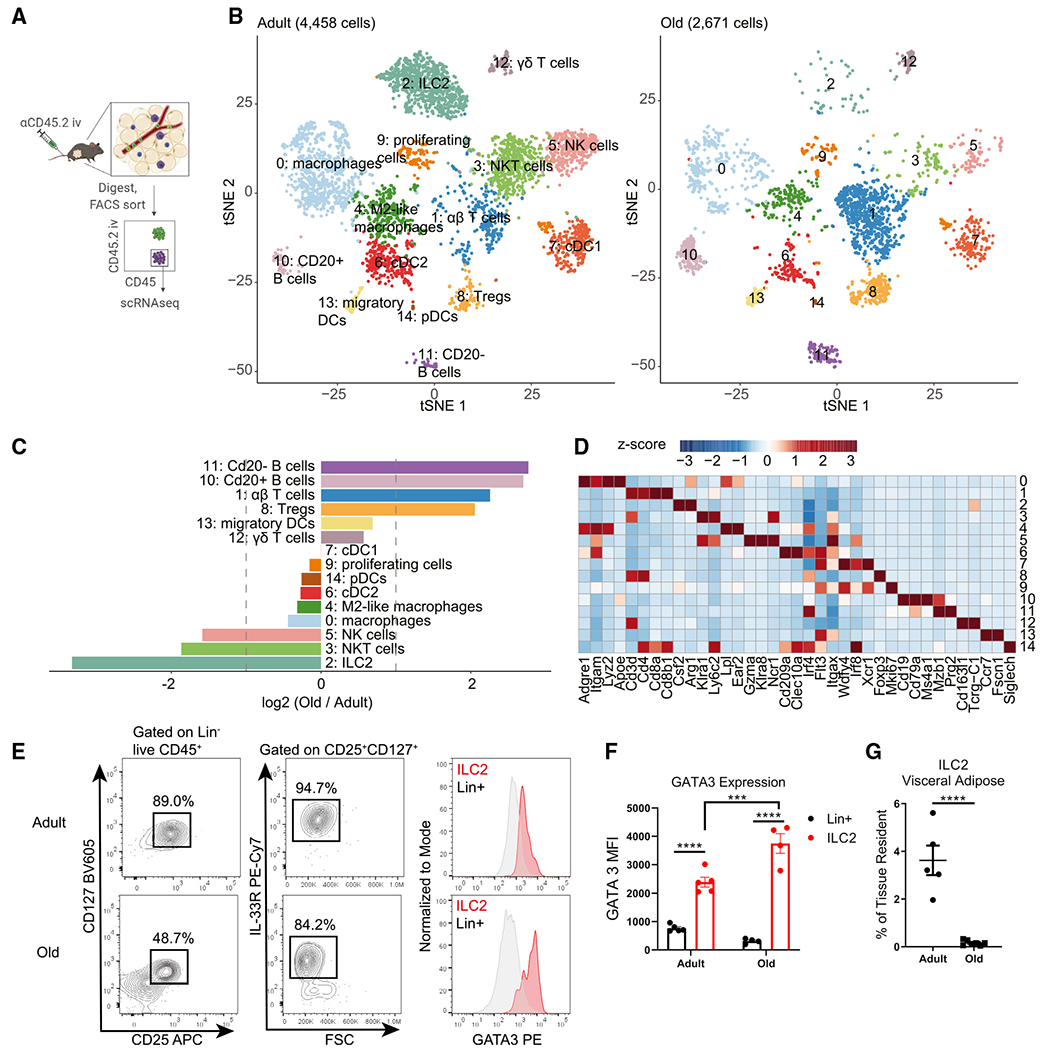
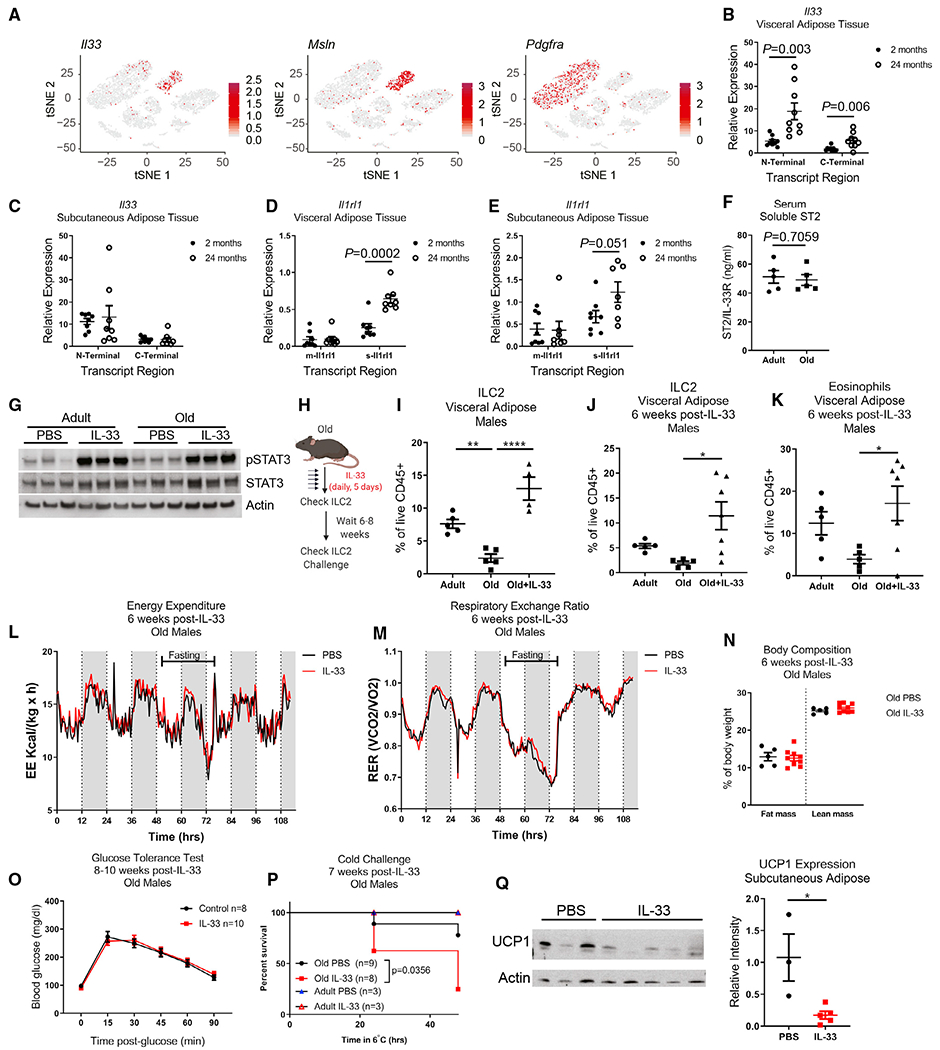
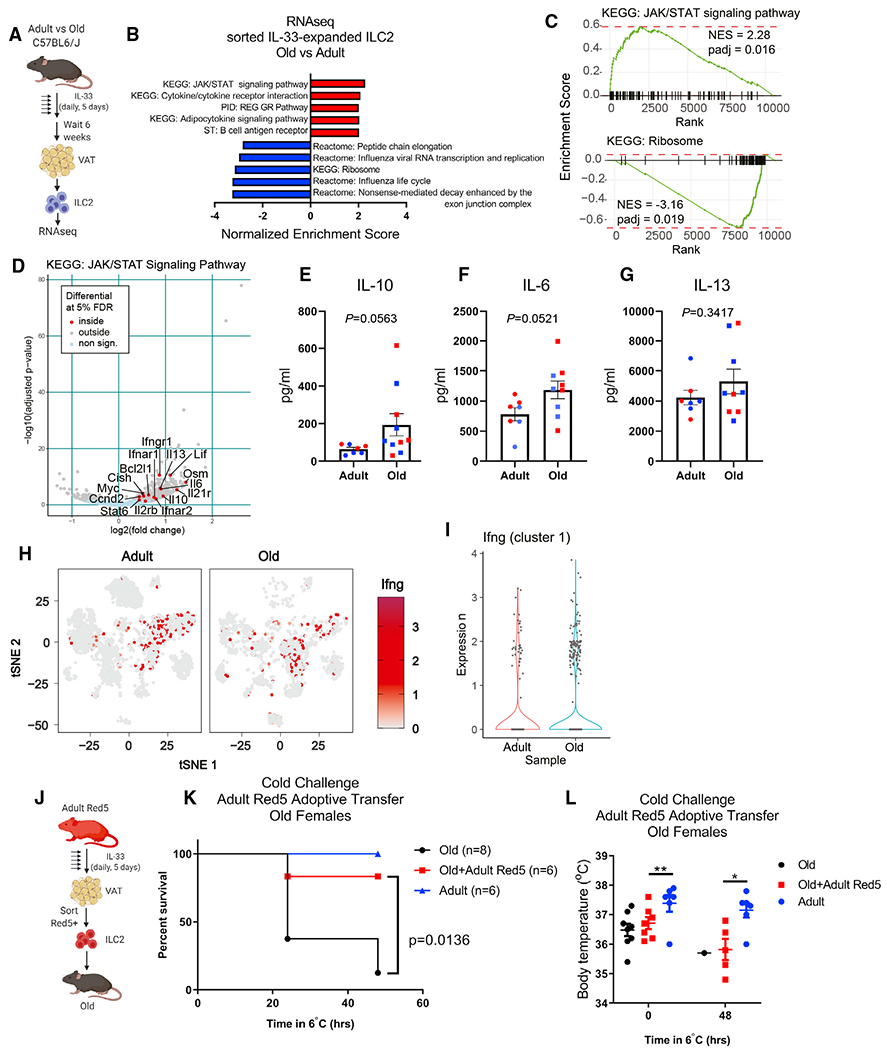
Aging impairs the integrated immunometabolic responses, which have evolved to maintain core body temperature in homeotherms to survive cold stress, infections, and dietary restriction. Adipose tissue inflammation regulates the thermogenic stress response, but how adipose tissue-resident cells instigate thermogenic failure in the aged are unknown. Here, we define alterations in the adipose-resident immune system and identify that type 2 innate lymphoid cells (ILC2s) are lost in aging. Restoration of ILC2 numbers in aged mice to levels seen in adults through IL-33 supplementation failed to rescue old mice from metabolic impairment and increased cold-induced lethality. Transcriptomic analyses revealed intrinsic defects in aged ILC2, and adoptive transfer of adult ILC2s are sufficient to protect old mice against cold. Thus, the functional defects in adipose ILC2s during aging drive thermogenic failure.

Keywords: IL-33; ILC2; adipose; aging; inflammation; metabolism; thermogenesis.


Conflict of interest statement

Declaration of interests The authors declare no competing interests.

Figures

Figure 1.
Figure 1.. The adipose-resident immune compartment changes during aging
(A) Schematic depicting experimental strategy to define the adipose-resident immune compartment. (B) tSNE plots of tissue-resident CD45+ cells from adult (left) and old (right) male visceral adipose tissue. (C) Bar chart showing population fold changes in relative abundance of each cluster induced by aging. (D) Heatmap showing main lineage-defining genes to identify each cluster. For (B–D), data were generated from pooling n = 4 adult and n = 3 old male mice, so that a total of 1 g of adipose tissue was used to isolate cells for each sample. (E) Representative flow cytometry analysis of visceral adipose tissue ILC2 gating. (F) Quantitation of GATA3 expression in adult and old ILC2s (red) versus Lin+ cells (gray). Statistical differences were calculated by two-way ANOVA. E.rror bars are SEM. (G) Quantification of ILC2 abundance in visceral adipose tissue in adult and old mice. Statistical difference was calculated by unpaired t test. Error bars are SEM. (E–G) Data are from a single experiment but representative of at least three independently repeated experiments.
Figure 2.
Figure 2.. Loss of ILC2s during aging is sex independent
(A) Representative gating scheme defining tissue residence within indicated visceral adipose immune populations. (B) The percentage of ILC2s that are tissue resident (iv-label negative) in males and females across lifespan. Error bars are SEM. (C and D) The percentage of tissue-resident CD45+ cells that are (C) ILC2s and (D) eosinophils in aging male and female mice. Trend line is best-fit lines for males and females, separately. For (A–D), data are representative of 5 independent experiments; n = 5/group and each symbol represents an individual mouse. (E and F)The percentage of adipose immune cells that are (E) ILC2s or (F) eosinophils in 15-month-old calorie-restricted (CR) male mice (n = 7) compared with adult (n = 5) and ad libitum age-matched control male mice (n = 5). Left panels report frequencies, and right panels report absolute numbers normalized to tissue weight. (G) Abundance of ILC2s in visceral adipose tissue from adult, old, and age-matched old Nlrp3−/− male mice. All groups were fed ad libitum. For(E–G), each symbol represents an individual mouse and are representative of two independent experiments. Statistical differences were calculated by one-way ANOVA with Tukey’s correction for multiple comparisons. Error bars are SEM.
Figure 3.
Figure 3.. Aged ILC2s are IL-33-responsive but not metabolically protective
(A) tSNE plots of scRNA-seq analysis of total SVF of visceral adipose tissue obtained from a pooled sample of n = 4 old female mice. Expression of Il33, Msln, and Pdgfra, are overlaid individually in red. (B and C) Il33 gene expression was measured by qPCR in (B) visceral adipose tissue and (C) subcutaneous inguinal adipose tissue of adult and old mice. Primers were designed to measure relative expression of both N-terminal and C-terminal regions of Il33. Data are pooled from two independent experiments in female mice, for a total of n = 9 mice/group for visceral adipose and n = 8 mice/group for subcutaneous adipose samples. Each dot represents an individual mouse. Statistical differences between adult versus old mice were calculated by unpaired t test for each transcript region analyzed. (D and E) Il1rl1 gene expression was measured in (D) visceral adipose tissue and (E) subcutaneous inguinal adipose tissue of adult and old mice. Primers were designed to discriminate between the membrane-bound (m-Il1rl1) and soluble (s-Il1rl1) transcript variants. Data are pooled from two independent experiments in female mice, for a total of n = 9 mice/group for visceral adipose and n = 8 mice/group for subcutaneous adipose samples. Each dot represents an individual mouse. Statistical differences between adult versus old mice were calculated by unpaired t test for each transcript region analyzed. (F) Soluble IL33R (ST2) was measured in serum by ELISA. Statistical p value was calculated by unpaired t test. (G) Western blots of whole visceral adipose tissue lysate from adult and old female mice treated with IL-33 or PBS. Each lane represents an individual mouse, and data are representative of two independent experiments. (H) Schematic depicting experimental design. IL-33 was given by i.p. injection daily for 5 consecutive days. (I) ILC2 abundance in visceral adipose tissue 2 days after completing IL-33 treatments. (J) ILC2s in visceral adipose tissue 6 weeks after completion of IL-33 treatment. Data are representative of 5 independent experiments, assessed through a range of 6–10 weeks after completing IL-33 treatments. Statistical differences were calculated by one-way ANOVA with Tukey’s correction for multiple comparisons. (K) Eosinophils in visceral adipose tissue 6 weeks after completion of IL-33 treatment. Data are representative of 5 independent experiments, assessed through a range of 6–10 weeks after completing IL-33 treatments. Statistical differences were calculated by one-way ANOVA with Tukey’s correction for multiple comparisons. (L and M) (L) Energy expenditure and (M) RER in the fed and fasting state, measured 6 weeks after IL-33 treatment in old male mice. Data are representative of two independent cohorts. (N) Body composition in old male mice 6 weeks after IL-33 treatment. Data are representative of 2 independent experiments. (O) Glucose tolerance test in old male mice 8–10 weeks after IL-33 treatment. Data are pooled from two independent experiments. (P) Survival of male mice subjected to cold challenge at 7 weeks post-IL-33 treatment. Survival of old mice are pooled from 2 independent experiments and were analyzed by log-rank test. Adult mice were only included in one of these independent experiments. (Q) Protein expression of UCP1 in subcutaneous (inguinal) adipose tissue was measured by western blot in adult mice that survived 48 h cold challenge. Data are representative of two independent experiments. Western blot was quantified by normalizing UCP1 band intensities to Actin bands in their respective lanes. Statistical difference was calculated by non-parametric t test. (B–F, I–K, N, O, and Q) Error bars are SEM.
Figure 4.
Figure 4.. Intrinsic defects in aged ILC2s predispose to cold intolerance
(A) ILC2 bulk RNA-seq experimental design. IL-33 was given by i.p. injection daily for 5 consecutive days and mice were rested for 6 additional weeks prior to tissue collection and ILC2 isolation. (B) Gene set enrichment analysis of IL-33-expanded ILC2s from adult and old mice. n = 3 adult and n = 3 old samples, each containing sorted ILC2s pooled from n = 2 biological replicate male mice were used for bulk RNA-seq analyses. (C) GSEA curves of significantly regulated pathways identified in (B). (D) Volcano plot highlighting significantly regulated genes from the KEGG JAK/STAT signaling pathway gene list. (E–G) (E) IL-10, (F) IL-6, and (G) IL-13 cytokine secretion was measured from sorted adult and old adipose tissue ILC2s after IL-33-mediated expansion in vivo. Each symbol represents an individual mouse, and both age groups are pooled from male (blue) and female (red) mice. All mice were treated with IL-33 simultaneously, ILC2s were sorted from n = 1–2 mice/group and stimulated across 4 separate days, and all supernatants were analyzed together. Statistical differences were calculated by t test. Error bars are SEM. (H) Ifng expression is depicted in red and overlaid across all tissue-resident CD45+ cell subsets in gray. (I) Violin plots of Ifng expression within cluster 1 αβ T cells. (J) Adoptive transfer experimental design. Red5 mice were treated with IL-33 by i.p. injection daily for 5 consecutive days. (K) Survival of old female mice that survived 48 h cold challenge ± receiving adult female Red5+ cells. Date are pooled from two independent experiments. Statistical differences were analyzed by log-rank test. (L) Body temperatures of old female mice that survived 48 h cold challenge ± receiving adult female Red5+ cells. Data are pooled from 2 independent experiments. Statistical differences in body temperature were calculated by two-way ANOVA. Error bars are SEM.

Comment in

References

    1. Anders S, Pyl PT, and Huber W (2015). HTSeq-a Python framework to work with high-throughput sequencing data. Bioinformatics 31, 166–169. - PMC - PubMed
    1. Anderson KG, Mayer-Barber K, Sung H, Beura L, James BR, Taylor JJ, Qunaj L, Griffith TS, Vezys V, Barber DL, and Masopust D (2014). Intravascular staining for discrimination of vascular and tissue leukocytes. Nat. Protoc 9, 209–222. - PMC - PubMed
    1. Bapat SP, Myoung Suh J, Fang S, Liu S, Zhang Y, Cheng A, Zhou C, Liang Y, LeBlanc M, Liddle C, et al. (2015). Depletion of fat-resident Treg cells prevents age-associated insulin resistance. Nature 528, 137–141. - PMC - PubMed
    1. Benayoun BA, Pollina EA, Singh PP, Mahmoudi S, Harel I, Casey KM, Dulken BW, Kundaje A, and Brunet A (2019). Remodeling of epigenome and transcriptome landscapes with aging in mice reveals widespread induction of inflammatory responses. Genome Res. 29, 697–709. - PMC - PubMed
    1. Beretta E, Dhillon H, Kalra PS, and Kalra SP (2002). Central LIF gene therapy suppresses food intake, body weight, serum leptin and insulin for extended periods. Peptides 23, 975–984. - PubMed

Publication types