. 2021 Oct 19;144(16):1308-1322.
doi: 10.1161/CIRCULATIONAHA.121.054071. Epub 2021 Sep 3.

Role of Venous Endothelial Cells in Developmental and Pathologic Angiogenesis

Affiliations

Role of Venous Endothelial Cells in Developmental and Pathologic Angiogenesis

Heon-Woo Lee et al. Circulation. .

Abstract

Background: Angiogenesis is a dynamic process that involves expansion of a preexisting vascular network that can occur in a number of physiological and pathological settings. Despite its importance, the origin of the new angiogenic vasculature is poorly defined. In particular, the primary subtype of endothelial cells (capillary, venous, arterial) driving this process remains undefined.

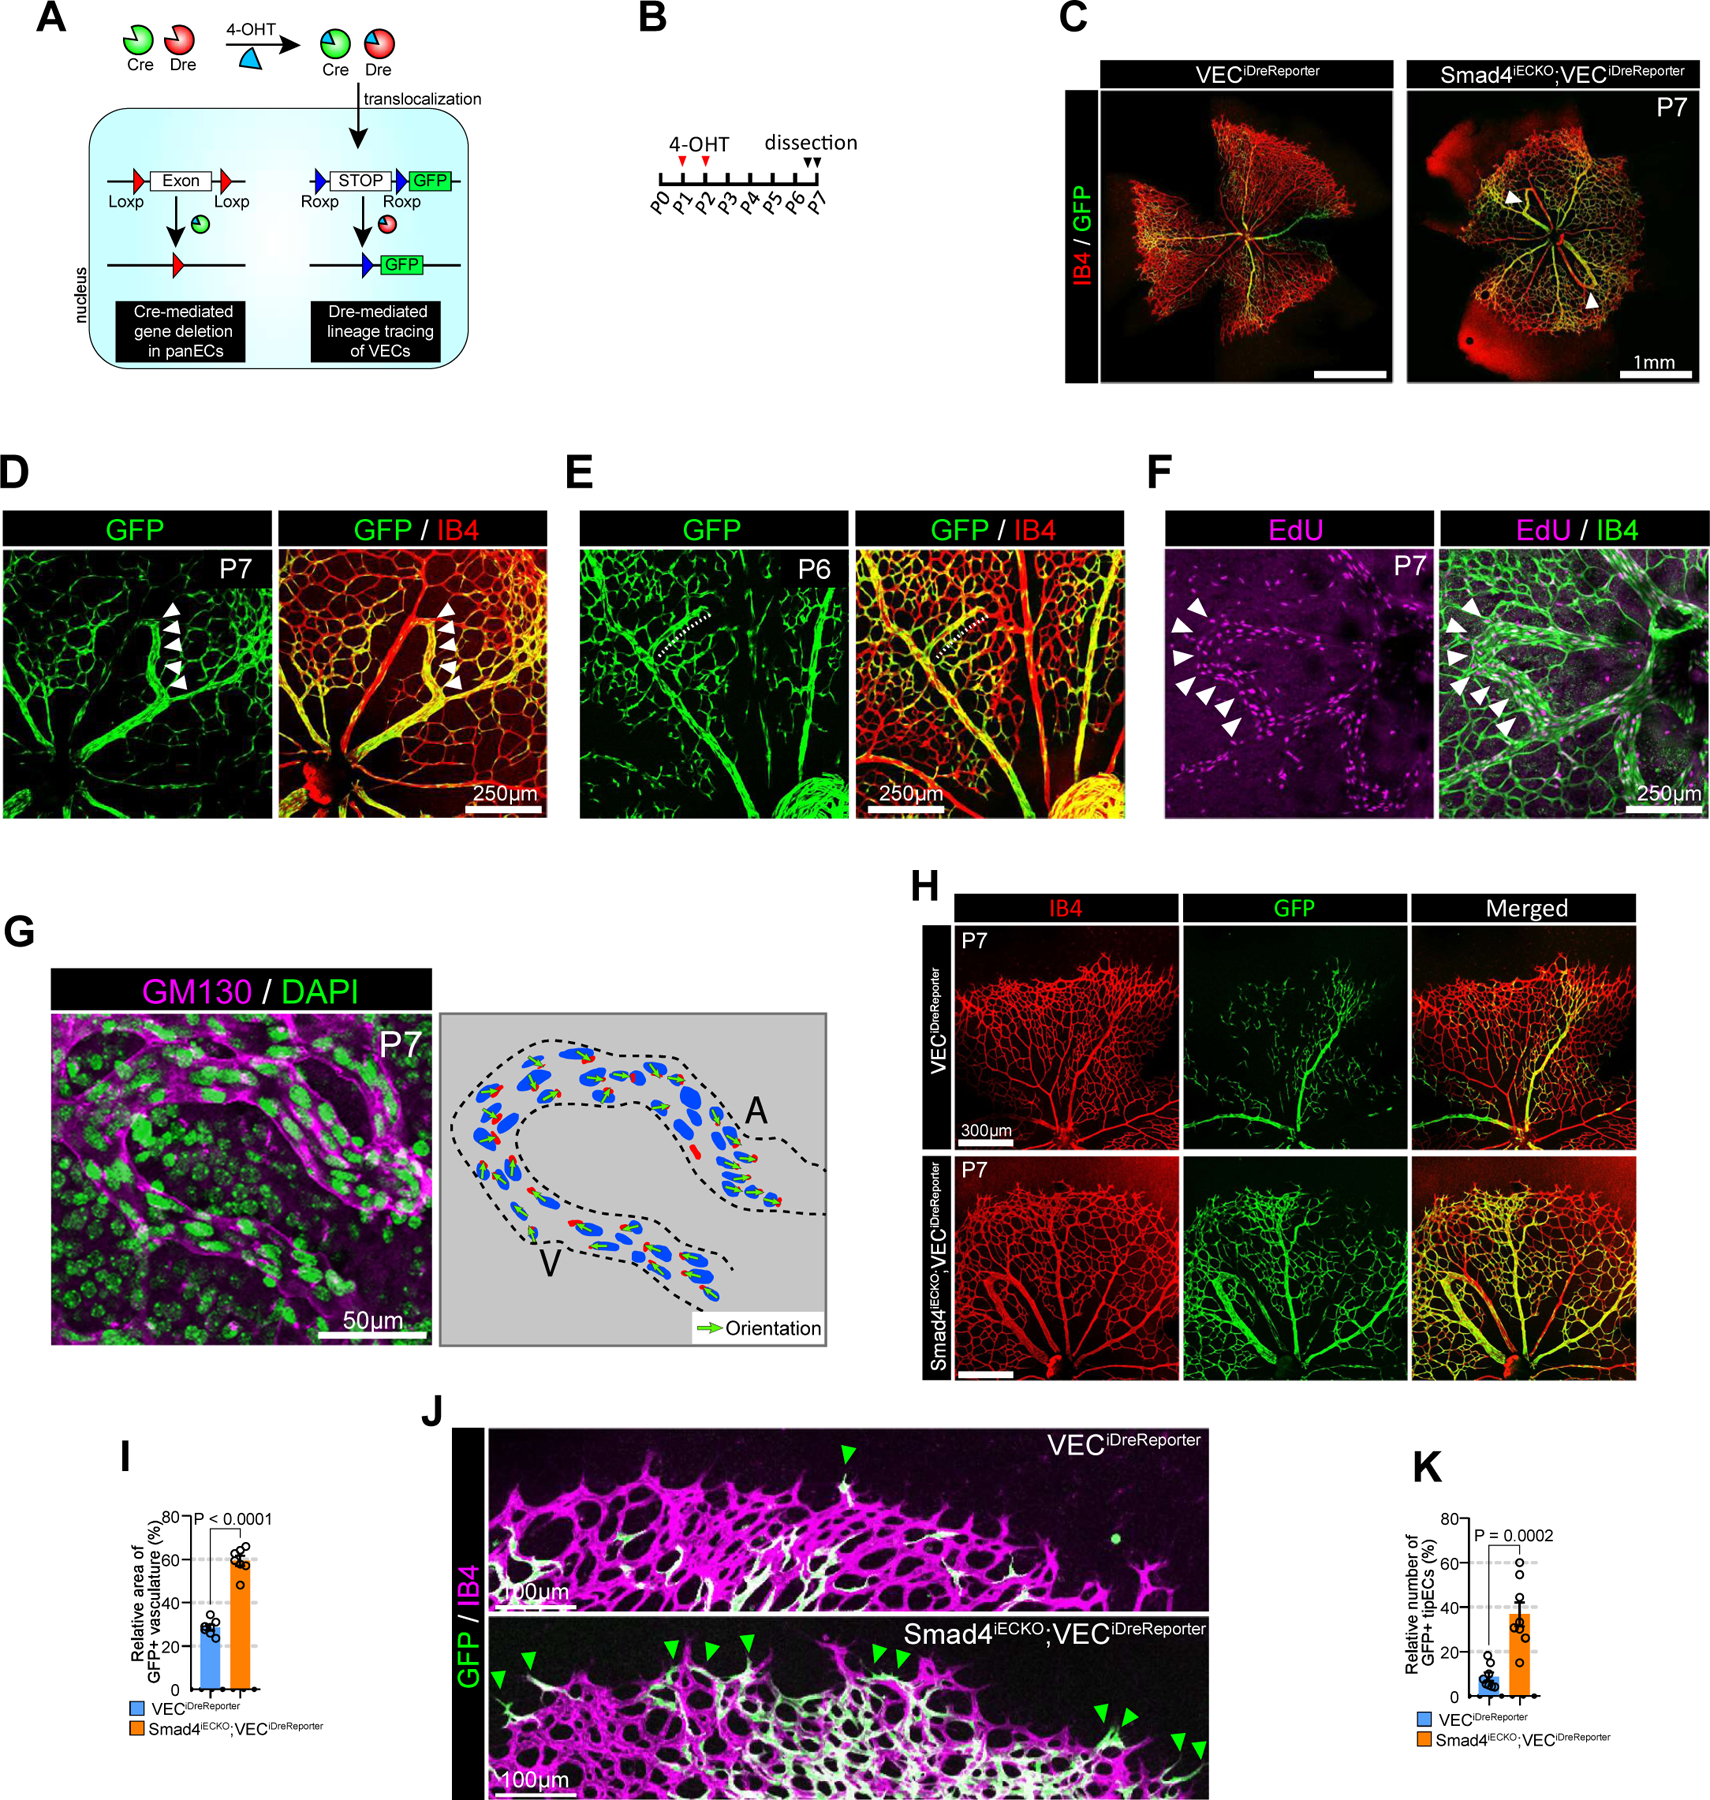
Methods: Endothelial cells were fate-mapped with the use of genetic markers specific to arterial and capillary cells. In addition, we identified a novel venous endothelial marker gene (Gm5127) and used it to generate inducible venous endothelium-specific Cre and Dre driver mouse lines. Contributions of these various types of endothelial cells to angiogenesis were examined during normal postnatal development and in disease-specific setting.

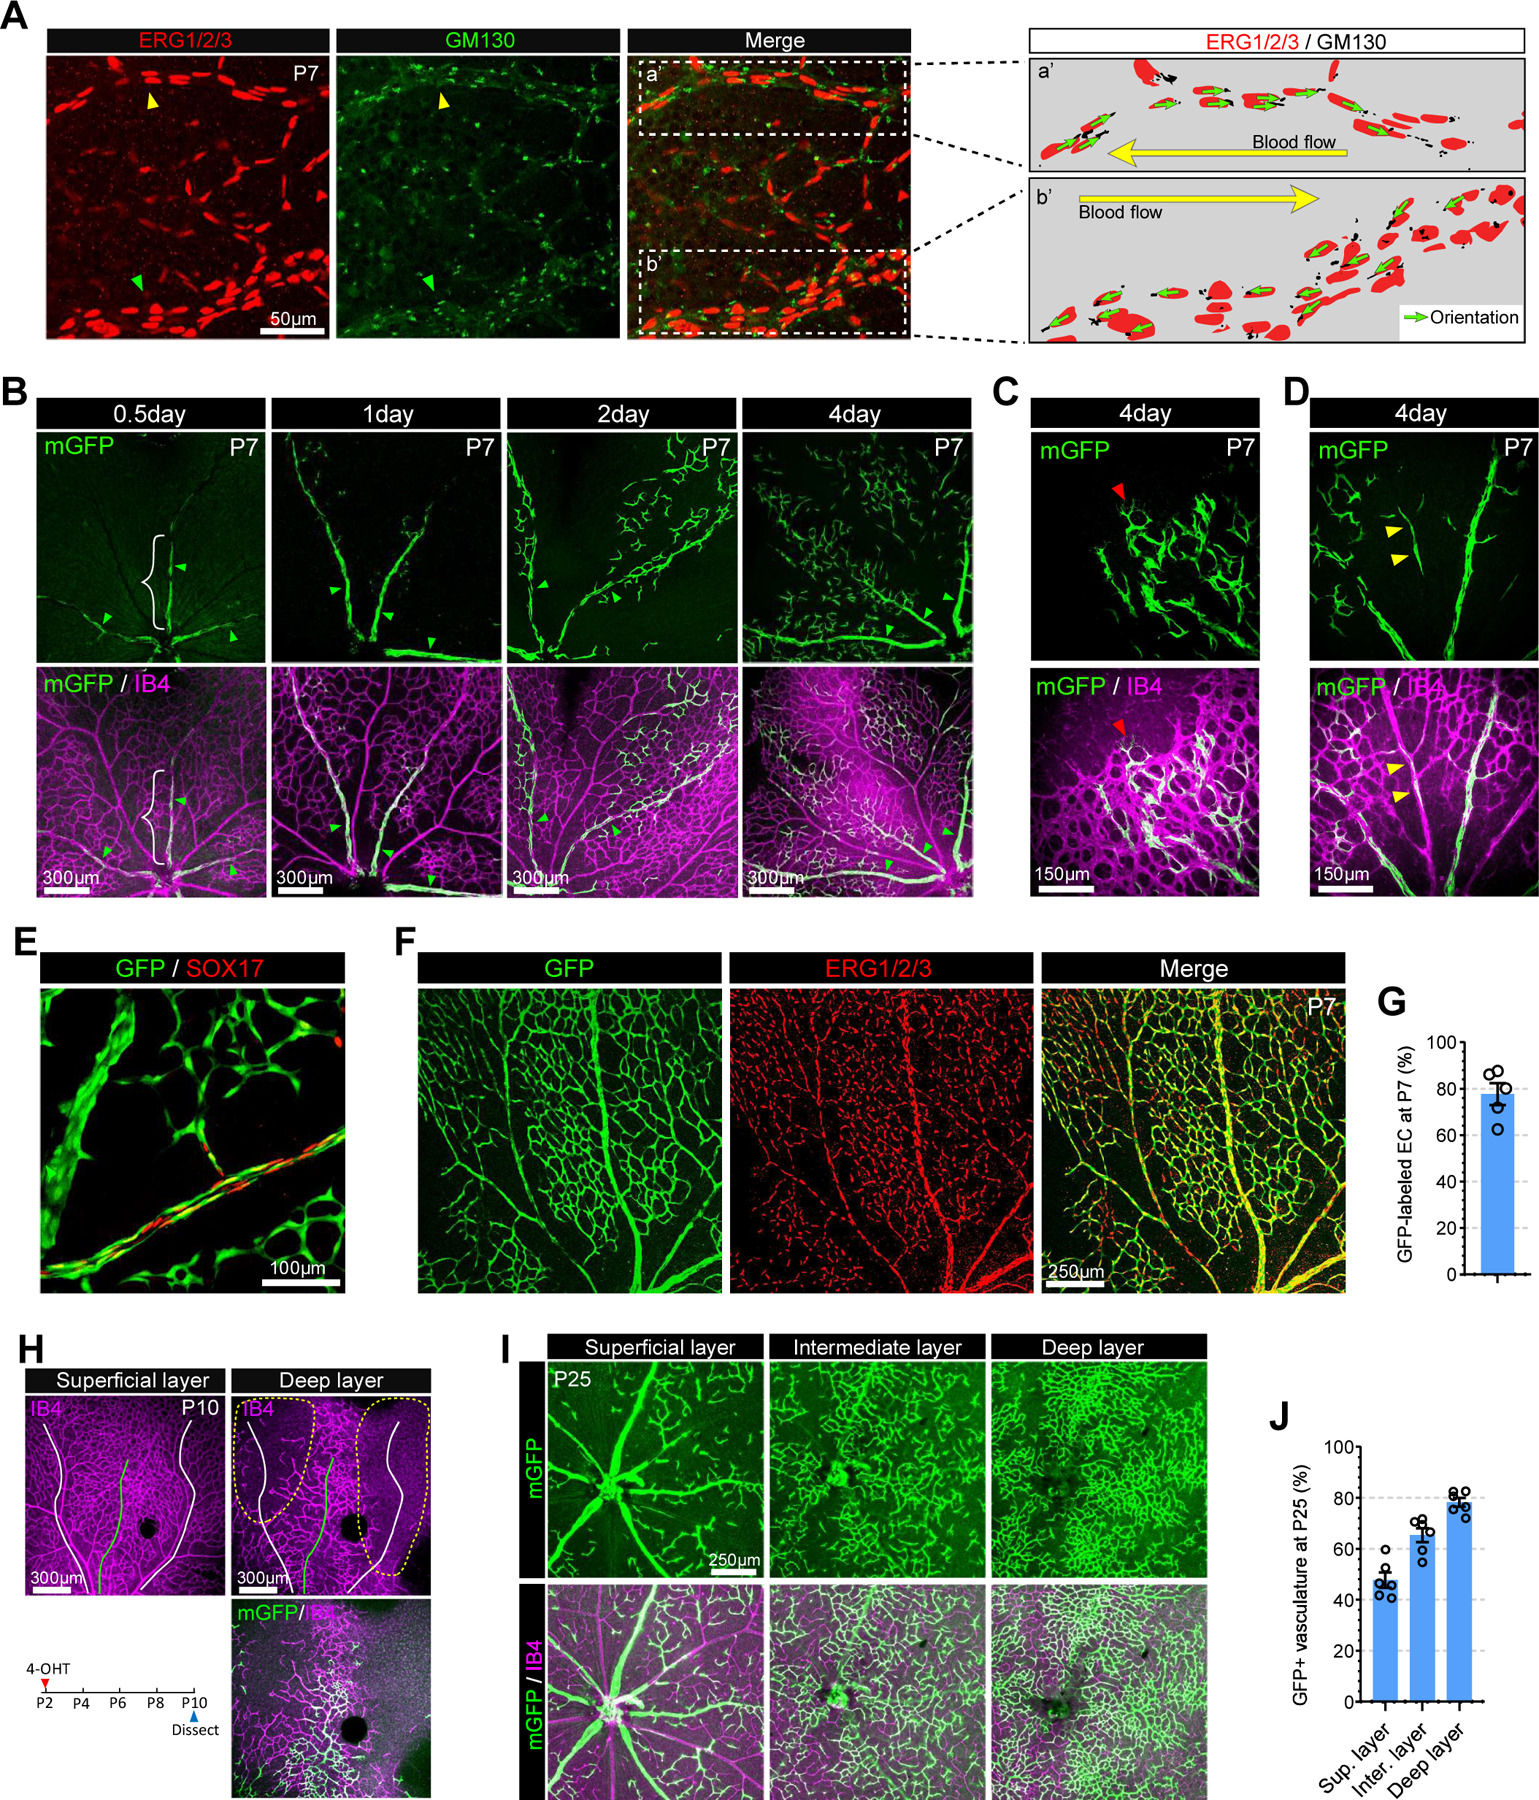
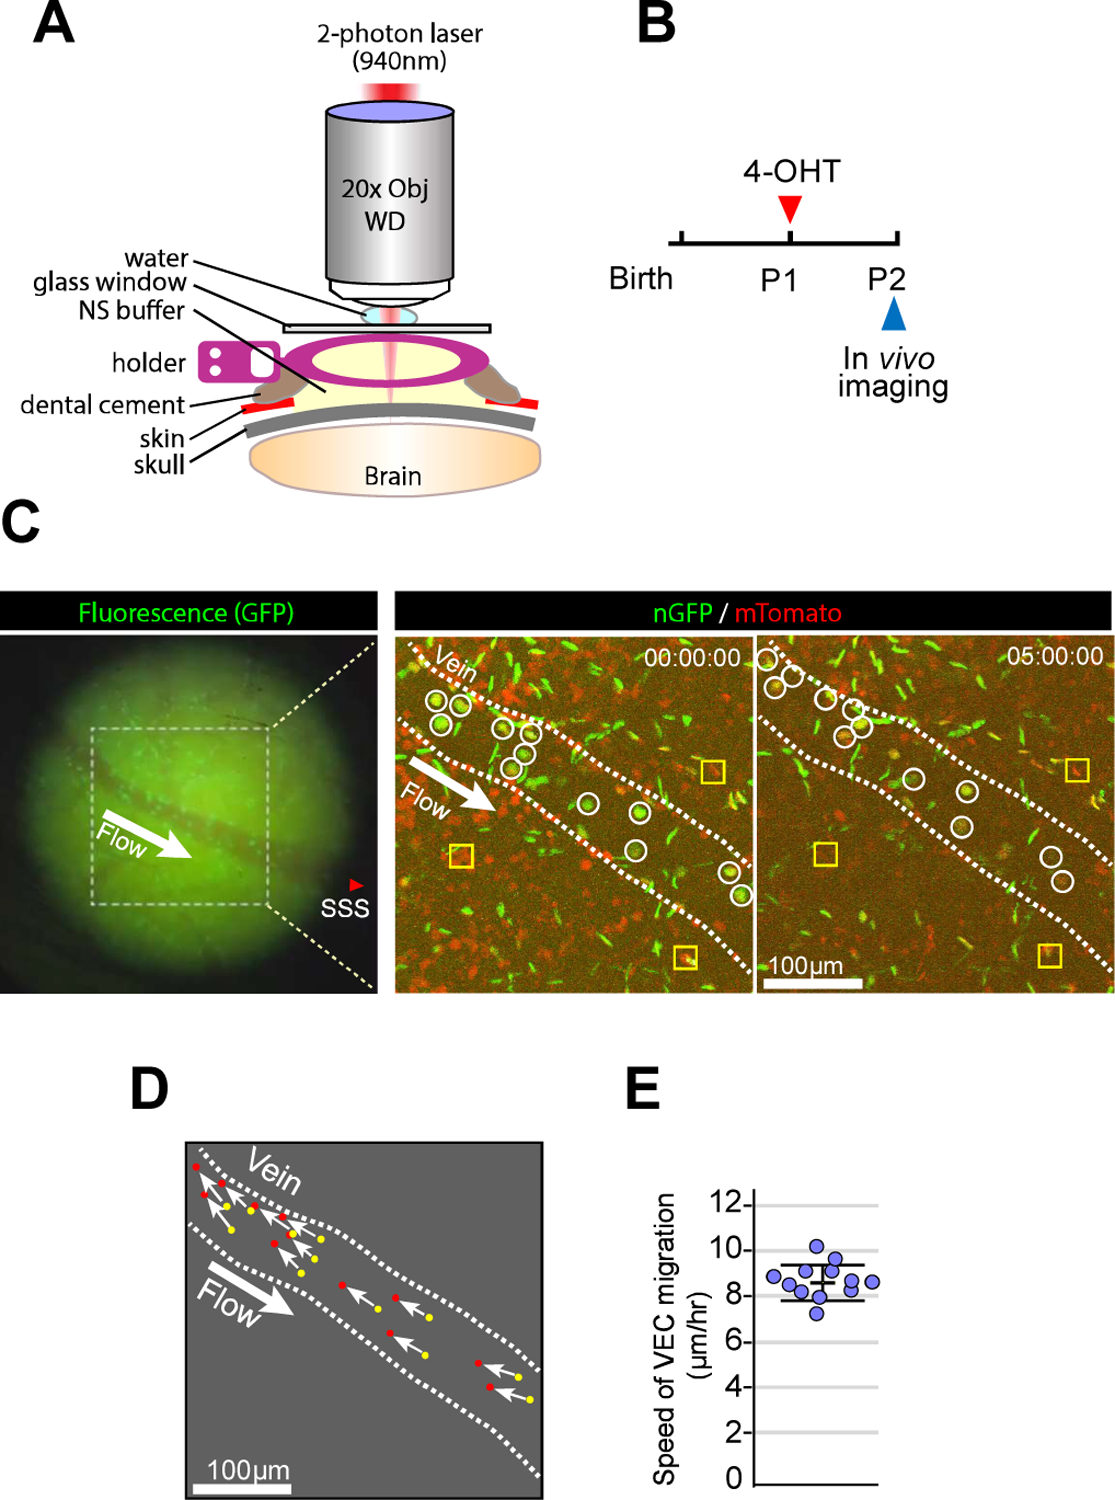
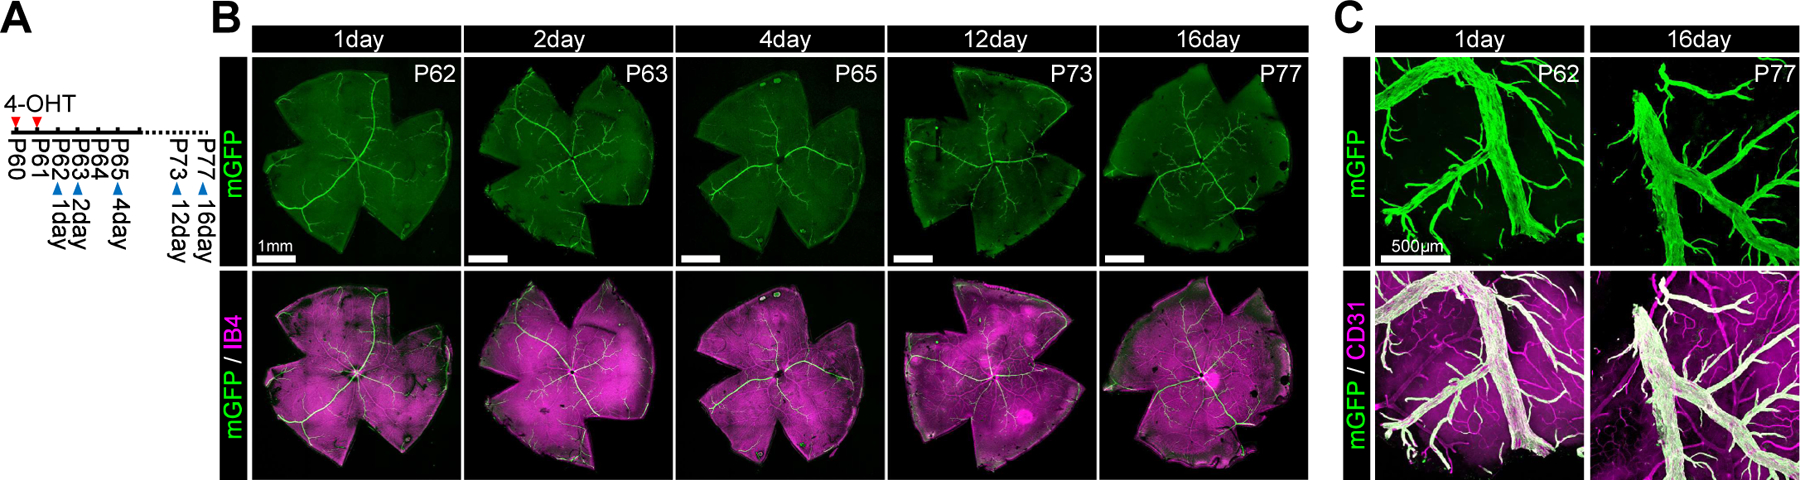
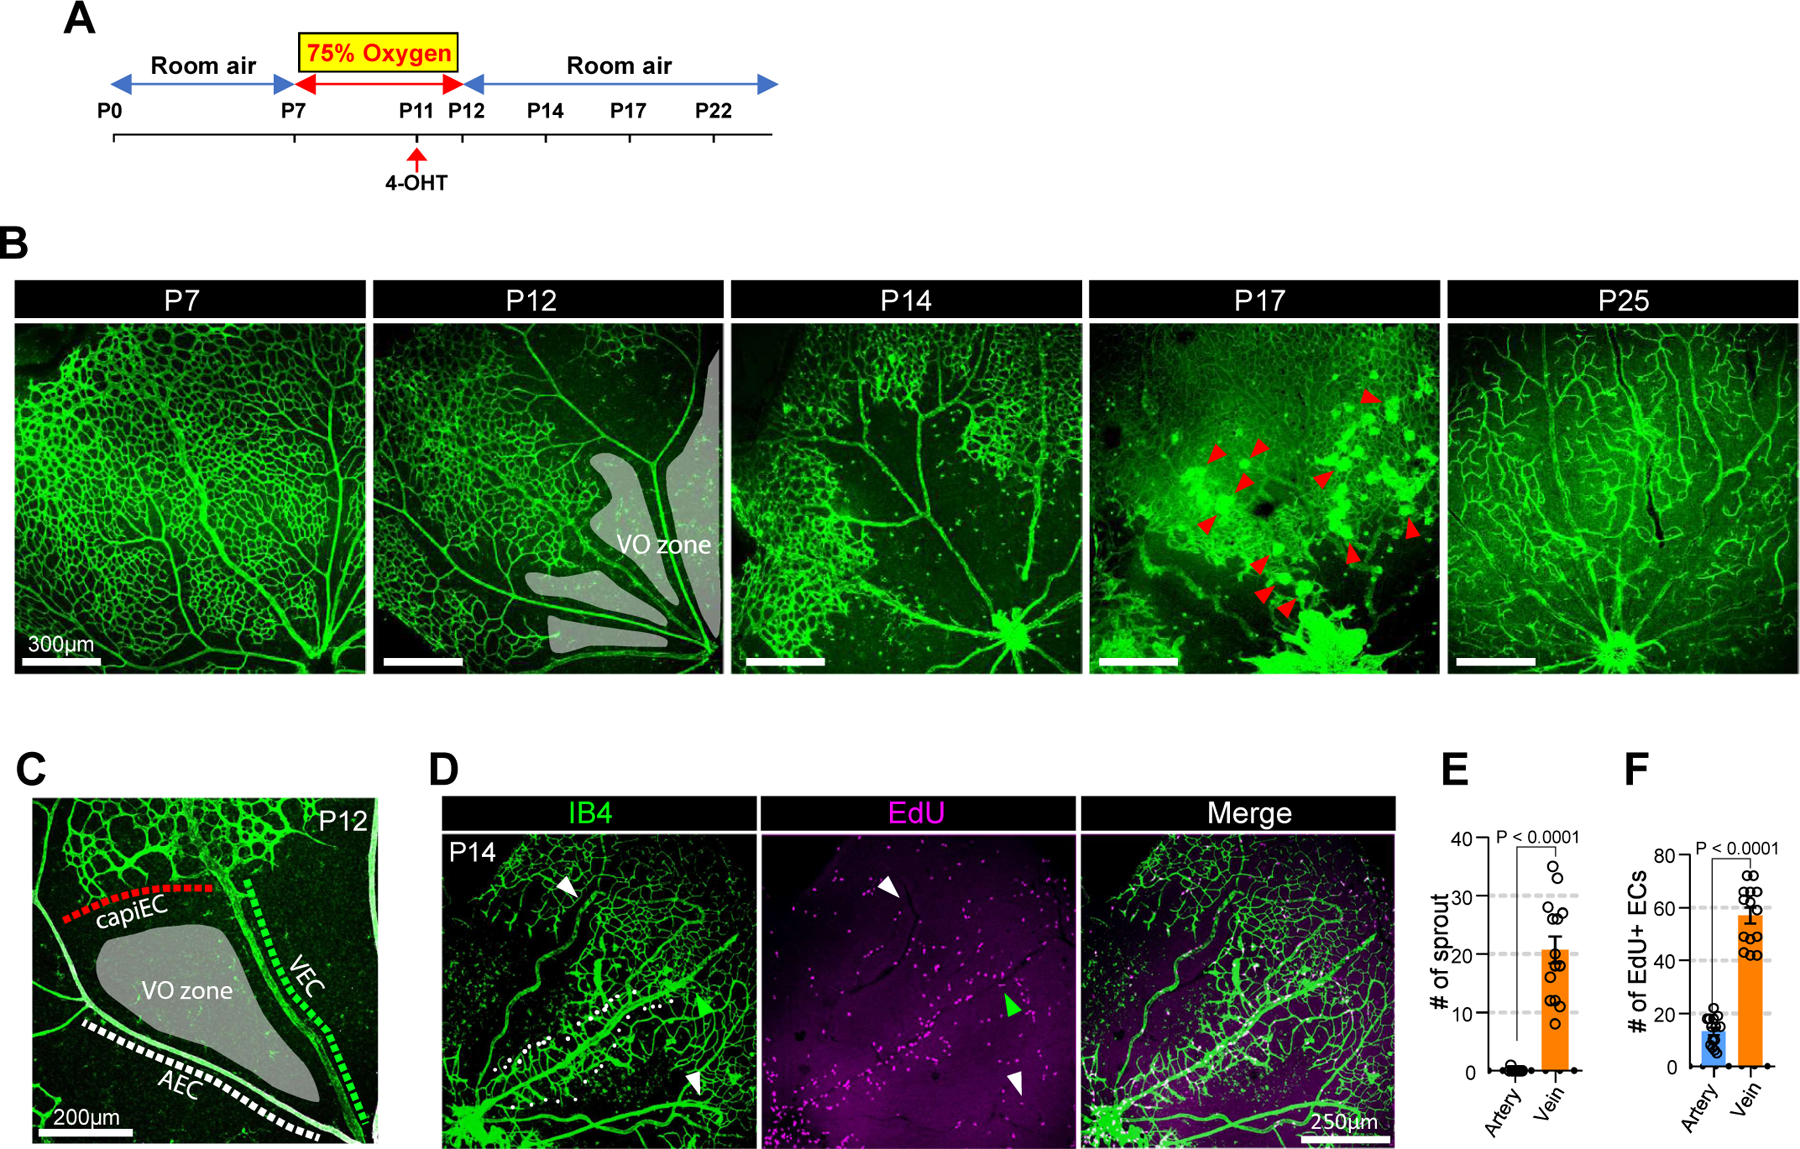
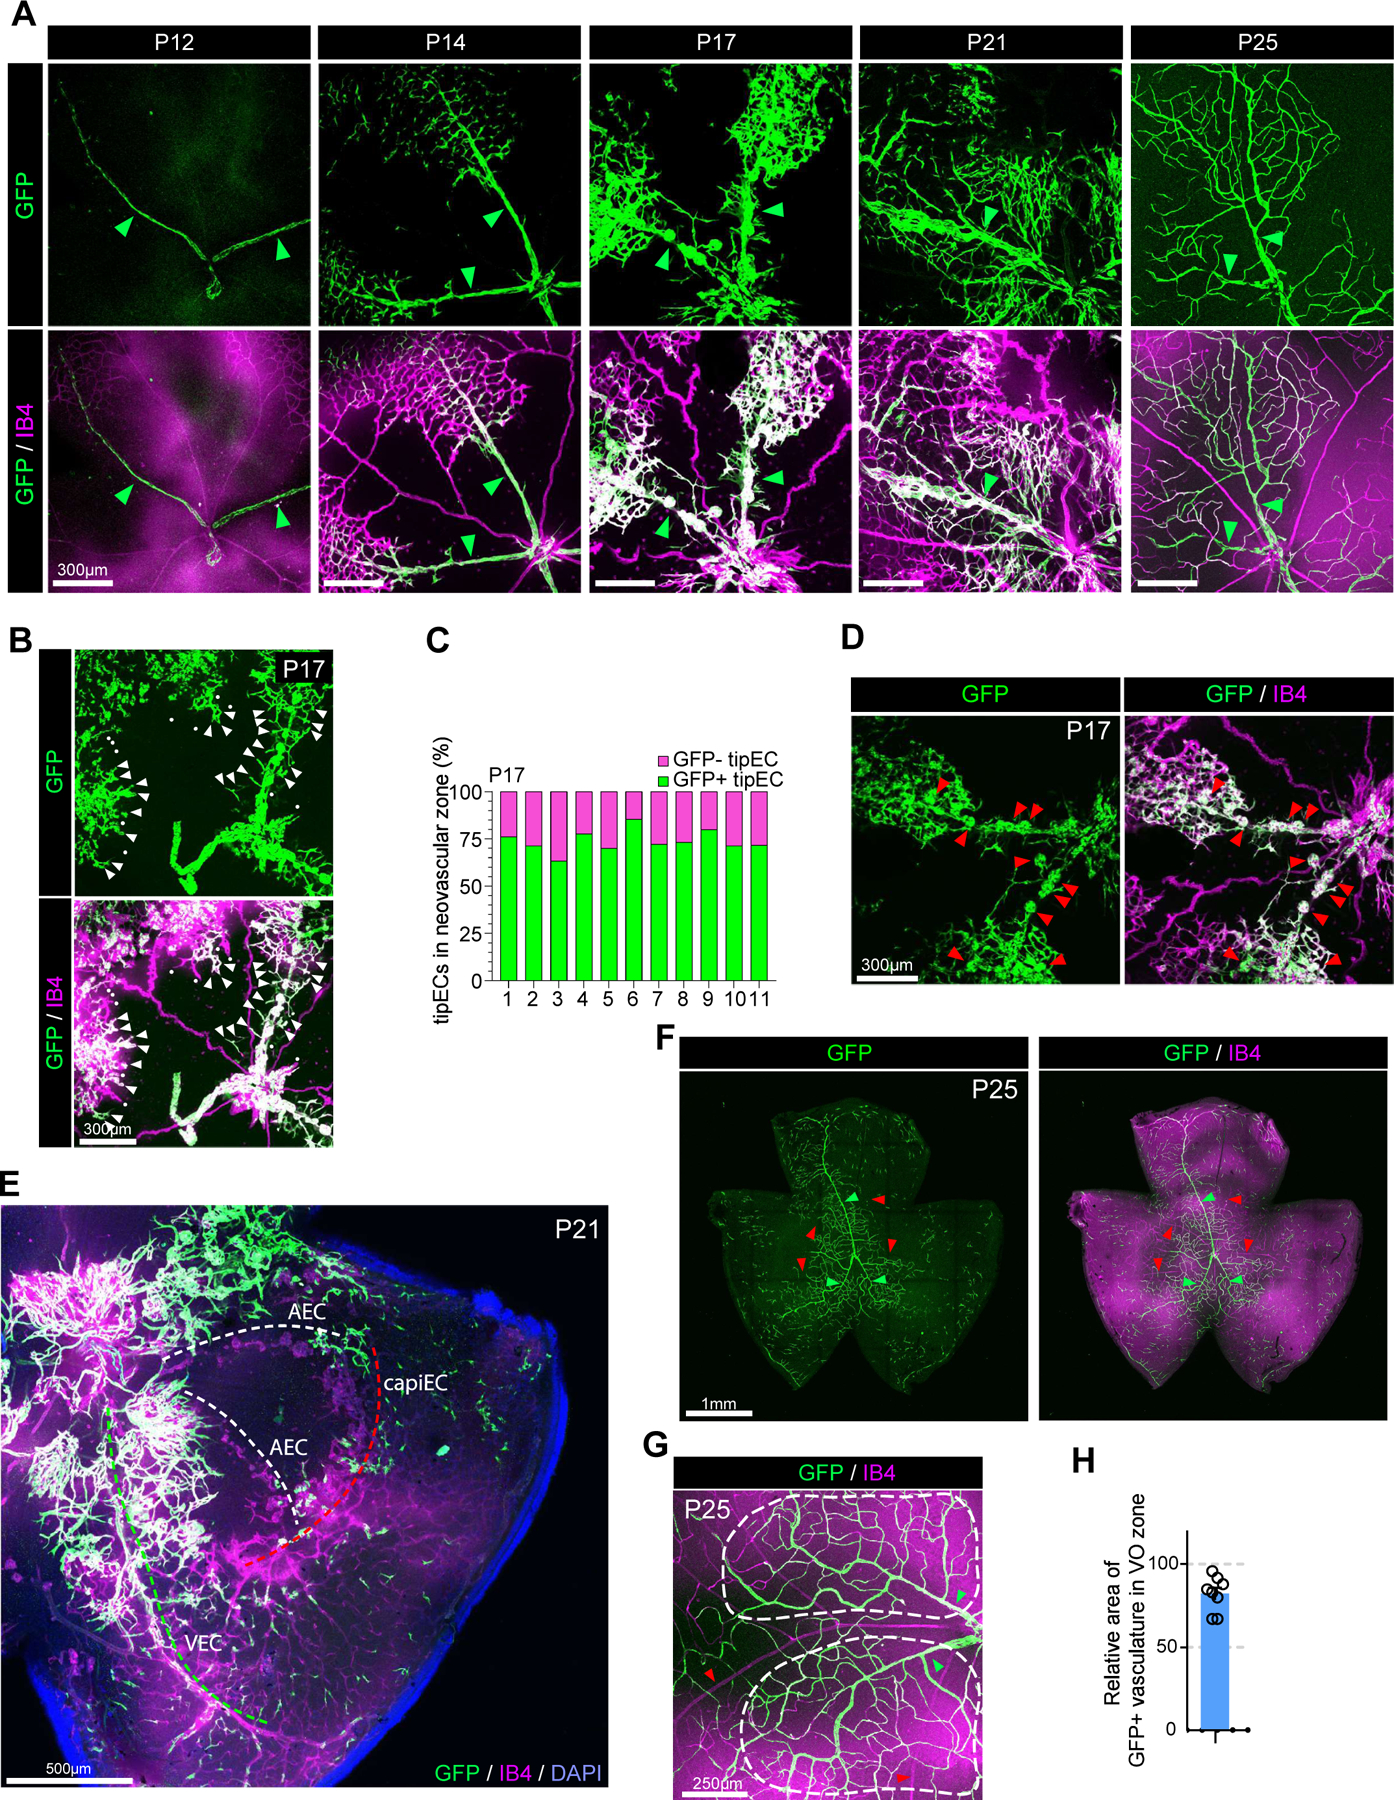
Results: Using a comprehensive set of endothelial subtype-specific inducible reporter mice, including tip, arterial, and venous endothelial reporter lines, we showed that venous endothelial cells are the primary endothelial subtype responsible for the expansion of an angiogenic vascular network. During physiological angiogenesis, venous endothelial cells proliferate, migrating against the blood flow and differentiating into tip, capillary, and arterial endothelial cells of the new vasculature. Using intravital 2-photon imaging, we observed venous endothelial cells migrating against the blood flow to form new blood vessels. Venous endothelial cell migration also plays a key role in pathological angiogenesis. This was observed both in formation of arteriovenous malformations in mice with inducible endothelium-specific Smad4 deletion mice and in pathological vessel growth seen in oxygen-induced retinopathy.

Conclusions: Our studies establish that venous endothelial cells are the primary endothelial subtype responsible for normal expansion of vascular networks, formation of arteriovenous malformations, and pathological angiogenesis. These observations highlight the central role of the venous endothelium in normal development and disease pathogenesis.

Keywords: arteriovenous malformations; cell differentiation; cell lineage; endothelial cells; intravital microscopy; vascular remodeling.


Figures

Figure 1.
Figure 1.. VECs differentiate into tip, capillary and arterial ECs in the retinal vasculature.
A. Confocal images showing ERG1/2/3 (red, EC nucleus marker) and GM130 (green, golgi marker) immunostaining in P7 retinal vasculature. Right panel represents endothelial nucleus and golgi in the area with white dotted rectangle (a’ : artery and b’ : vein). Note that the orientation (green arrows) of EC polarization is against blood flow (yellow arrow). B. Tracing of mGFP-expressing VECs (green) in the retinal vasculature (Isolectin B4, purple) of VECmReporter mice. Note that mGFP expressing VECs are restricted to proximal veins (white brace) at 12hr after induction. These cells are incorporated into capillaries (2days after induction) and arteries (4 days after induction). C. Immunostaining for Isolectin B4 (purple) at 4 days after induction showing mGFP-positive ECs (green) in the vascular front of P7 retinal vasculature. Red arrowhead indicates mGFP-positive TipEC D. Immunostaining for Isolectin B4 (purple) at 4 days after induction showing mGFP-positive ECs (green) in a retinal artery (yellow arrowheads). E. Confocal images showing GFP (green) and SOX17 (red) immunostaining in P7 retinal vasculature of VECiDreReporter mice when 4-OHT was administrated at P0, P1 and P2. F. Confocal images showing GFP (green) and ERG1/2/3 (red) immunostaining in P7 retinal vasculature of VECiDreReporter mice when 4-OHT was administrated at P0, P1 and P2. G. Quantification of GFP+ ECs in P7 retinal vasculature of VECiDreReporter mice. (n=5) H. P10 retinal whole mount Immunostaining of VECmReporter mice for Isolectin B4 (purple) and mGFP (green) at 8 days after induction. Upper panel shows vasculature in superficial (left) and deep layer (right). Lower panel shows 4-OHT administration strategy (left) and mGFP expression (green) in the vasculature (Isolectin B4, purple) of deep layer (right). Note that angiogenic sprouts are mainly located under a vein (green line) while the yellow dotted area under arteries and capillaries (white lines) is avascular. I. P25 retinal whole mount Immunostaining of VECmReporter mice showing vasculature (purple) and mGFP+ (green) ECs in superficial, intermediate and deep retinal layers after 4-OHT administration at P2.5. J. Quantification of GFP+ ECs in each retinal layer of VECmReporter mice. (n=6)
Figure 2.
Figure 2.. VECs migrate against blood flow.
A. Schematic illustration of in vivo 2-photon imaging procedure. B. Timeline of the experimental procedure for 4-OHT administration and imaging using pan-ECnReporter mice. C. Fluorescence image from GFP channel before 2-photon microscopy (left panel) showing a first branch of superior sagittal sinus at cortex surface. The fluorescence image also provides the structural information of vessels and indicates the location of superior sagittal sinus(SSS) and the blood flow (from distal (small diameter) to proximal (larger diameter) vein). Area with white dotted rectangle in left panel was observed with 2-photon microscopy (right panel). 2-photon images from two different time points (0hr and 5hr) showing the position of individual ECs (mGFP, green) and non-ECs (mRFP, red). Note that ECs (white circles) in the vein (inner space of white dotted line) migrate against the blood flow. Yellow rectangles represent immobile cells throughout the observation. D. Trajectories (white arrow) of individual ECs in the vein from 0hr (yellow dots) to 5hr(red dots). (see Supplemental Movie. I). E. Quantification of speed of VEC migration. (n=12)
Figure 3.
Figure 3.. VECs on quiescent stage shows lack of migration.
A. Timeline of the experimental procedure for 4-OHT administration and imaging. B. Confocal images of the whole mount retina immunohistochemistry showing mGFP-positive VECs (green) and vasculature (Isolectin B4, purple) on adulthood Gm5127imGFP mice as indicated timepoints after 4-OHT administration. C. Confocal images of the brain (cerebral cortex) immunohistochemistry showing mGFP-positive VECs (green) and vasculature (CD31, purple) on adulthood Gm5127imGFP mice as indicated timepoints after 4-OHT administration.
Figure 4.
Figure 4.. Misdirected migration of VECs results in AV shunt formation.
A. Schematic diagram showing a strategy for generation of Smad4iECKO;VECiDrereporter mice. Smad4 is deleted by inducible panEC specific Cre (Cdh5(PAC)CreERT2) while VECs is labeled with GFP using VEC-specific inducible Dre (Gm5127(BAC)DreERT2). B. Strategy for 4-OHT administration and analysis. C. Representative images showing the vascular phenotype (Isolectin B4 : red and GFP: green, respectively) of Smad4iECKO;VECiDrereporter (right) mice and WT littertmate(left, VECiDrereporter). White arrowheads indicate AVMs. D. Representative images showing the P7 retinal vasculature (Isolectin B4 : red, GFP: green) of Smad4iECKO;VECiDrereporter mice. White arrowheads indicate AV shunt. E. Representative images showing the P6 retinal vasculature (Isolectin B4 : red, GFP: green) of Smad4iECKO;VECiDrereporter mice. Note that vein starts to form abnormal branch (white dotted line) toward the nearby artery and ECs in the sprout are labeled with GFP. F. Confocal images showing EdU and IB4 staining in P7 retinal vasculature of Smad4iECKO mice. Note that ECs in AV shunt are highly proliferative. G. Representative images showing GM130 (cyan) and DAPI (green) immunostaining in P7 retinal vasculature (Isolectin B4 : red, GFP: green) of Smad4iECKO mice. Right panel represents endothelial nucleus and golgi in AV shunt. Note that endothelial golgi orientation in AV shunt is toward artery. H. Representative images showing the P7 retinal vasculature (Isolectin B4 : red, GFP: green) of Smad4iECKO;VECiDrereporter mice and WT littermate at low magnification. I. Quantification of GFP+ area in the P7 retinal vasculature of VECiDrereporter (blue) and Smad4iECKO;VECiDrereporter (orange) mice. (n=7, unpaired two-samples t-test) J. Representative images showing the vascular front area of P7 Smad4iECKO;VECiDrereporter mice (bottom) and WT littermate (top). (Isolectin B4 : purple, GFP: green). Green arrowheads indicate GFP+ TipECs. K. Quantification of GFP+ TipECs in the P7 retinal vasculature of VECiDrereporter (blue) and Smad4iECKO;VECiDrereporter (orange) mice. (n=8, unpaired two-samples t-test)
Figure 5.
Figure 5.. Vein is the primary site for neoangiogenic spout initiation in OIR-induced neovascularization.
A. schematic diagram showing the experimental design of the OIR model. Postnatal pups along with their nursing female were exposed to 75% oxygen from P7 to P12 to induce vaso-obliteration and returned to room air from P12 until further analysis. 4-OHT was injected at P11 to label VECs in VECiDrereporter mice before dissection at indicated time points. B. Time course observation of vasculature (Isolectin B4, green) during OIR at indicated time points (P12, P14, P17 and P22, respectively). At P12, the vasculature forms vaso-obliteration zone (VO zone, gray-colored area). At P14, the vasculature initiates neovascularization. At P17, the vasculature shows strong angiogenic activity and forms neovascular tuft (red arrowheads). At P25, the VO zone is fully recovered. C. Representative image showing the endothelial environment of vaso-obliteration zone. (VO zone) Note that VO zone is surrounded by three different endothelial subtypes including AEC, VEC and CapiEC. D. Representative images showing EdU staining (purple) in the P14 vasculature (Isolectin B4, green) of OIR model. Note that only vein (green arrowhead) initiates angiogenic sprouting (white dots), but not artery (white arrowheads). E. Quantification of angiogenic sprouts from artery (blue) and vein (orange) at P14 OIR retina. (n=14, unpaired two-samples t-test) F. Quantification of Edu-positive ECs in artery (blue) and vein (orange) at P14 OIR retina. (n=14, unpaired two-samples t-test)
Figure 6.
Figure 6.. VEC is the primary source of ECs in OIR-induced neovascularization.
A. Time course observation of the vasculature (Isolectin B4, purple) and GFP+ VECs (green) in VECiDrereporter mice during OIR at indicated time points (P12, P14, P17, P21 and P25, respectively). Green arrowheads indicate veins. At P12, only veins express GFP showing VEC specific labeling in VECiDrereporter mice. At P14, GFP+ VECs start migration from veins. At P17, veins, but not arteries, initiate angiogenic sprouting. At P21, the majority of ECs in VO zone of P21 retinal vasculature are GFP+. At p25, the VO zone is completely recovered by GFP+ ECs showing that they are originated from VECs. B. Representative images showing GFP+ TipECs in P17 retinal vasculature of VECiDrereporter mice. (white arrowheads : GFP-positive TipEC, white dots: GFP-negative TipECs) C. Quantification of relative number of GFP+ TipECs versus GFP- TipECs in the neovascular zone of VECiDrereporter mice (P17). X-axis shows individual sample (n=11). D. Representative images showing neovascular tufts (red arrowheads) and GFP expression in P17 retinal vasculature of VECiDrereporter mice. Note that all neovascular tufts are GFP+ showing ECs in the tuft are originated from VECs. E. Representative images showing vasculature in P21 OIR of VECiDrereporter mice (DAPI: blue, GFP: green, Isolectin B4 : purple) Note that the VO zone around vein (green dotted line) is recovered by neovascularization, but not artery (white dotted line) and capillary (red dotted line). F. Representative images showing the vasculature (Isolectin B4 : purple) and GFP-expressing ECs (green) in P25 OIR of VECiDrereporter mice. Note that the majority of VO zone is recovered by GFP+ ECs. Red and green arrowheads indicate arteries and veins, respectively. G. Representative images showing the VO zone (the area in white dotted lines) in P25 OIR of VECiDrereporter mice (Isolectin B4 : purple, GFP: green). Red and green arrowheads indicate arteries and veins, respectively. H. Quantification of GFP+ area in the vasculature of VO zone in P25 OIR. (n=8)

References

    1. Simons M, Gordon E and Claesson-Welsh L. Mechanisms and regulation of endothelial VEGF receptor signalling. Nat Rev Mol Cell Biol 2016;17:611–25. - PubMed
    1. Gerhardt H, Golding M, Fruttiger M, Ruhrberg C, Lundkvist A, Abramsson A, Jeltsch M, Mitchell C, Alitalo K, Shima D and Betsholtz C. VEGF guides angiogenic sprouting utilizing endothelial tip cell filopodia. J Cell Biol 2003;161:1163–77. - PMC - PubMed
    1. Pitulescu ME, Schmidt I, Giaimo BD, Antoine T, Berkenfeld F, Ferrante F, Park H, Ehling M, Biljes D, Rocha SF et al. Dll4 and Notch signalling couples sprouting angiogenesis and artery formation. Nature Cell Biology 2017;19:915–927. - PubMed
    1. Xu C, Hasan SS, Schmidt I, Rocha SF, Pitulescu ME, Bussmann J, Meyen D, Raz E, Adams RH and Siekmann AF. Arteries are formed by vein-derived endothelial tip cells. Nature Communications 2014. Dec 15;5:5758.. - PMC - PubMed
    1. Atri D, Larrivee B, Eichmann A and Simons M. Endothelial signaling and the molecular basis of arteriovenous malformation. Cell Mol Life Sci 2013. Sep 28;10.. - PMC - PubMed

Publication types