. 2021 Sep 2;12(1):5249.
doi: 10.1038/s41467-021-25380-2.

Orexin receptors 1 and 2 in serotonergic neurons differentially regulate peripheral glucose metabolism in obesity

Affiliations

Orexin receptors 1 and 2 in serotonergic neurons differentially regulate peripheral glucose metabolism in obesity

Xing Xiao et al. Nat Commun. .

Abstract

The wake-active orexin system plays a central role in the dynamic regulation of glucose homeostasis. Here we show orexin receptor type 1 and 2 are predominantly expressed in dorsal raphe nucleus-dorsal and -ventral, respectively. Serotonergic neurons in ventral median raphe nucleus and raphe pallidus selectively express orexin receptor type 1. Inactivation of orexin receptor type 1 in serotonin transporter-expressing cells of mice reduced insulin sensitivity in diet-induced obesity, mainly by decreasing glucose utilization in brown adipose tissue and skeletal muscle. Selective inactivation of orexin receptor type 2 improved glucose tolerance and insulin sensitivity in obese mice, mainly through a decrease in hepatic gluconeogenesis. Optogenetic activation of orexin neurons in lateral hypothalamus or orexinergic fibers innervating raphe pallidus impaired or improved glucose tolerance, respectively. Collectively, the present study assigns orexin signaling in serotonergic neurons critical, yet differential orexin receptor type 1- and 2-dependent functions in the regulation of systemic glucose homeostasis.


Conflict of interest statement

The authors declare no competing interests.

Figures

Fig. 1
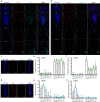
Fig. 1. Distribution of Ox1R and Ox2R in serotonergic neurons of the raphe nucleus of a SERTtdTomato mouse.
a Representative images of RNAscope in situ hybridization in the dorsal raphe nucleus (dorsal (DRD), ventral (DRV)), and median raphe nucleus (dorsal (MRD), ventral (MRV)). b Representative images of RNAscope in situ hybridization in the raphe pallidus (RPa). c, e Percentages of Ox1R or Ox2R positive neurons in serotonergic neurons. d, f The average of relative fluorescence intensity of Ox1R or Ox2R signal in each serotonergic neuron. Fluorescence was normalized by the mean of all regions for each mouse. Blue, tdTomato; red, Ox1R; cyan, Ox2R. Scale bar: 100 µm in (a) and 50 µm in (b). n = 3. Data are represented as means ± SEM. d DRV: p = 0.035, MRD: p = 0.036; e DRD: p = 0.049, MRD: p = 0.0081, RPa: p = 0.028; f DRD: p = 0.010, MRV: p = 0.0008, RPa: p = 0.0099. *p < 0.05, **p < 0.01, ***p < 0.001; compared to DRD (d) or DRV (e, f), as determined by paired two-tailed t-test (c, e) or ratio paired two-tailed t-test (d, f). Analysis of published scRNA-Seq data of serotonergic neurons in dorsal raphe nucleus (DR),: g Scatter plot of raw cell read counts of Ox1R and Ox2 R, g’ percentages of serotonergic neurons only expressing Ox1R (Ox1R-only) or Ox2R (Ox2R-only) and those expressing both or none of Ox1R and Ox2R (Ox1/2R+ or Ox1/2 R−), h scatter plot of raw vesicular glutamate transporter 3 (VGLUT3) counts against raw Ox1R or Ox2R counts, h’ percentages of VGLUT3 positive (+) and negative (−) neurons in Ox1R-only and h” Ox2R-only serotonergic neurons, and i heat map of gene counts for cells with column-wise z-scores. Mean gene abundance was calculated per gene (x-dimension) and group (y-dimension). Column-wise z-scoring (per gene) was applied to make expression visually comparable between groups independent of average gene abundance levels. j Representative images of RNAscope in situ hybridization in the dorsal raphe nucleus (scale bar: 100 µm), and analysis: k percentages of Ox1R-only, Ox2R-only, Ox1/2R+ and Ox1/2R− serotonergic neurons; percentages of VGLUT3 positive neurons in (l) Ox1R-only and (m) Ox2R-only serotonergic neurons. Gray, tryptophan hydroxylase isoform 2 (TPH2); red, Ox1R; cyan, Ox2R; blue, VGLUT3. n = 3. Source data are provided as a Source Data file.
Fig. 2
Fig. 2. Specific inactivation of Ox1R or Ox2R in serotonergic neurons of a Ox1RΔSERT/tdTomato or Ox2RΔSERT/tdTomato mouse, respectively.
a Representative images of RNAscope in situ hybridization in the dorsal raphe nucleus (dorsal (DRD), ventral (DRV)) and median raphe nucleus (dorsal (MRD), ventral (MRV)) of a Ox1RΔSERT/tdTomato mouse and b a Ox2RΔSERT/ tdTomato mouse. c Representative images of RNAscope in situ hybridization in the raphe pallidus (RPa) of a Ox1RΔSERT/tdTomato mouse and d a Ox2RΔSERT/tdTomato mouse. e, g Percentages of Ox1R or Ox2R positive neurons in serotonergic neurons. f, h The average of raw fluorescence intensity of Ox1R or Ox2R signal in each serotonergic neuron. Blue, tdTomato; red, Ox1R; cyan, Ox2R. Scale bar: 100 µm in (a, b) and 50 µm in (c, d). Ox1RΔSERT/tdTomato, n = 4; Ox2RΔSERT/tdTomato, n = 3. Data are represented as means ± SEM. f Ox1RΔSERT/ tdTomato: p = 0.0005 (DRV) and 0.0011 (MRD); Ox2RΔSERT/ tdTomato: p = 0.0041 (DRV), 0.0088 (MRD) and 0.0098 (MRV). g Ox1RΔSERT/ tdTomato: p = 0.013 (MRD), 0.0006 (MRV) and 0.0014 (RPa); Ox2RΔSERT/ tdTomato: p = 0.0002 (DRD) and 0.0046 (MRD). h Ox1RΔSERT/ tdTomato: p = 0.038 (MRD), 0.039 (MRV) and 0.037 (RPa); Ox2RΔSERT/ tdTomato: p = 0.037 (DRD). *p < 0.05, **p < 0.01, ***p < 0.001, ****p < 0.0001; as determined by two-way ANOVA followed by Sidak’s post hoc test. The main effect of genotype: e (F (1, 25) = 583.60, p < 0.0001), f (F (1, 25) = 234.20, p < 0.0001), g (F (1, 25) = 53.99, p < 0.0001), h (F (1, 25) = 20.08, p = 0.0001). #p < 0.05, ##p < 0.01, ###p < 0.001, compared to DRD (f) or DRV (g, h), as determined by paired two-tailed t-test. Source data are provided as a Source Data file.
Fig. 3
Fig. 3. Effect of orexin A and orexin B on serotonergic neurons in the dorsal raphe nucleus (DR) analyzed by patch-clamp recordings and Ca2 + imaging with GCaMP6.
Recordings were performed in brain slices from control, Ox1RΔSERT, and Ox2RΔSERT male mice, with tdTomato or GCaMP6 expression in serotonergic neurons for patch clamp or Ca2 + imaging, respectively. a Schematic illustration of the dorsal raphe nucleus (dorsal (DRD), ventral (DRV)) and an exemplary image of a recorded serotonergic neuron in DRD, which was biocytin-streptavidin labeled during the experiment. Scale bar: 50 µm. Insert: tdTomato labeling (top) and double labeling with tdTomato and biocytin-streptavidin (bottom). Scale bar: 20 µm. b, c Orexin A (b) and orexin B (c) effect on action potential firing rate of serotonergic neurons in DRD. Original recordings (top) and comparisons of mean firing rates (bottom). The stacked bars show the percentage of individual neurons in which the increase in action potential frequency was larger than 3 × SD of the control, thus defining them as responsive (see “Methods”). Mean firing rates were compared using paired two-tailed students t-test. b Orexin A application: Ctrl, p < 0.0001, n = 21; Ox1RΔSERT: p = 0.03, n = 9; Ox2RΔSERT: p = 0.0018, n = 11. c Orexin B application: Ctrl, p < 0.0001, n = 27; Ox1RΔSERT: p < 0.0001, n = 14; Ox2RΔSERT: p = 0.28, n = 11. Abbreviation: baseline (BL). d, e Orexin A and orexin B effect on [Ca2+]i of serotonergic neurons in DRV measured with GCaMP6. d Original recordings (top) and heat maps of five individual neurons for each set of experiments (bottom). The recordings show the responses to the orexins and high K+ saline. Dashed lines indicate the range where the responses were quantified. e Calcium responses upon 100 nM orexin A and orexin B. Data are shown as the percentage of the maximal response to high K+ saline. Mean increases in [Ca2+]i between experimental groups were compared, performing ANOVA with post hoc Tukey tests. Orexin A application: Ctrl vs Ox1RΔSERT, p = 0.88; Ctrl vs Ox2RΔSERT, p < 0.0001; Ox1RΔSERT vs Ox2RΔSERT, p < 0.0001 (Ctrl, n = 159; Ox1RΔSERT, n = 200; Ox2RΔSERT, n = 75). Orexin B application: Ctrl vs Ox1RΔSERT, p = 0.30; Ctrl vs Ox2RΔSERT, p < 0.0001; Ox1RΔSERT vs Ox2RΔSERT, p < 0.0001 (Ctrl, n = 75; Ox1RΔSERT, n = 92; Ox2RΔSERT, n = 122). In the box plots, the horizontal lines show the median of the data. Boxes indicate the 25th and 75th percentile. The whiskers were calculated according to the ‘Tukey’ method. *p < 0.05, **p < 0.01, ***p < 0.001, ****p < 0.0001. n values are given in brackets. Source data are provided as a Source Data file.
Fig. 4
Fig. 4. Increased c-Fos activation in orexin neurons upon high-fat diet (HFD) feeding and improved glucose tolerance in Ox2R∆SERT mice fed a HFD.
a Representative images of RNAscope in situ hybridization in the lateral hypothalamus (LH) of a BL/6 mouse fed a control diet (CD) or HFD. n = 5 (CD) and 4 (HFD). b Percentages of c-Fos positive neurons in orexin neurons. n = 5 (CD) and 4 (HFD). p = 0.029. c, g Average body weight, glucose tolerance test under d, h 16-h and e, i 6-h fasting conditions, and f, j insulin tolerance test of control (Ctrl) and Ox1R∆SERT mice on normal chow diet (NCD) or HFD. NCD-Ctrl and NCD-Ox1R∆SERT, n = 9; HFD-Ctrl, n = 8 (g, h, j) or 11 (i); HFD-Ox1R∆SERT, n = 10 (g, h, j) or 12 (i). i p = 0.16 at 30 min. k, o Average body weight, glucose tolerance test under l, p 16-h and m, q 6-h fasting conditions, and n, r insulin tolerance test of Ctrl and Ox2R∆SERT mice on NCD or HFD. NCD-Ctrl, n = 11; NCD-Ox2R∆SERT, n = 8; HFD-Ctrl, n = 11 (o, p, r) or 13 (q); HFD-Ox2R∆SERT, n = 9. p p = 0.0002 (30 min) and 0.045 (60 min); q p = 0.076 (30 min). Magenta, orexin; yellow, c-Fos. Scale bar: 100 µm. Data are represented as means ± SEM. *p < 0.05, **p < 0.01, ***p < 0.001; as determined by unpaired two-tailed Student’s t-test (b) or two-way ANOVA followed by Sidak’s post hoc test (i, p, q). Two-way ANOVA revealed a significant main effect of genotype in (i) (F (1, 105) = 7.86, p = 0.0060), p (F (1, 90) = 18.22, p < 0.0001) and q (F (1, 100) = 6.08, p = 0.015). Source data are provided as a Source Data file.
Fig. 5
Fig. 5. Insulin sensitivity is impaired in Ox1R∆SERT mice but improved in Ox2R∆SERT mice fed a HFD in hyperinsulinemic-euglycemic clamp analysis.
a Clamp glucose infusion rates (GIR), b hepatic glucose production (HGP) in the basal state and during the steady state of clamp analysis, and c tissue-specific insulin-stimulated [1-14C]-Deoxy-D-glucose uptake in white adipose tissue (WAT), brown adipose tissue (BAT), and skeletal muscle (SM) under steady-state conditions of control (Ctrl) and Ox1R∆SERT mice. HFD-Ctrl, n = 8; HFD-Ox1R∆SERT, n = 14. a p = 0.0025 (110 min) and 0.0028 (120 min); c p = 0.011 (BAT) and 0.0070 (SM). d Clamp GIR, e HGP in the basal state and during the steady state of clamp analysis, and f tissue-specific insulin-stimulated [1-14C]-Deoxy-D-glucose uptake in WAT, BAT, and SM under steady-state conditions of control (Ctrl) and Ox2R∆SERT mice. HFD-Ctrl, n = 10; HFD-Ox2R∆SERT, n = 11. d p = 0.034 (90 min), 0.047 (100 min), 0.041 (110 min) and 0.042 (120 min); e p = 0.048. Data are represented as means ± SEM. *p < 0.05, **p < 0.01; as determined by two-way ANOVA followed by Sidak’s post hoc test (a, d) or unpaired two-tailed Student’s t-test (c, e). Two-way ANOVA revealed a significant main effect of genotype in (a) (F (1, 220) = 18.30, p < 0.0001) and (d) (F (1, 209) = 35.39, p < 0.0001). Source data are provided as a Source Data file.
Fig. 6
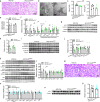
Fig. 6. Insulin signaling in liver and BAT in obese Ox1RΔSERT and Ox2RΔSERT mice.
a, b Western blot images and quantification of p-AktSer473, Akt, and G6Pase protein in the liver of control and Ox1R∆SERT mice. HFD-Ctrl, n = 8; HFD-Ox1R∆SERT, n = 14. c, d Western blot images and quantification of p-AktSer473, Akt, and G6Pase protein in the liver of control and Ox2R∆SERT mice. HFD-Ctrl, n = 10; HFD-Ox2R∆SERT, n = 11. p = 0.013 (p-AktSer473) and 0.0085 (G6Pase). Data are represented as means ± SEM. *p < 0.05, **p < 0.01; as determined by unpaired two-tailed Student’s t-test. e Volcano plot of differential expression analysis of RNA sequencing of BAT in Ox1R∆SERT mice, compared to control mice. Some genes of interest are annotated. The differential gene expression test was done using negative binomial generalized linear models implemented in DESeq2 1.26.0. P-values are false discovery rates adjusted using the Benjamini-Hochberg procedure. f Top 15 differentially regulated gene ontology (GO) terms of class biological process in BAT of Ox1R∆SERT mice, compared to control mice. Significance is mapped to color, the dot size represents the number of significant genes in the GO term and the x-axis maps the percentage of significant genes to the overall gene GO term size. Gene-ontology term analysis of the 265 differentially expressed genes was carried out using the clusterProfiler R package, which utilizes an over-representation analysis calculating p-values by hypergeomtric distributions. P-values are FDR-adjusted. n = 4. Source data are provided as a Source Data file.
Fig. 7
Fig. 7. Increased fat and impaired mitochondrial function in brown adipose tissue (BAT) of Ox1R∆SERT mice while BAT morphology and mitochondrial function are unaltered in Ox2R∆SERT mice fed a high-fat diet (HFD).
a H&E staining of BAT of control or Ox1R∆SERT mice. HFD-Ctrl, n = 8; HFD-Ox1R∆SERT, n = 10. b Representative electronic microscope (EM) images of BAT of control and Ox1R∆SERT mice, and quantification of c mitochondrial area and d mitochondrial aspect ratio. n = 5. p = 0.033. e Relative mitochondrial DNA content of control and Ox1R∆SERT mice. n = 6. f Gene expression levels in BAT of control and Ox1R∆SERT mice. Control: n = 6 (Mfn2), 7 (Mff), 8 (Vegfa, Cycs, Mfn1, Dnm1l) and 9 (Acox3, Ppargc1a, Fis1); Ox1R∆SERT, n = 11. p = 0.0026 (Acox3), 0.0031 (Vegfa), 0.0038 (Ppargc1a), 0.024 (Cycs), 0.075 (Mfn1) and 0.0035 (Dnm1l). g, h Western blot images and quantification of UCP-1 and TOM20 protein, i, j OXPHOS protein, and k, l mitochondrial fusion and fission protein in BAT of control and Ox1R∆SERT mice. UCP1 and FIS1 were from the same western blot gel and thus shared the loading control. HFD-Ctrl, n = 8; HFD-Ox1R∆SERT, n = 9. p = 0.020 (UCP−1), 0.015 (CI-NDUFB8), 0.094 (CII-SDHB), 0.021 (CIV-MTCO1), 0.038 (MFN1) and 0.0039 (FIS1). m H&E staining of BAT of control and Ox2R∆SERT mice. HFD-Ctrl, n = 11; HFD-Ox2R∆SERT, n = 9. n Gene expression levels in BAT of control and Ox2R∆SERT mice. HFD-Ctrl, n = 8 except for Cycs (n = 7); HFD-Ox2R∆SERT, n = 9 except for Cycs (n = 8). o, p Western blot images and quantification of UCP-1 protein in BAT of control and Ox2R∆SERT mice. HFD-Ctrl, n = 7; HFD-Ox2R∆SERT, n = 9. Scale bar: 100 mm in (a, m) and 2 µm (b). Data are represented as means ± SEM. *p < 0.05, **p < 0.01; as determined by unpaired two-tailed Student’s t-test. Source data are provided as a Source Data file.
Fig. 8
Fig. 8. Optogenetic stimulation of orexin neurons impairs glucose tolerance.
a Representative images of immunostaining of orexin and EYFP in the lateral hypothalamus (LH) of Orexin-Cre mice injected with Cre-dependent adeno-associated virus pAAV-EYFP (OrexinEYFP) or pAAV-ChR2-EYFP (OrexinChR2-EYFP). n = 3. b Quantification of percentages of GFP positive neurons in orexin neurons of mice injected with AAV. n = 3. Magenta, orexin; green, EYFP. c Schematic drawing of the strategy of optogenetic stimulating of orexin neurons. d Glucose tolerance test and e insulin tolerance test of OrexinChR2-EYFP mice with (laser on) or without (laser off) laser illumination in LH. d n = 10, p = 0.0056 (15 min); e n = 9, p = 0.081 (60 min). f Representative images of RNAscope in situ hybridizations of c-Fos and orexin in LH and g the quantification of percentages of c-Fos positive neurons in orexin neurons after laser illumination. n = 5 or 4. p = 0.027. Red, orexin; yellow, c-Fos. h Representative images of retrobeads injected in dorsal raphe nucleus (red beads) and raphe pallidus (green beads). i Representative images of retrobeads traveled to LH, in which the squares-indicated regions were amplified in (j). n = 5. Magenta, red beads; cyan, green beads. Scale bar: 200 µm (a, f), 100 µm (i) or 50 µm (h, j). Data are represented as means ± SEM. *p < 0.05, **p < 0.01, ***p < 0.001; as determined by unpaired two-tailed Student’s t-test (g) or two-way ANOVA followed by Sidak’s post hoc test (d, e). Two-way ANOVA revealed a significant main effect of genotype in (d) (F (1, 108) = 15.75, p = 0.0001), and (e) (F (1, 80) = 7.00, p = 0.0098). Source data are provided as a Source Data file.
Fig. 9
Fig. 9. Optogenetic stimulation of orexinergic fibers in raphe pallidus (RPa) improves glucose tolerance.
a Representative images of immunostaining of orexin and EYFP in DR/MR (upper panel) and RPa (lower panel) of Orexin-Cre mice injected with Cre-dependent adeno-associated virus pAAV-EYFP or b pAAV-ChR2-EYFP virus (OrexinChR2-EYFP). n = 3. Blue, serotonin; magenta, orexin; green, EYFP. c Schematic drawing of the strategy of optogenetic stimulation of orexinergic fibers in RPa. d Glucose tolerance test and e insulin tolerance test of OrexinChR2-EYFP mice with (laser on) or without (laser off) laser illumination in RPa. n = 8. d p = 0.0015 (15 min). f Representative images of RNAscope in situ hybridization of c-Fos and serotonin transporter (SERT) in raphe pallidus and g the quantification of percentages of c-Fos positive neurons in serotonergic neurons after laser illumination. n = 4. p = 0.015. Red, SERT; yellow, c-Fos. Scale bar: 100 µm. Data are represented as means ± SEM. *p < 0.05, **p < 0.01; as determined by unpaired two-tailed Student’s t-test (g) or two-way ANOVA followed by Sidak’s post hoc test (d). Two-way ANOVA revealed a significant main effect of genotype in (d) (F (1, 84) = 9.34, p = 0.0030). Source data are provided as a Source Data file.

Comment in

  • Glucose control.
    Lewis S. Lewis S. Nat Rev Neurosci. 2021 Nov;22(11):655. doi: 10.1038/s41583-021-00530-z. Nat Rev Neurosci. 2021. PMID: 34584266 No abstract available.

References

    1. Ng M, et al. Global, regional, and national prevalence of overweight and obesity in children and adults during 1980-2013: a systematic analysis for the Global Burden of Disease Study 2013. Lancet. 2014;384:766–781. doi: 10.1016/S0140-6736(14)60460-8. - DOI - PMC - PubMed
    1. Timper K, Bruning JC. Hypothalamic circuits regulating appetite and energy homeostasis: pathways to obesity. Dis. Model Mech. 2017;10:679–689. doi: 10.1242/dmm.026609. - DOI - PMC - PubMed
    1. Soya S, Sakurai T. Evolution of orexin neuropeptide system: structure and function. Front. Neurosci. 2020;14:691. doi: 10.3389/fnins.2020.00691. - DOI - PMC - PubMed
    1. Sakurai T, et al. Orexins and orexin receptors: a family of hypothalamic neuropeptides and G protein-coupled receptors that regulate feeding behavior. Cell. 1998;92:573–585. doi: 10.1016/S0092-8674(00)80949-6. - DOI - PubMed
    1. de Lecea L, et al. The hypocretins: hypothalamus-specific peptides with neuroexcitatory activity. Proc. Natl Acad. Sci. USA. 1998;95:322–327. doi: 10.1073/pnas.95.1.322. - DOI - PMC - PubMed

Publication types

MeSH terms