

Differences in the dynamics of community disaster resilience across the globe
- PMID: 34475449
- PMCID: PMC8413441
- DOI: 10.1038/s41598-021-96763-0
Differences in the dynamics of community disaster resilience across the globe
Abstract
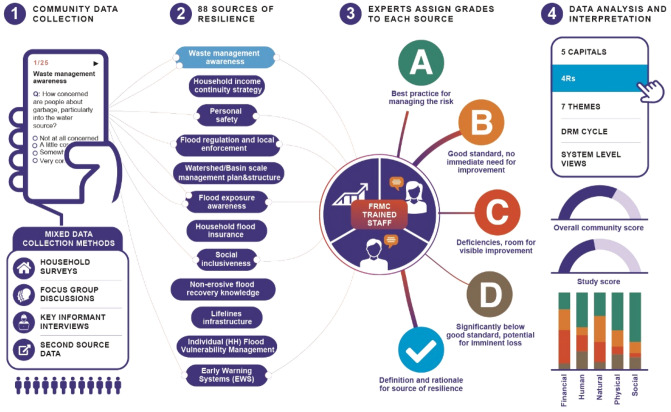
The consideration of disaster resilience as a multidimensional concept provides a viable and promising way forward for reducing risk and minimizing impacts today and in the future. What is missing is the understanding of the actual dynamics of resilience over time based on empirical evidence. This empirical understanding requires a consistent measure of resilience. To that end, a Technical Resilience Grading Standard for community flood resilience, was applied in a longitudinal study from 2016 to 2018 in 68 communities across the globe. We analyse the dynamics of disaster resilience using an advanced boosted regression tree modelling framework. The main outcome of our analysis is twofold: first, we found empirical evidence that the dynamics of resilience build on a typology of communities and that different community clusters experience different dynamics; and second, the dynamics of resilience follows transitional behaviour rather than a linear or continuous process. These are empirical insights that can provide ways forward, theoretically as well as practically, in the understanding of resilience as well as in regard to effective policy guidance to enhance disaster resilience.
© 2021. The Author(s).
Conflict of interest statement
The authors declare no competing interests.
Figures


References
-
- CRED/UNISDR. Economic losses, poverty & disasters: 1998–2017. https://www.preventionweb.net/files/61119_credeconomiclosses.pdf (2018).
-
- UNDRR. Sendai Framework for Disaster Risk Reduction 2015–2030. https://www.preventionweb.net/files/43291_sendaiframeworkfordrren.pdf (2015).
-
- United Nations. Transforming our world: the 2030 Agenda for Sustainable Development. https://www.un.org/ga/search/view_doc.asp?symbol=A/RES/70/1&Lang=E (2015).
-
- Munich Re. Topics Geo: Natural catastrophes 2017. https://www.munichre.com/en/risks/natural-disasters-losses-are-trending-... (2018).
-
- Bouwer, L. M. Observed and projected impacts from extreme weather events: implications for loss and damage. In Loss and Damage from Climate Change (eds Mechler, R. et al.) 63–82 (Springer, 2019).
Publication types
LinkOut - more resources
Full Text Sources
