. 2021 Sep;53(9):1300-1310.
doi: 10.1038/s41588-021-00913-z. Epub 2021 Sep 2.

Large-scale cis- and trans-eQTL analyses identify thousands of genetic loci and polygenic scores that regulate blood gene expression

Urmo Võsa #  1   2 Annique Claringbould #  3   4   5 Harm-Jan Westra  6   7 Marc Jan Bonder  6   8 Patrick Deelen  6   7   9   10 Biao Zeng  11 Holger Kirsten  12   13 Ashis Saha  14 Roman Kreuzhuber  15   16   17 Seyhan Yazar  18 Harm Brugge  6   7 Roy Oelen  6   7 Dylan H de Vries  6   7 Monique G P van der Wijst  6   7 Silva Kasela  19 Natalia Pervjakova  19 Isabel Alves  20   21 Marie-Julie Favé  20 Mawussé Agbessi  20 Mark W Christiansen  22 Rick Jansen  23 Ilkka Seppälä  24 Lin Tong  25 Alexander Teumer  26   27 Katharina Schramm  28   29 Gibran Hemani  30 Joost Verlouw  31 Hanieh Yaghootkar  32   33   34 Reyhan Sönmez Flitman  35   36 Andrew Brown  37   38 Viktorija Kukushkina  19 Anette Kalnapenkis  19 Sina Rüeger  39 Eleonora Porcu  39 Jaanika Kronberg  19 Johannes Kettunen  40   41   42   43 Bernett Lee  44 Futao Zhang  45 Ting Qi  45 Jose Alquicira Hernandez  18 Wibowo Arindrarto  46 Frank Beutner  47 BIOS Consortiumi2QTL ConsortiumJulia Dmitrieva  48 Mahmoud Elansary  48 Benjamin P Fairfax  49 Michel Georges  48 Bastiaan T Heijmans  46 Alex W Hewitt  50   51 Mika Kähönen  52 Yungil Kim  14   53 Julian C Knight  49 Peter Kovacs  54 Knut Krohn  55 Shuang Li  6   9 Markus Loeffler  12   13 Urko M Marigorta  11   56   57 Hailang Mei  58 Yukihide Momozawa  48   59 Martina Müller-Nurasyid  28   29   60 Matthias Nauck  27   61 Michel G Nivard  62 Brenda W J H Penninx  23 Jonathan K Pritchard  63   64 Olli T Raitakari  65   66   67 Olaf Rotzschke  44 Eline P Slagboom  46 Coen D A Stehouwer  68 Michael Stumvoll  69 Patrick Sullivan  70 Peter A C 't Hoen  71 Joachim Thiery  13   72 Anke Tönjes  69 Jenny van Dongen  73 Maarten van Iterson  46 Jan H Veldink  74 Uwe Völker  75 Robert Warmerdam  6   7 Cisca Wijmenga  6 Morris Swertz  9 Anand Andiappan  44 Grant W Montgomery  45 Samuli Ripatti  76   77   78 Markus Perola  79 Zoltan Kutalik  80 Emmanouil Dermitzakis  36   37   81 Sven Bergmann  35   36 Timothy Frayling  32 Joyce van Meurs  31 Holger Prokisch  82   83 Habibul Ahsan  25 Brandon L Pierce  25 Terho Lehtimäki  24 Dorret I Boomsma  73 Bruce M Psaty  84 Sina A Gharib  22   85 Philip Awadalla  20 Lili Milani  19 Willem H Ouwehand  15   16   86 Kate Downes  15   16 Oliver Stegle  8   17   87 Alexis Battle  14   88 Peter M Visscher  45 Jian Yang  45   89   90 Markus Scholz  12   13 Joseph Powell  18   91 Greg Gibson  11 Tõnu Esko  19 Lude Franke  92   93
Collaborators, Affiliations

Large-scale cis- and trans-eQTL analyses identify thousands of genetic loci and polygenic scores that regulate blood gene expression

Urmo Võsa et al. Nat Genet. 2021 Sep.

Abstract

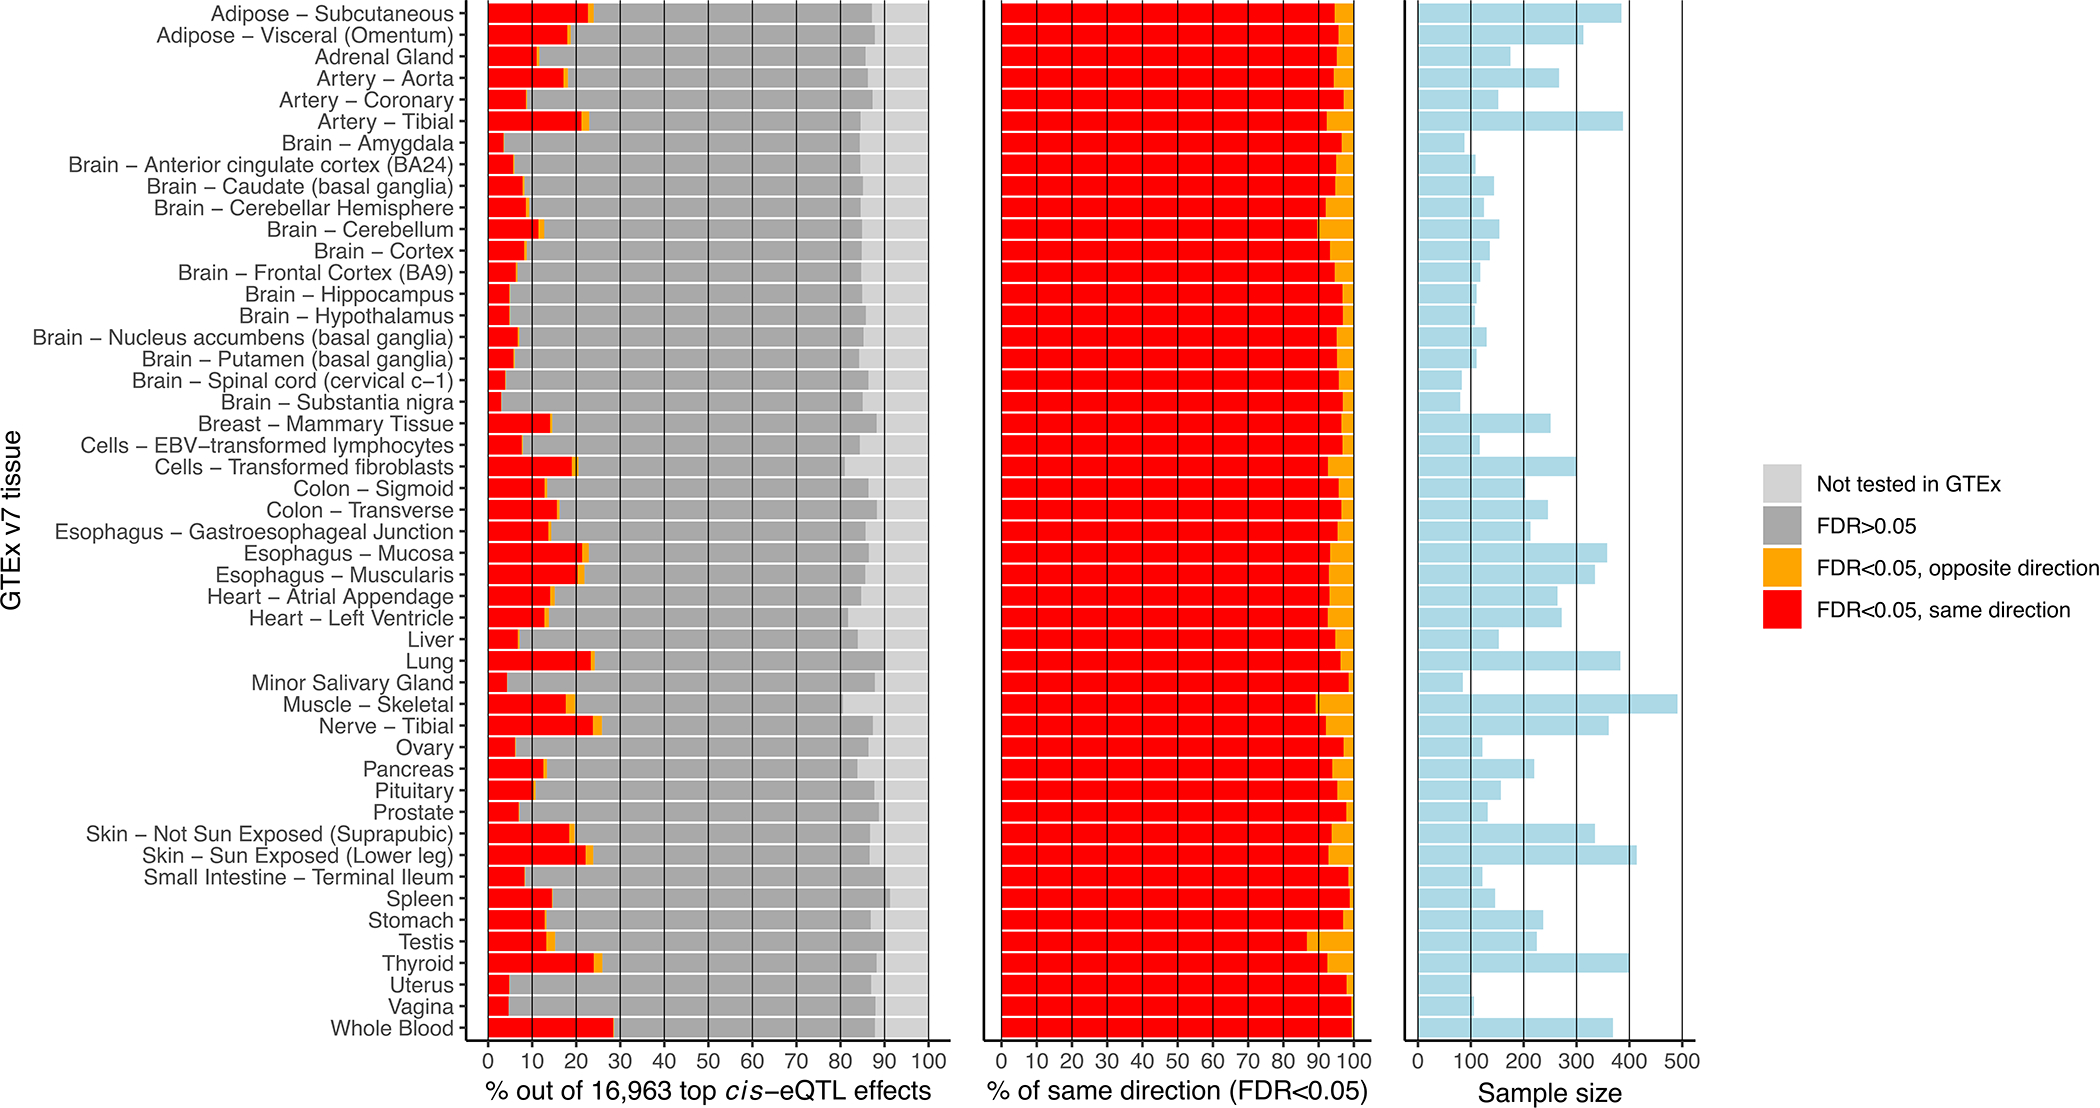
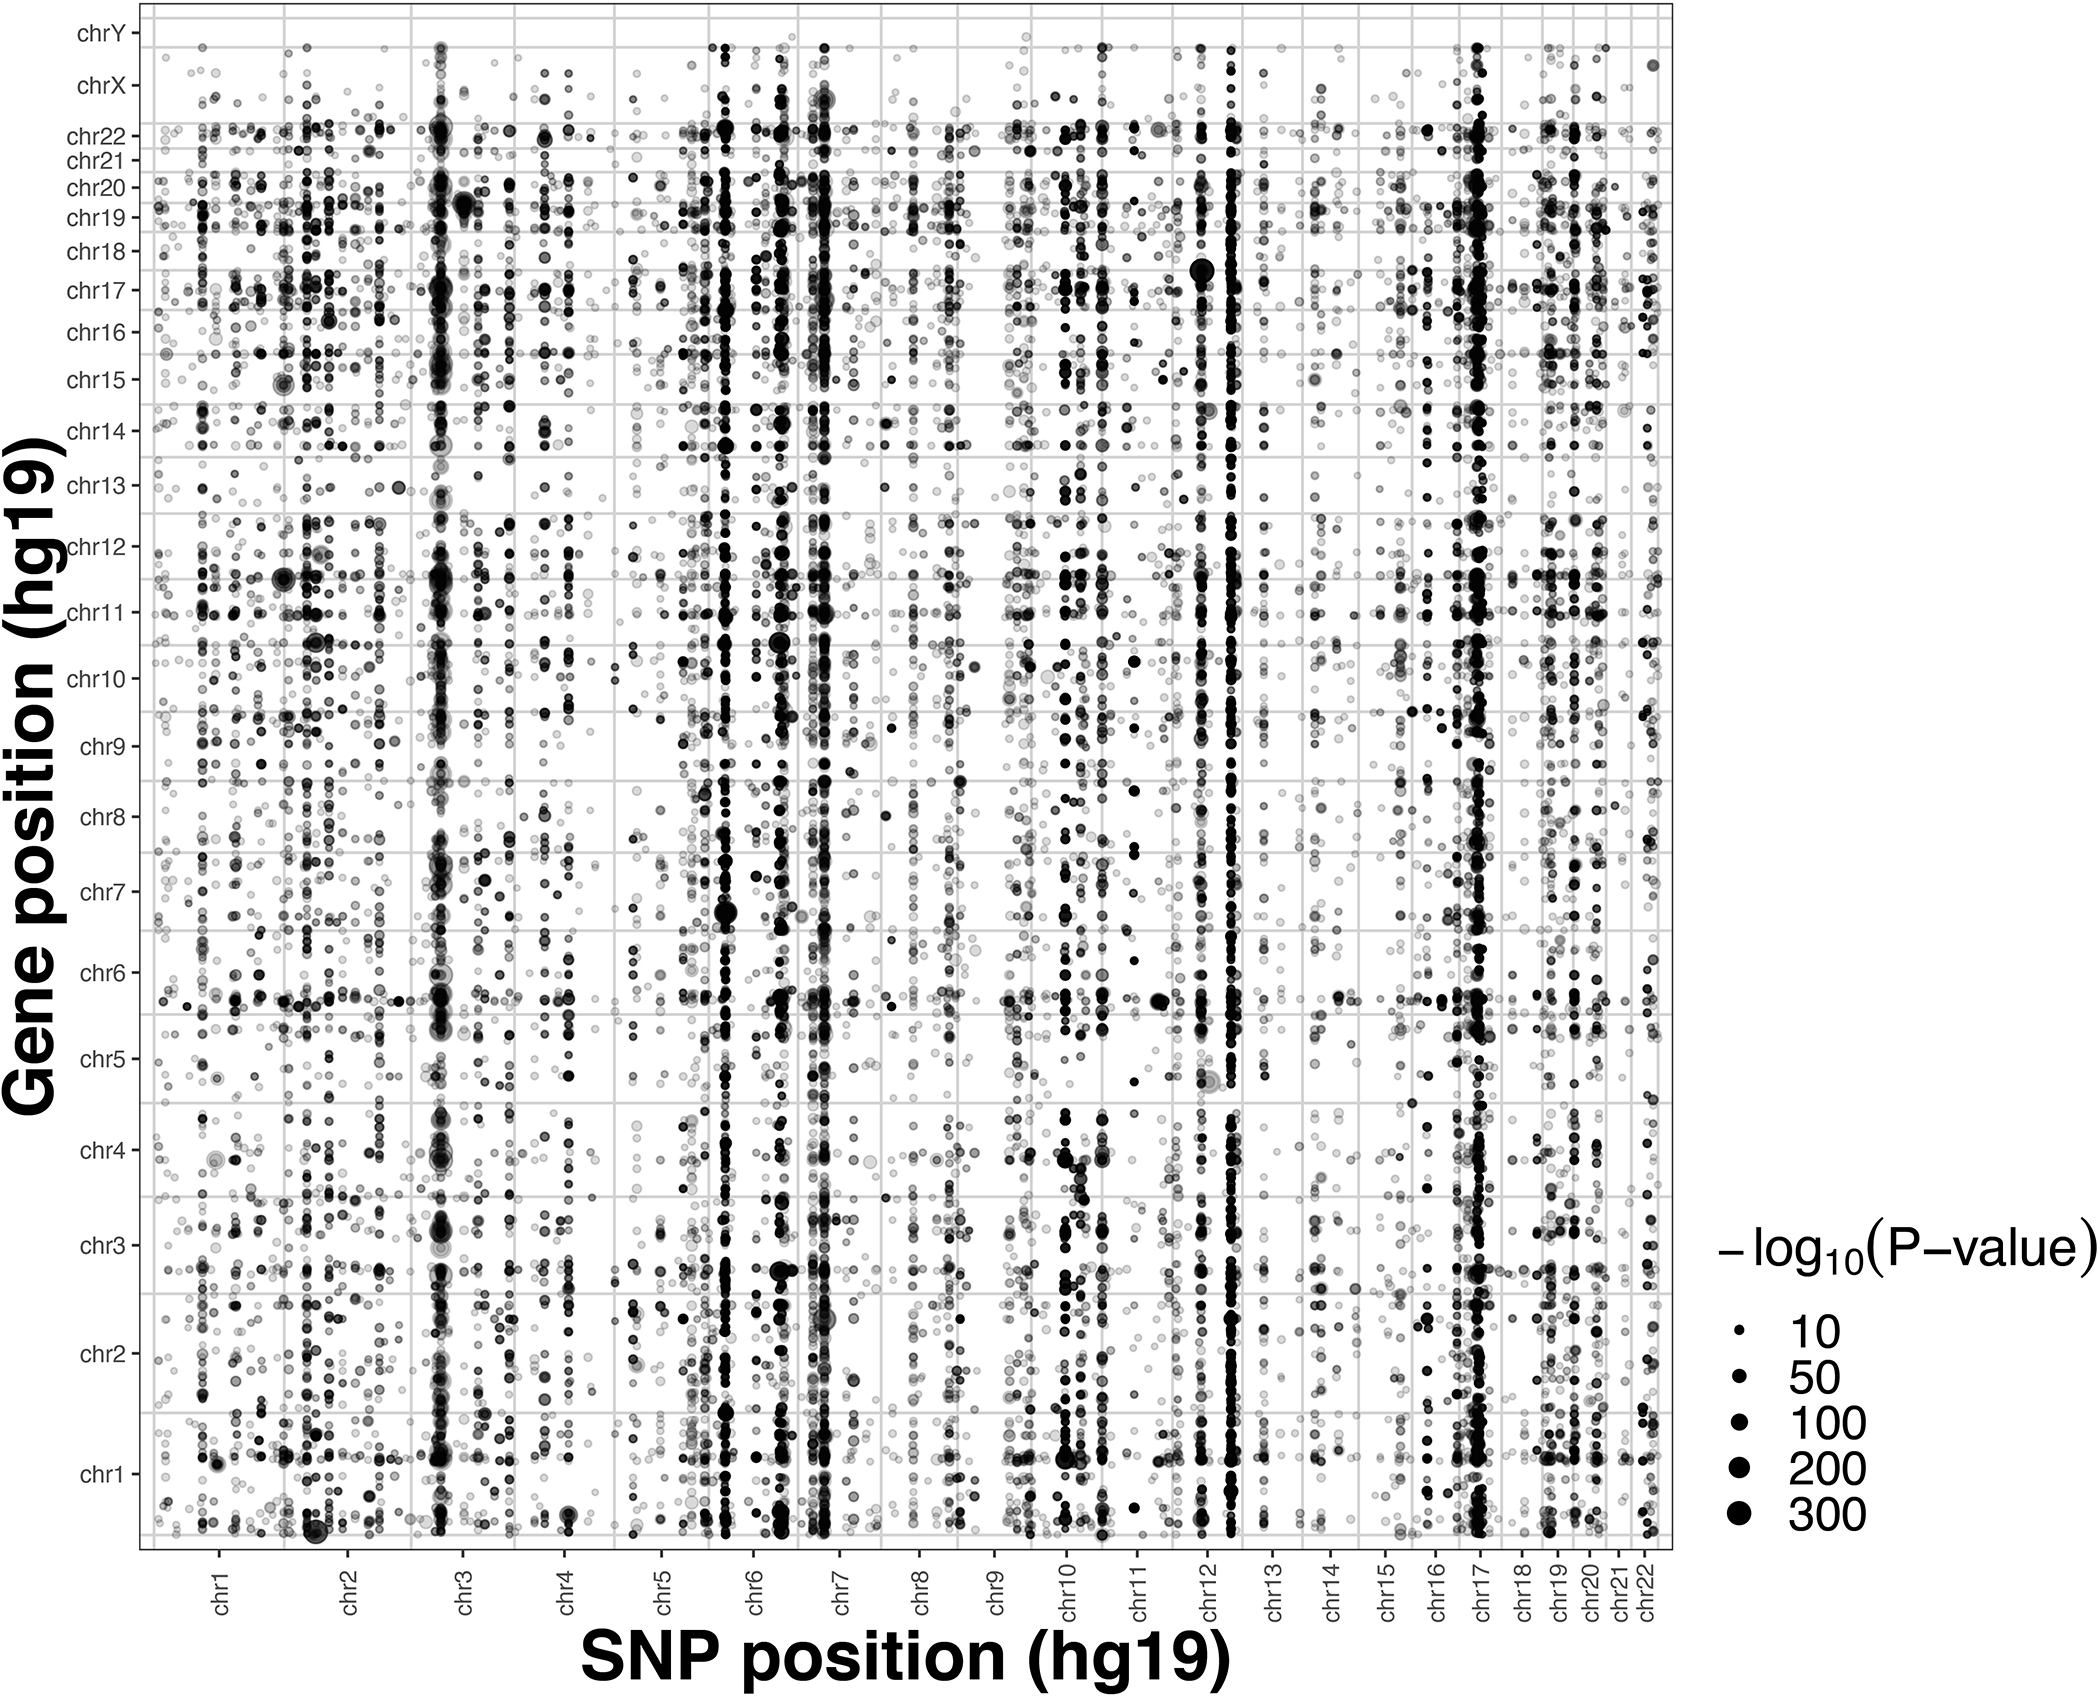
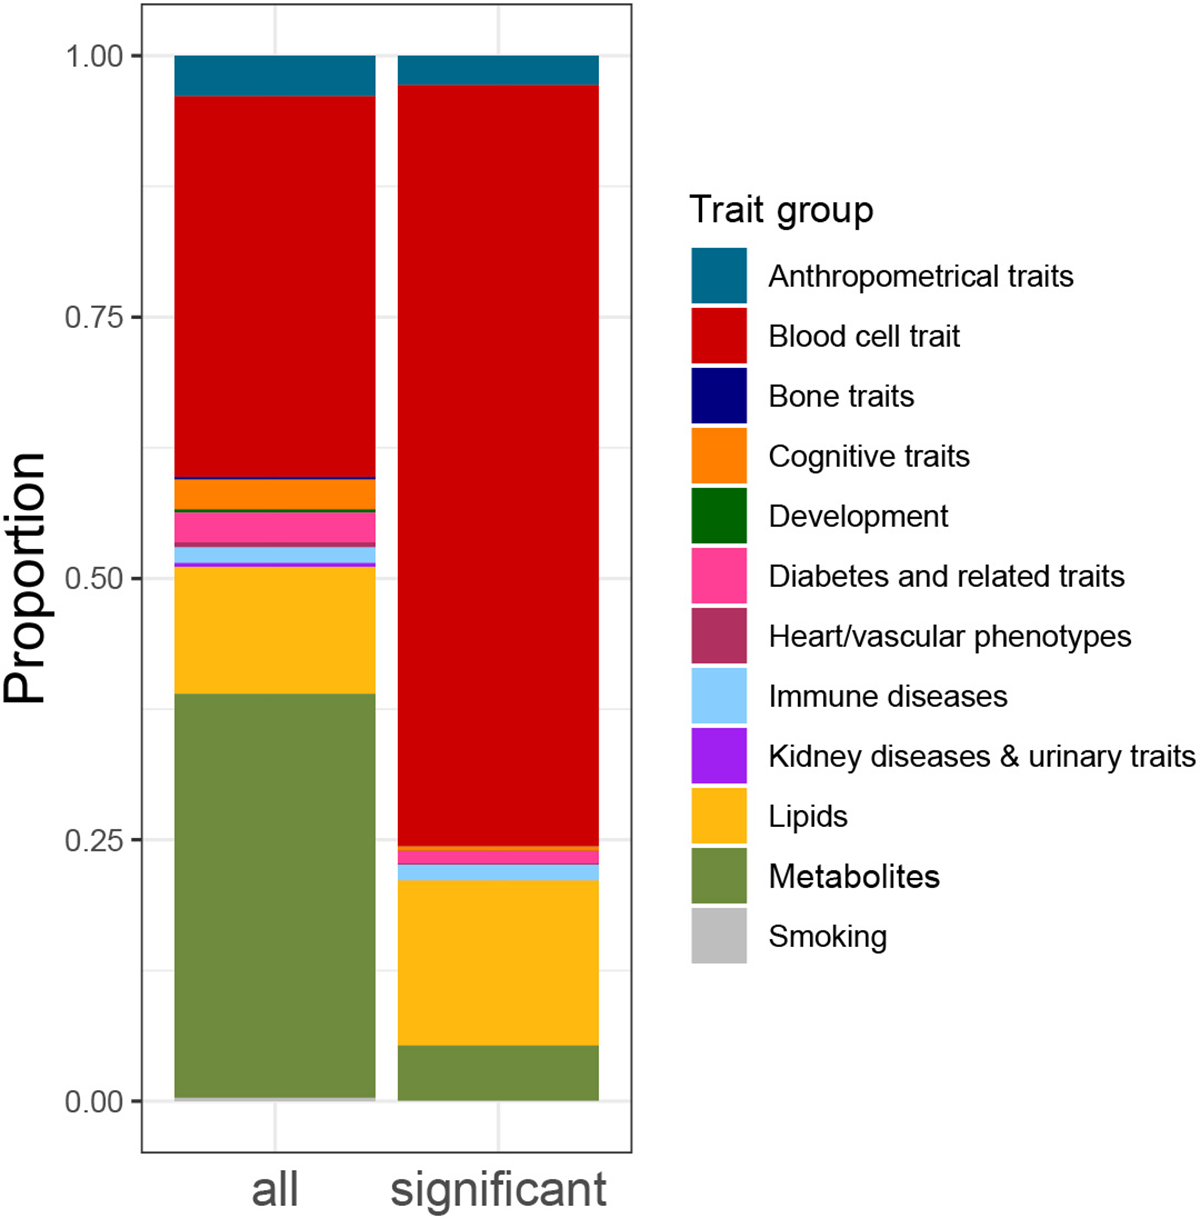
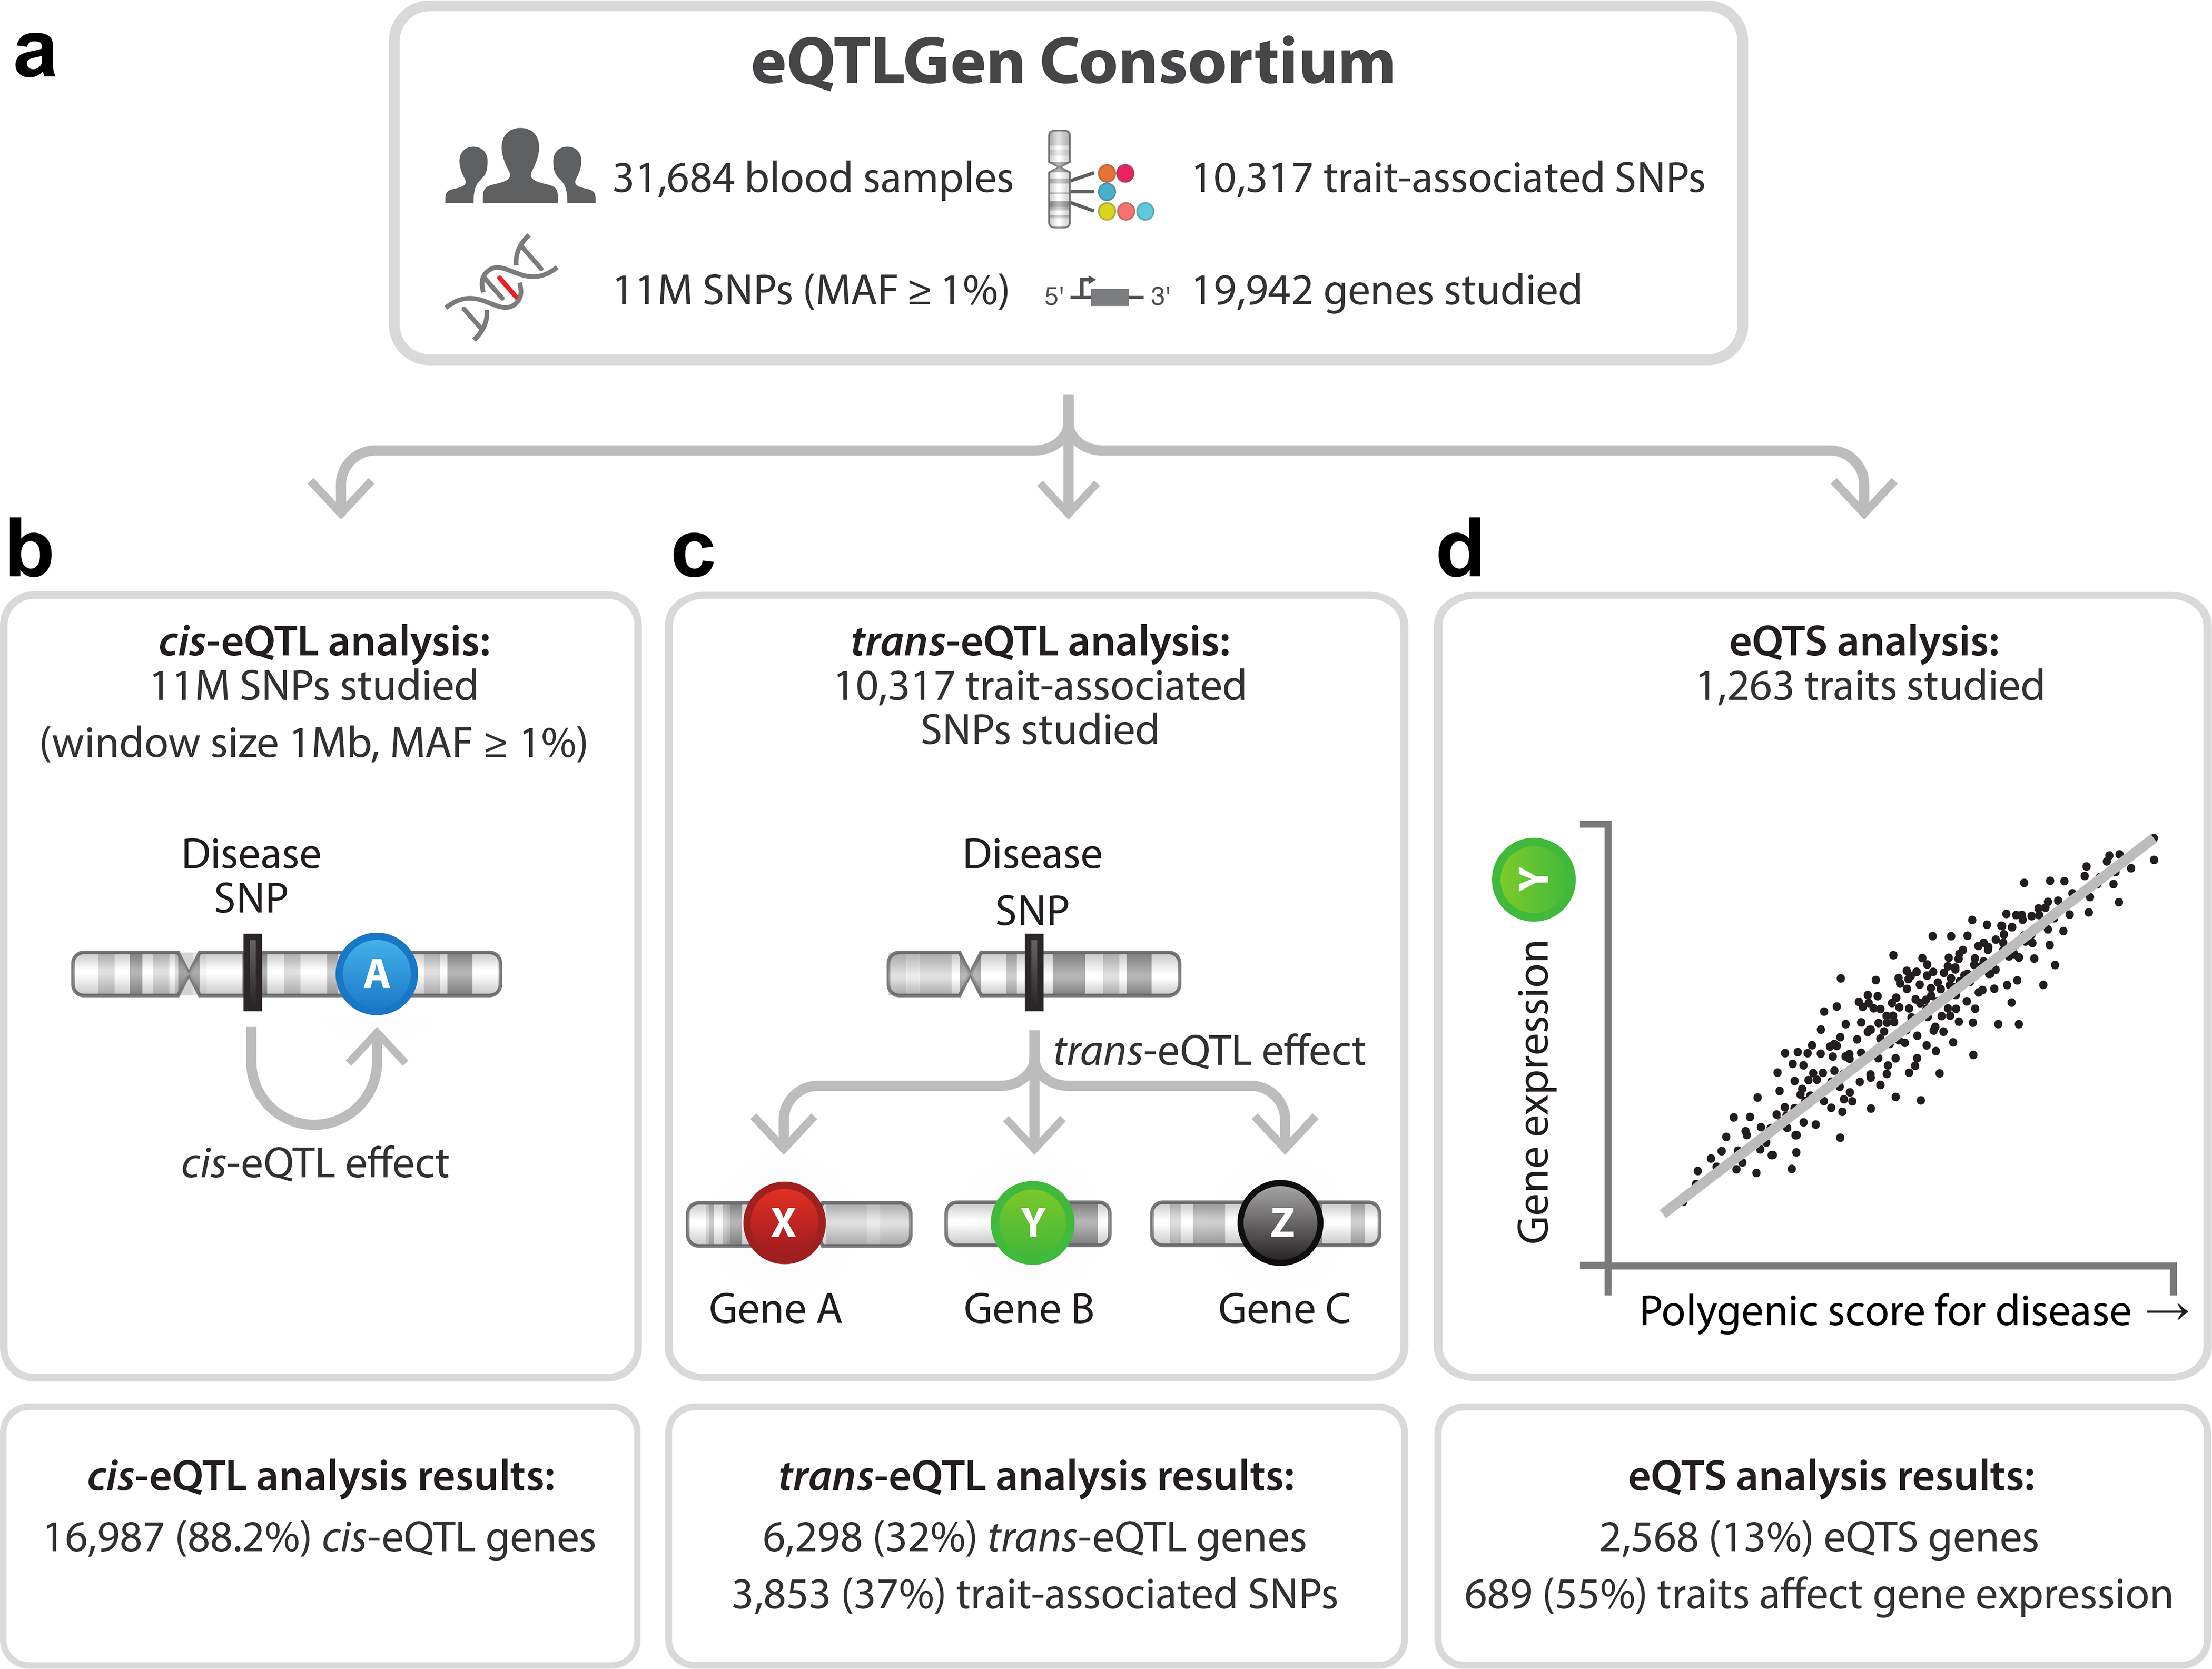
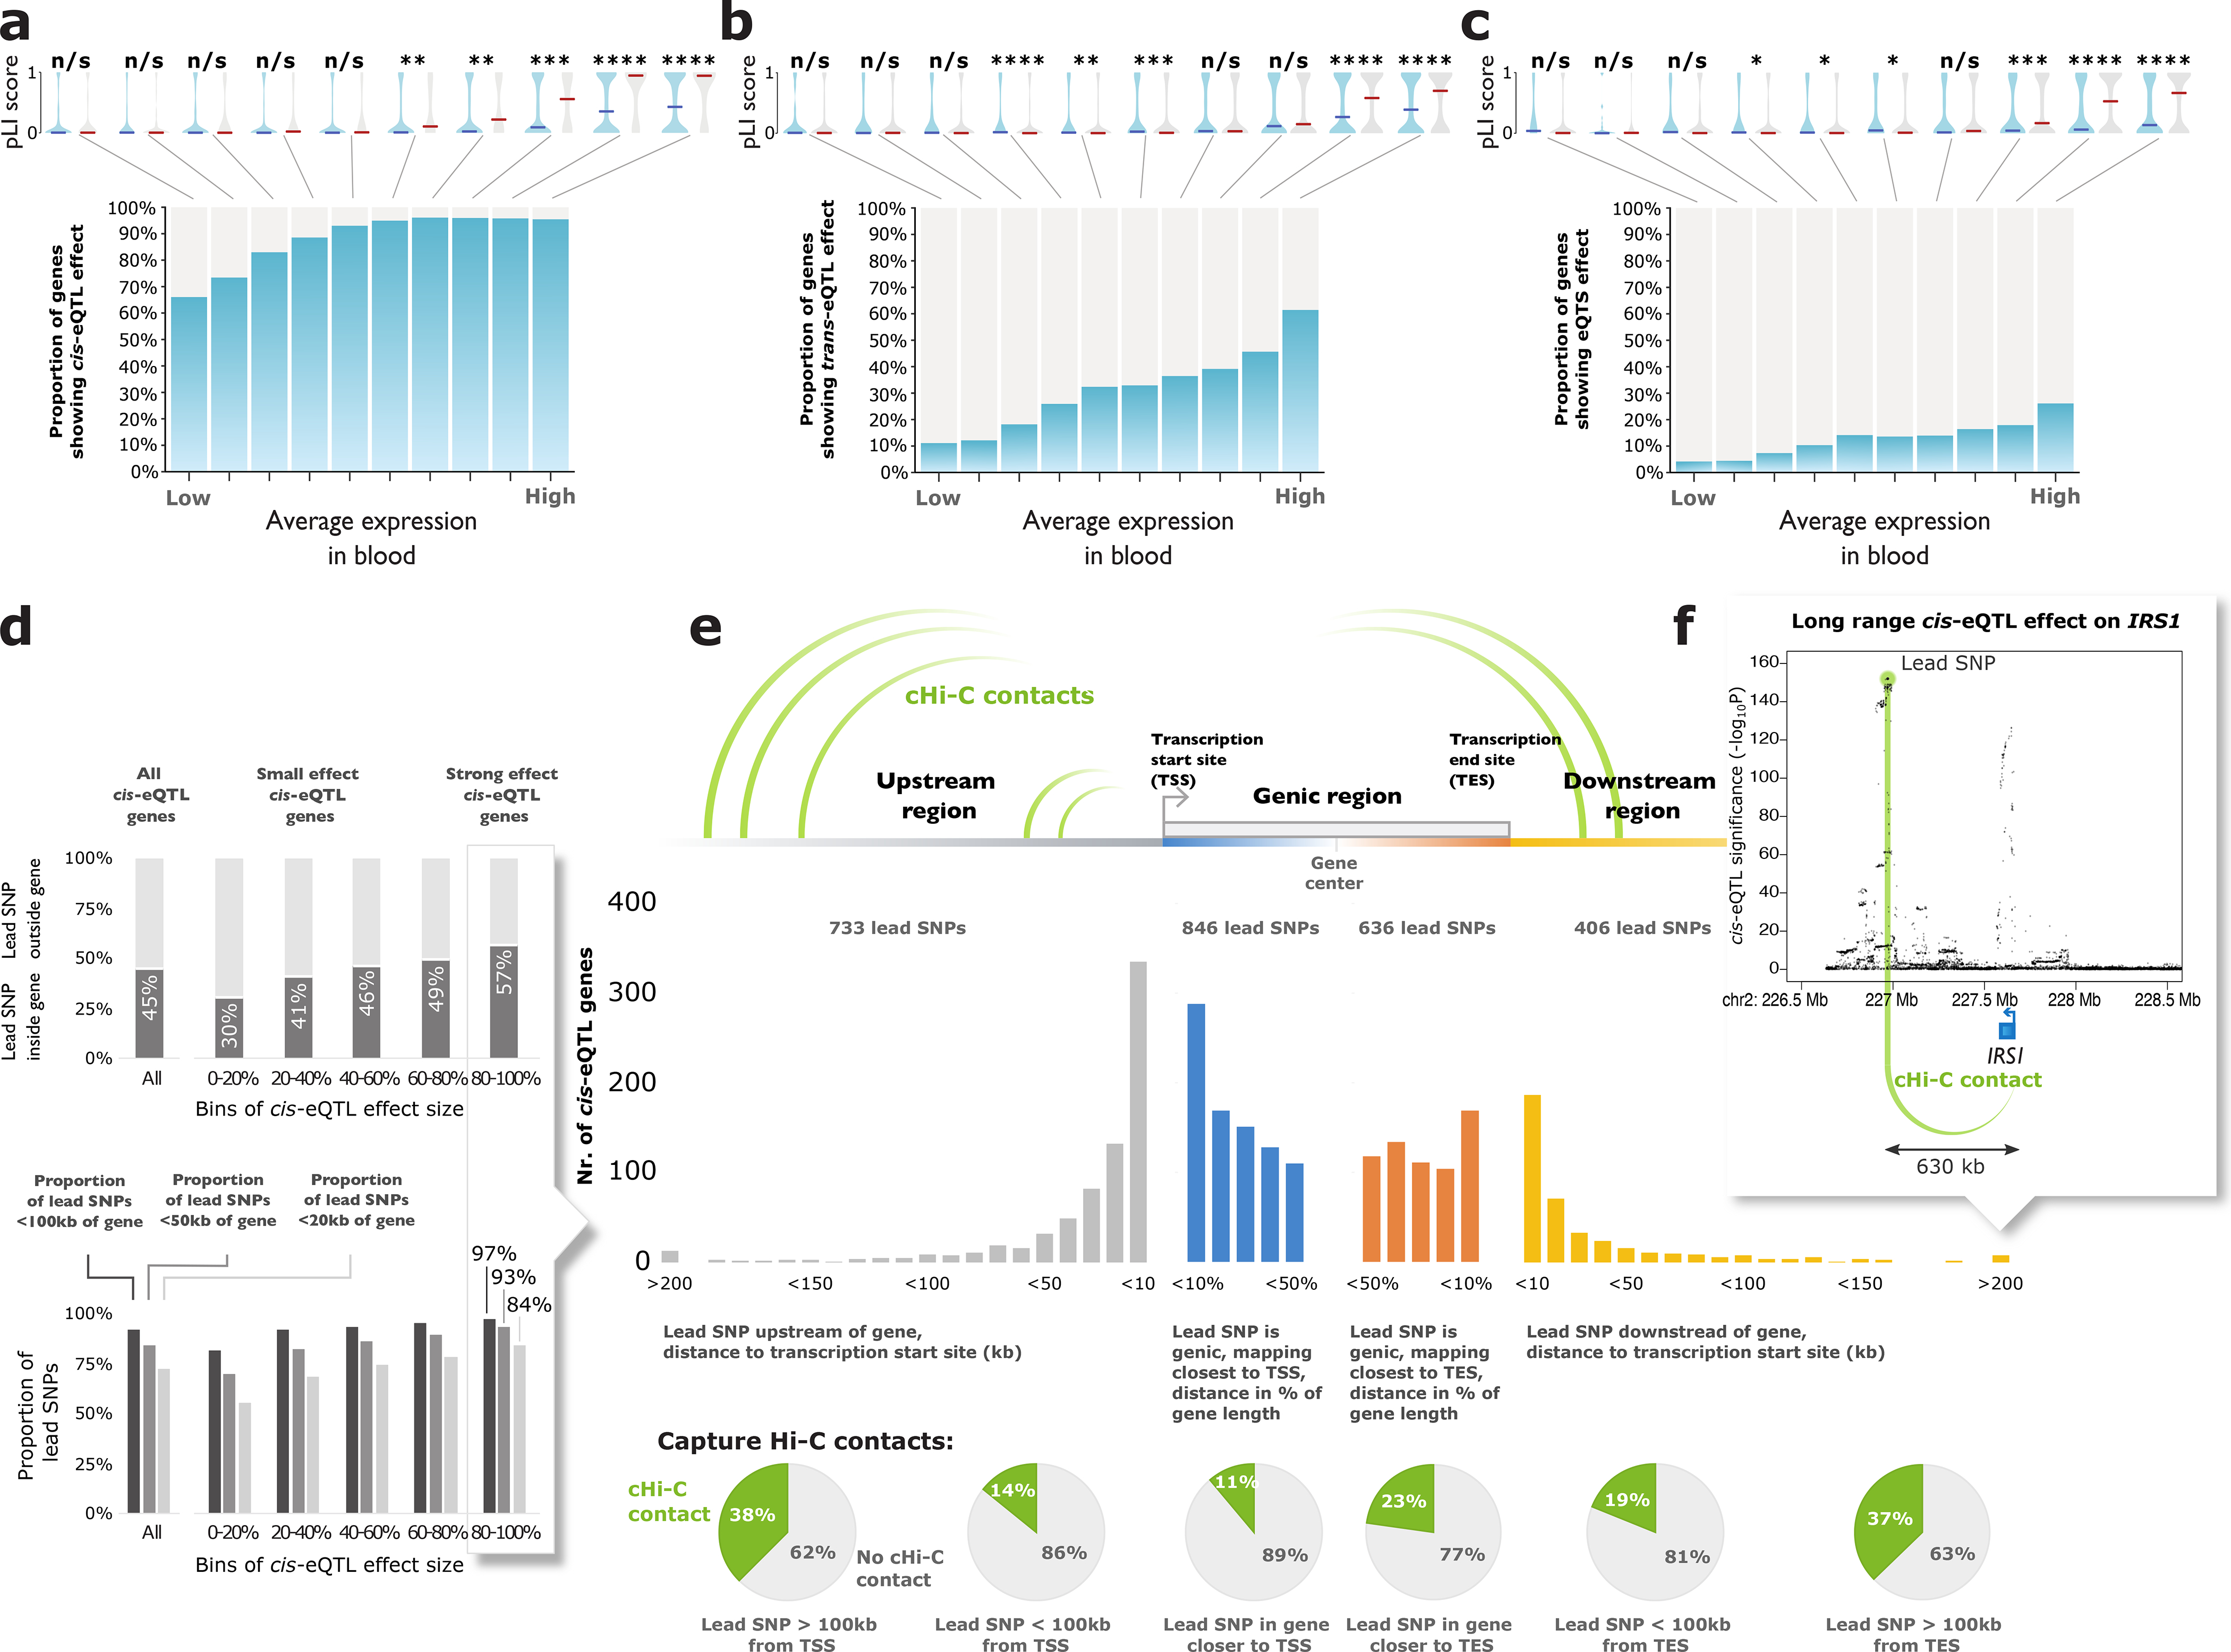
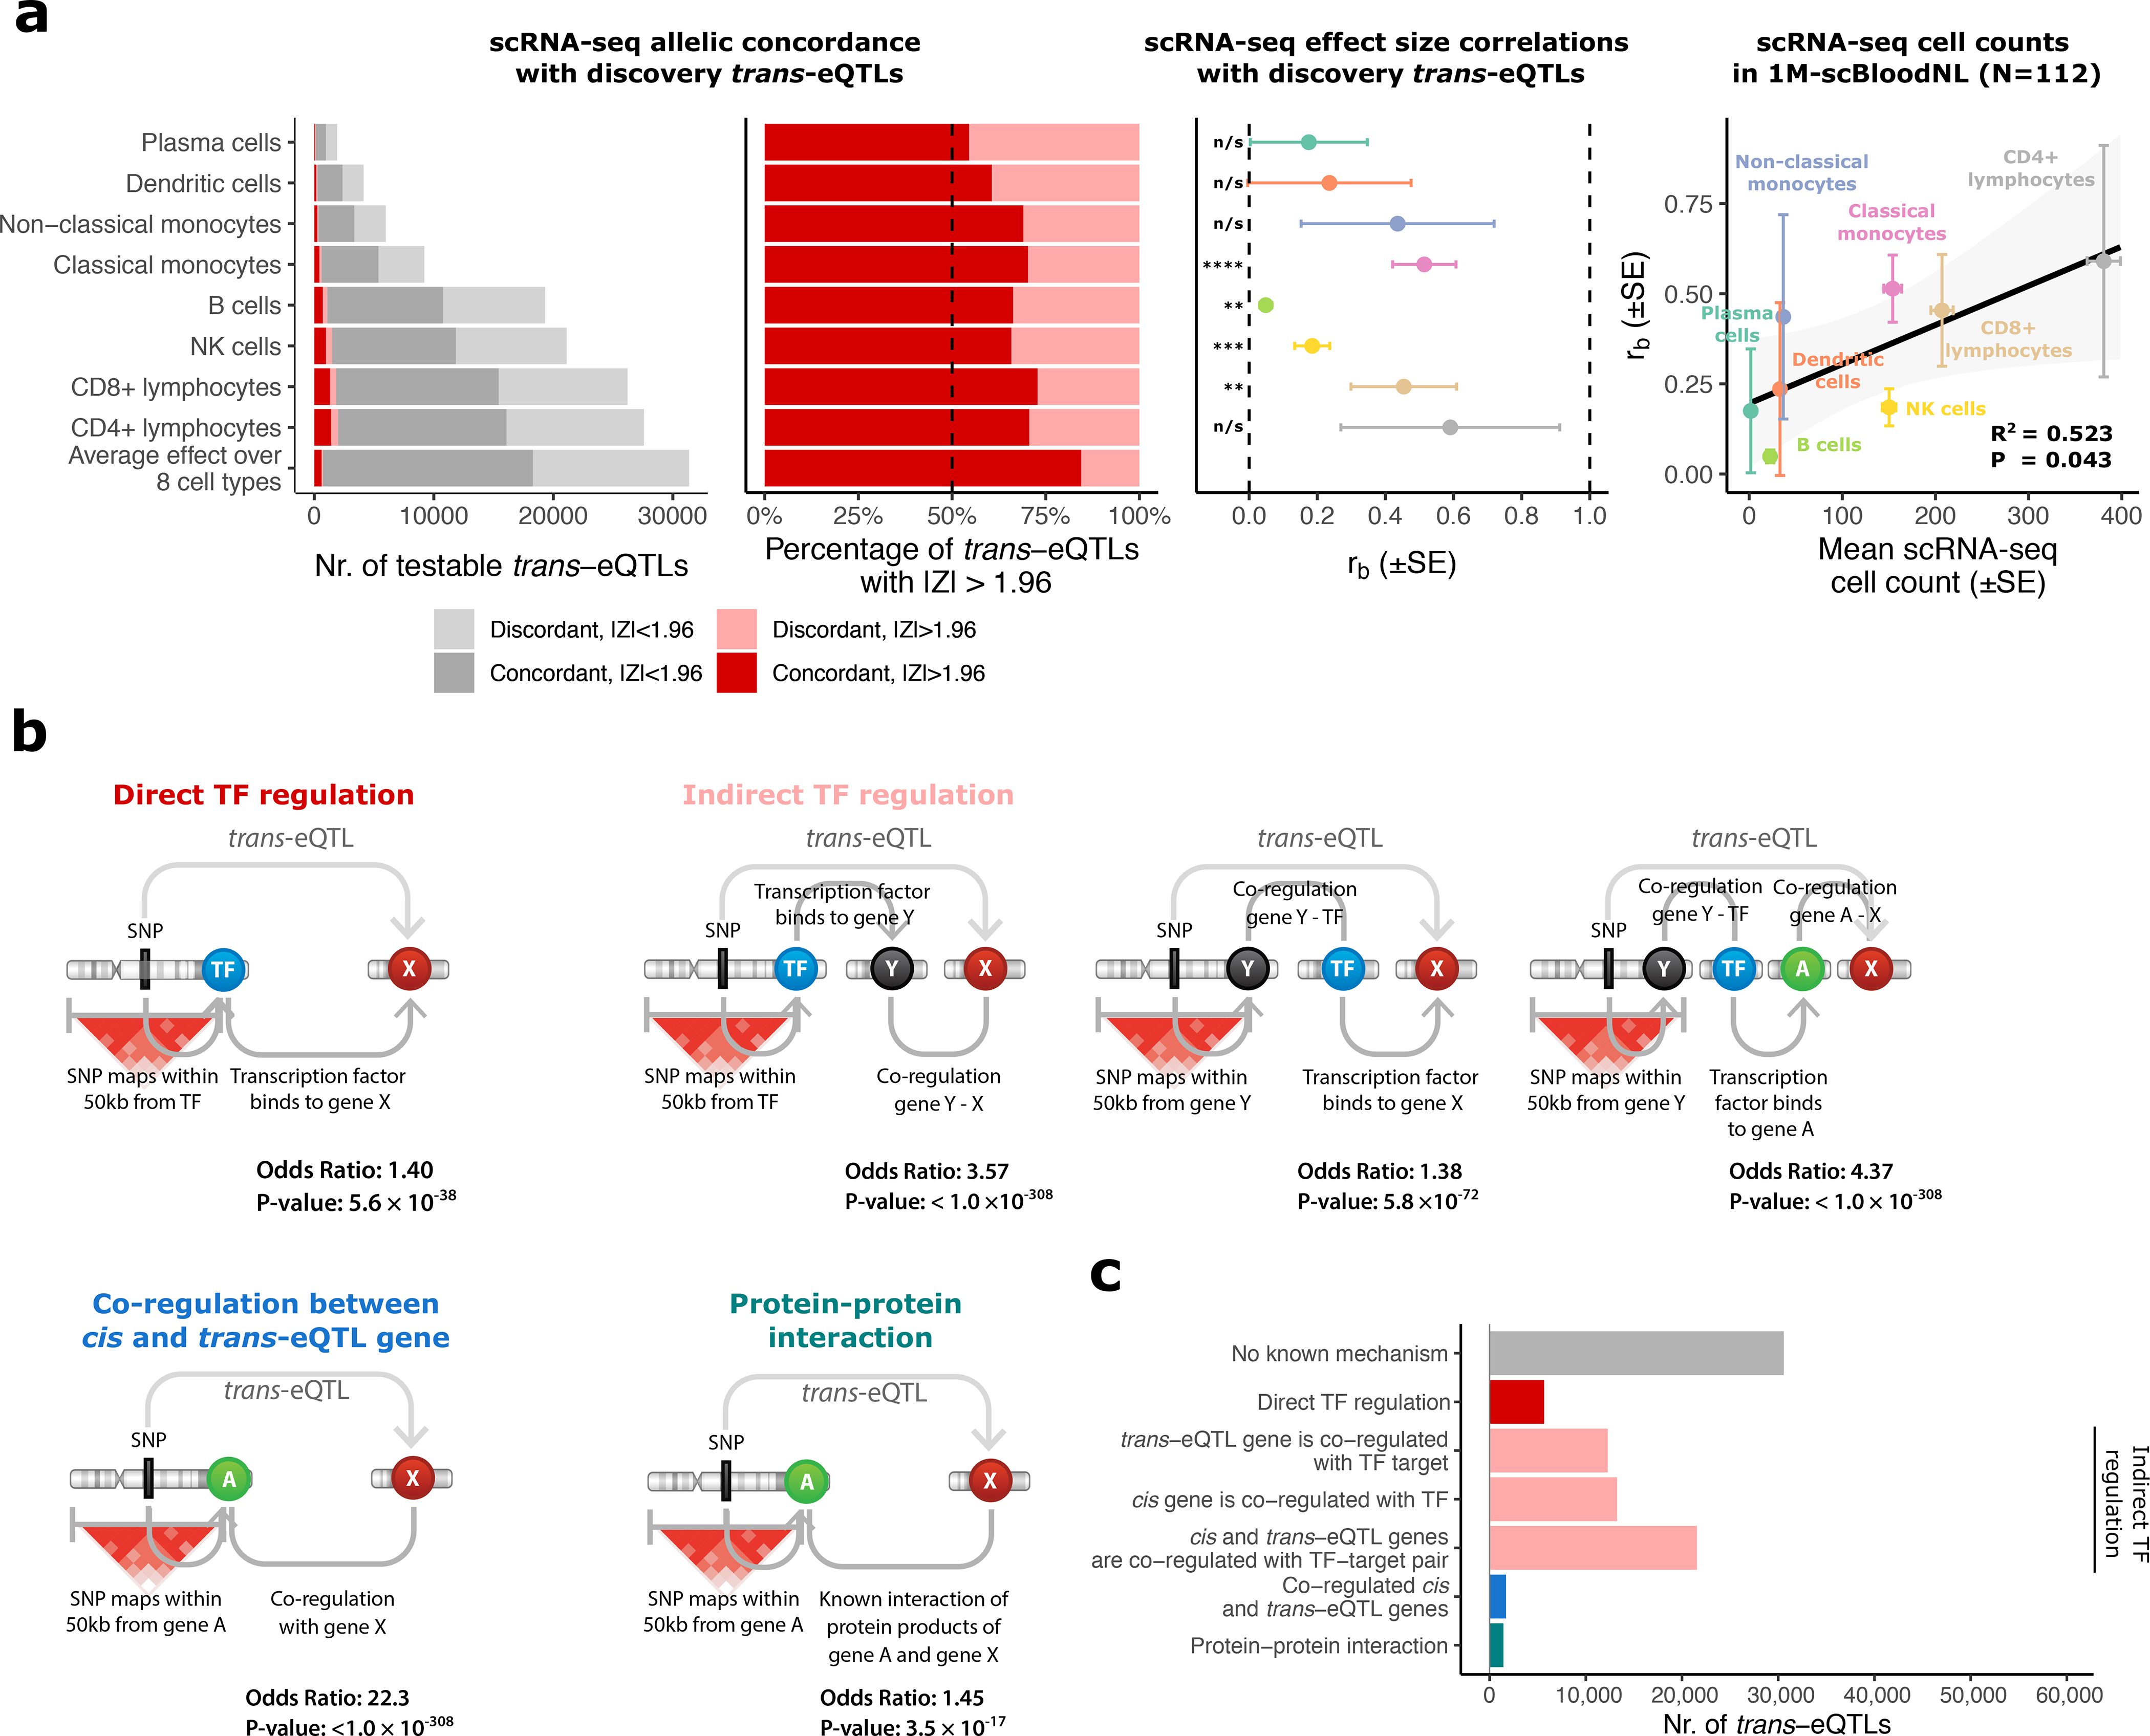
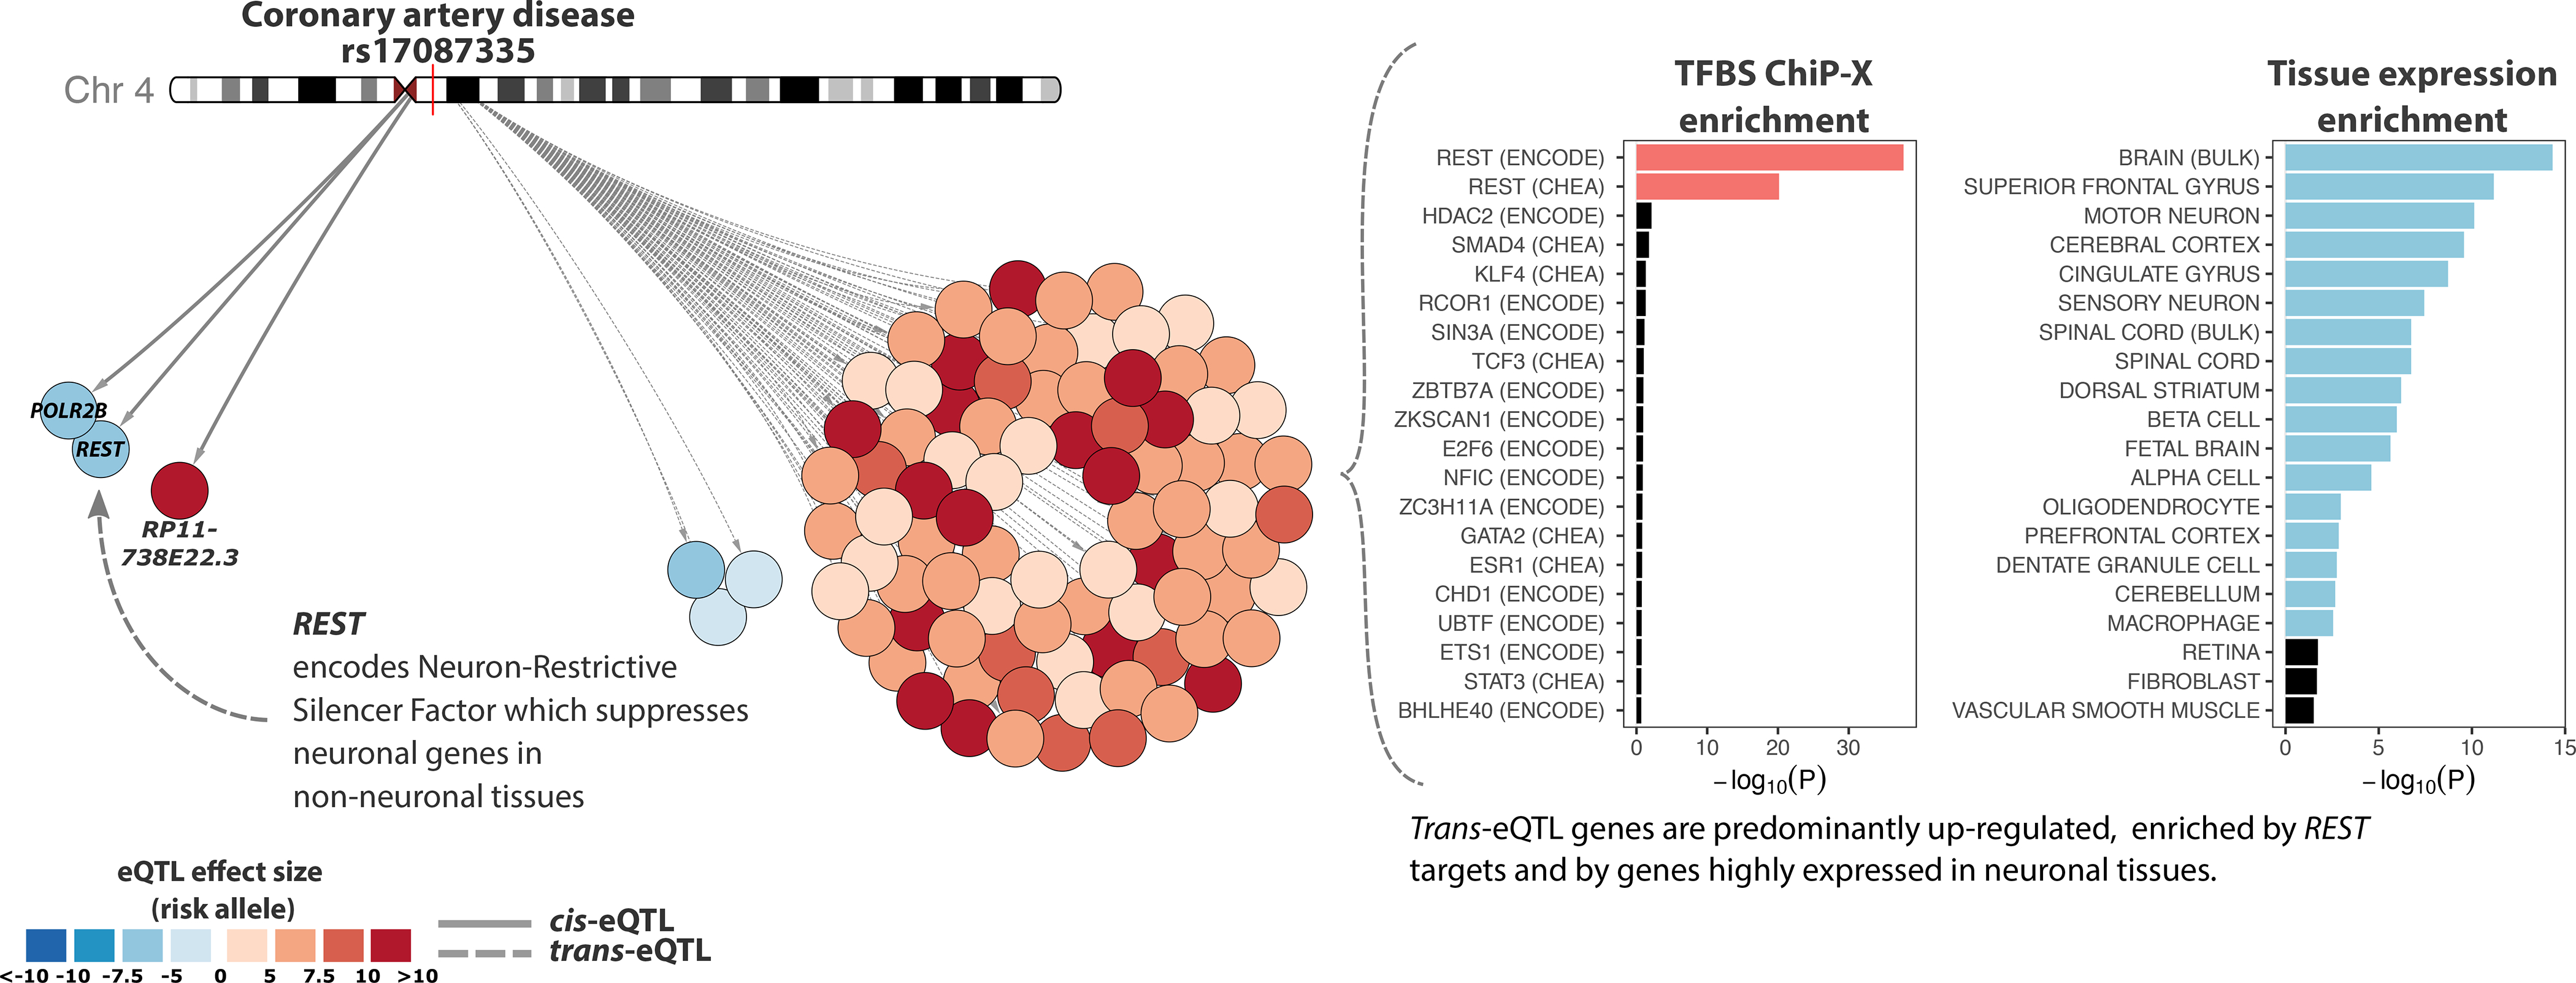
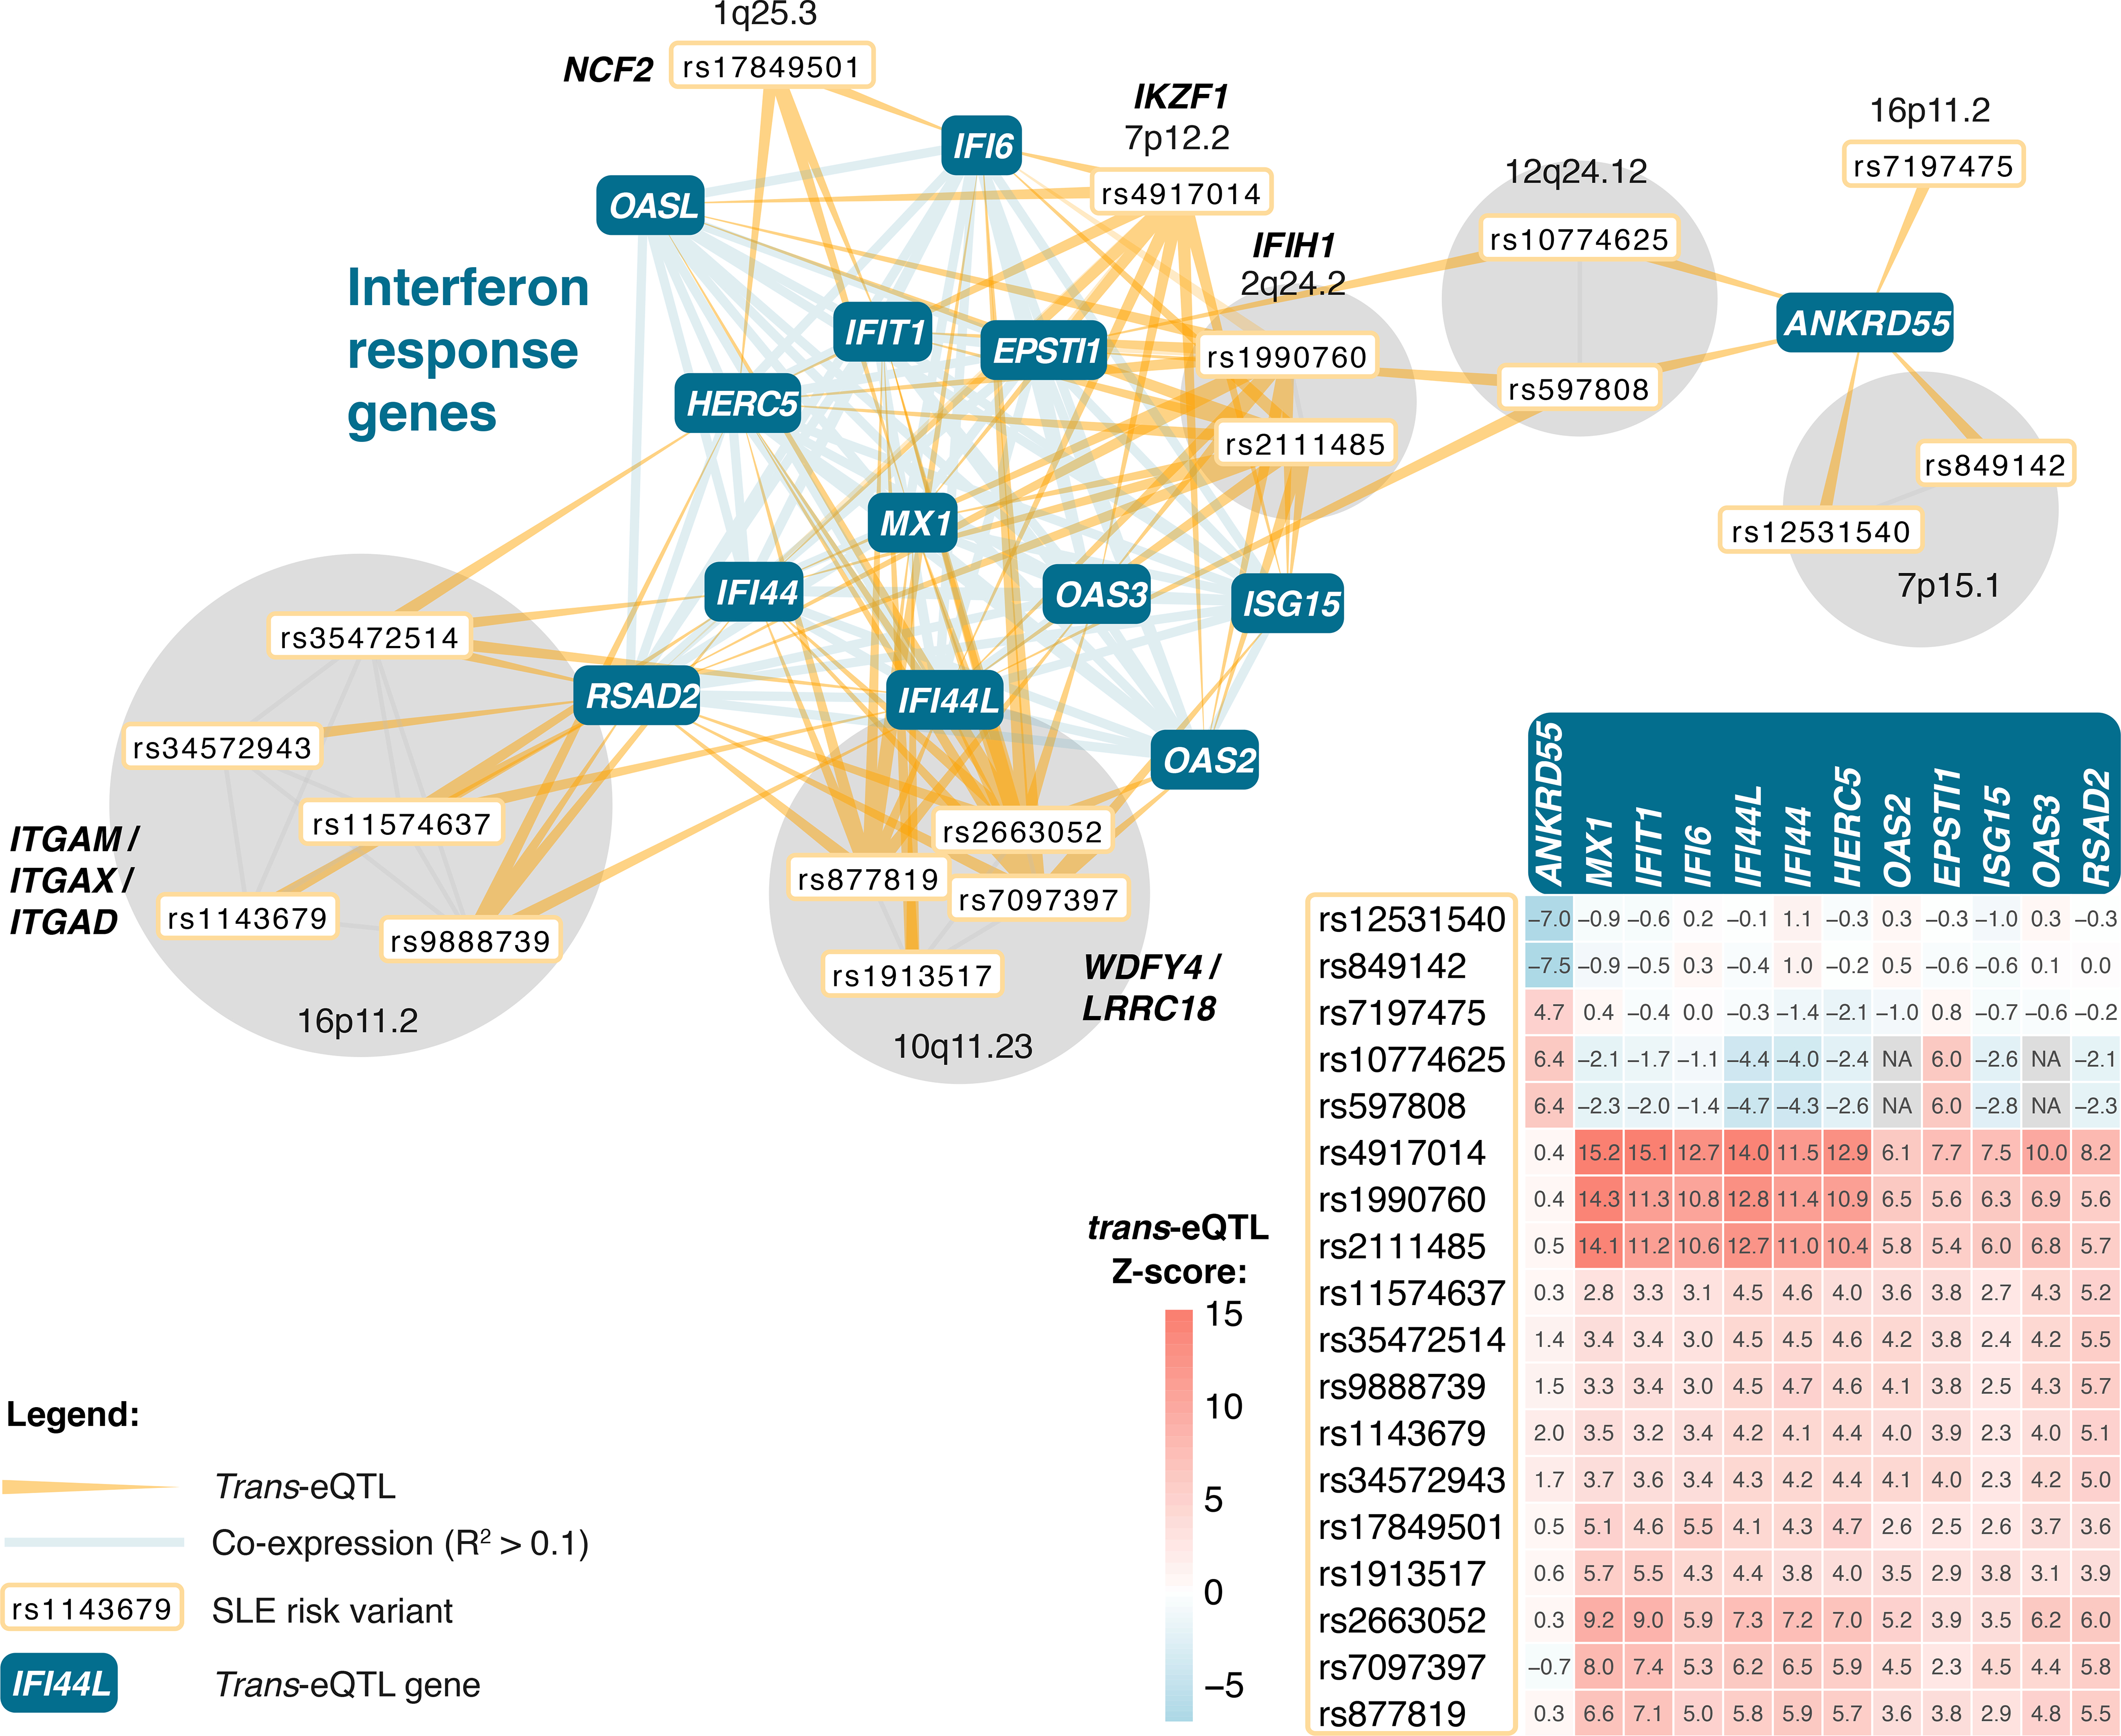
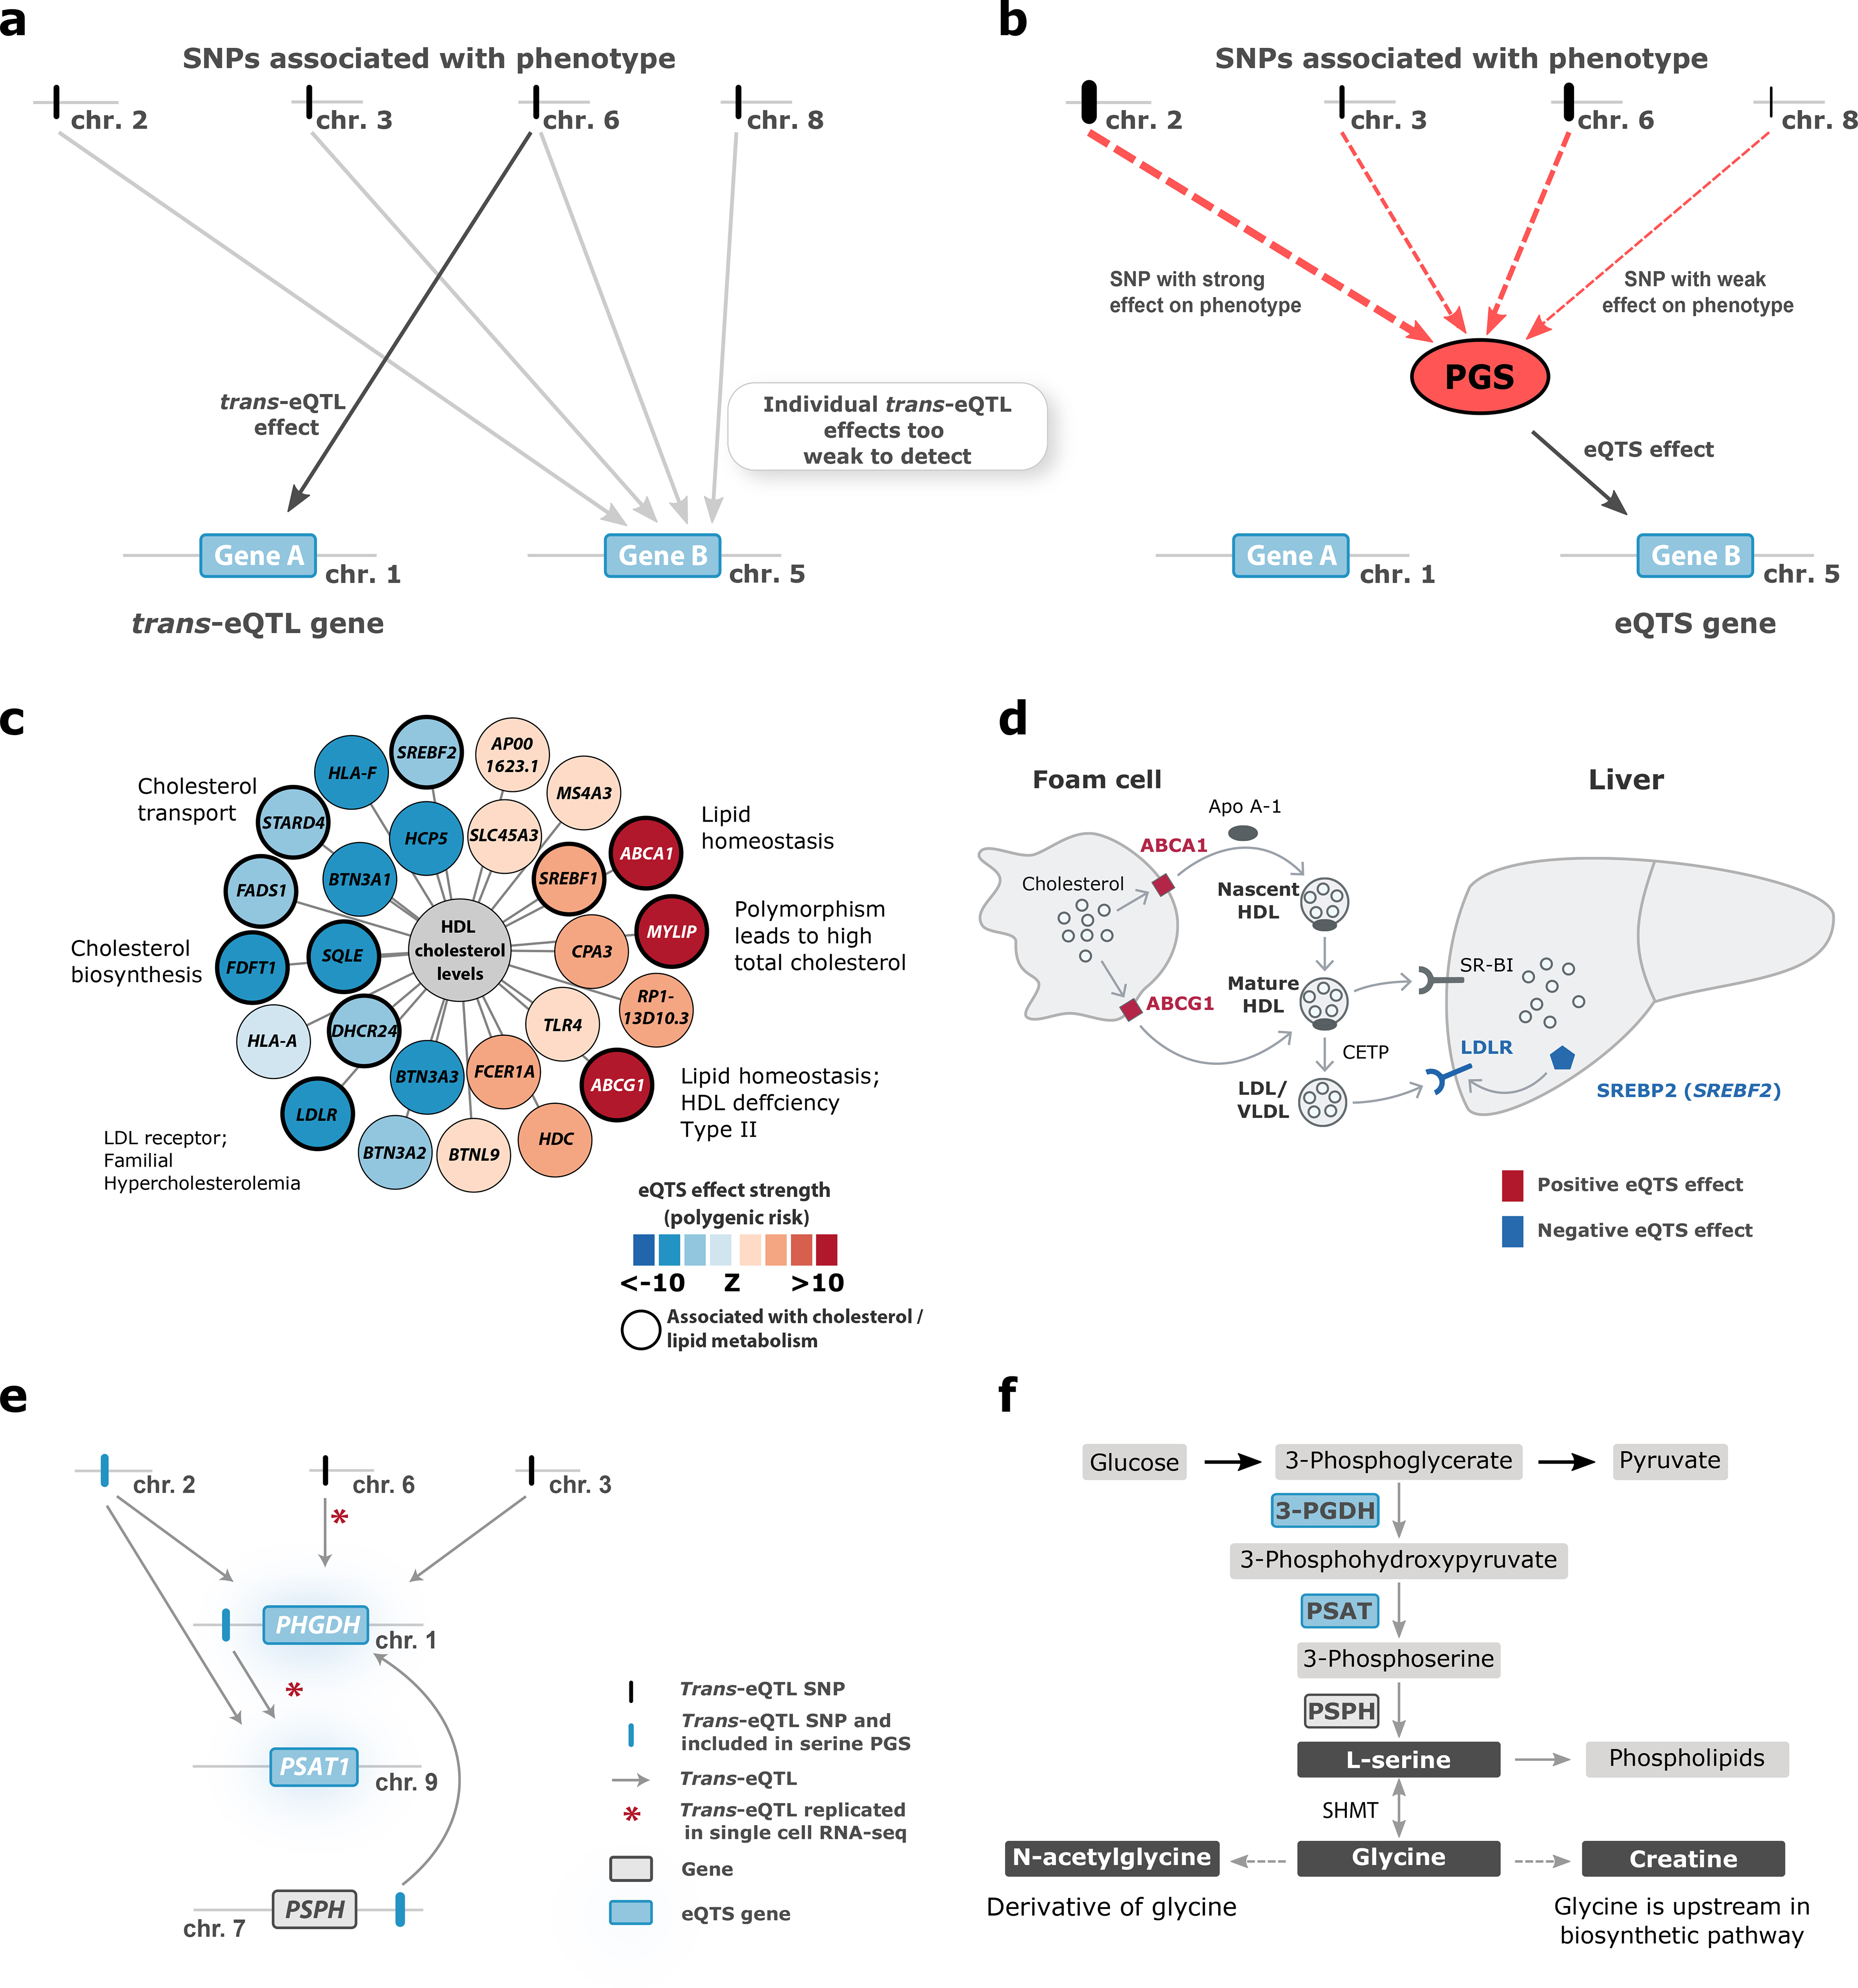
Trait-associated genetic variants affect complex phenotypes primarily via regulatory mechanisms on the transcriptome. To investigate the genetics of gene expression, we performed cis- and trans-expression quantitative trait locus (eQTL) analyses using blood-derived expression from 31,684 individuals through the eQTLGen Consortium. We detected cis-eQTL for 88% of genes, and these were replicable in numerous tissues. Distal trans-eQTL (detected for 37% of 10,317 trait-associated variants tested) showed lower replication rates, partially due to low replication power and confounding by cell type composition. However, replication analyses in single-cell RNA-seq data prioritized intracellular trans-eQTL. Trans-eQTL exerted their effects via several mechanisms, primarily through regulation by transcription factors. Expression of 13% of the genes correlated with polygenic scores for 1,263 phenotypes, pinpointing potential drivers for those traits. In summary, this work represents a large eQTL resource, and its results serve as a starting point for in-depth interpretation of complex phenotypes.


Figures

Extended Data Fig. 1
Extended Data Fig. 1. Cis-eQTL replication in GTEx v7 tissues.
Cis-eQTL replication in GTEx v7 tissues. For this analysis, the most significant cis-eQTL SNP for each gene was tested in the available post-mortem tissues in GTEx v7. Since GTEx was part of our discovery meta-analysis, the cis-eQTL discovery analysis was repeated while excluding GTEx whole blood, identifying 16,963 lead cis-eQTL effects that were subsequently replicated in each GTEx tissue. Left: while the majority of the 16,963 cis-eQTLs were tested in the GTEx replication study, a relatively small fraction had an FDR<0.05. Middle: of those ciseQTLs showing a replication FDR<0.05, allelic directions were highly consistent with the discovery meta-analysis. Right: sample sizes of GTEx tissues. Limited replication rates at FDR<0.05 were probably due to the relatively small sample size per GTEx tissue.
Extended Data Fig. 2
Extended Data Fig. 2. Dot-plot showing the locations of the trans-eQTL effects identified in discovery meta-analysis and their association P-values (-log10 scale).
Dot-plot showing the locations of the trans-eQTL effects identified in discovery meta-analysis (weighted Z-score meta-analysis on Spearman correlation) and their respective two-sided association P-values in -log10 scale. SNP positions are shown on the x-axis and gene locations on the y-axis, each dot shows one significant trans-eQTL effect (FDR<0.05). Vertical bands appear where a single genomic locus affects many genes in trans, while horizontal bands illustrate genes affected by many SNPs.
Extended Data Fig. 3
Extended Data Fig. 3. Overview of tested and significant (FDR<0.05) GWAS trait classes in eQTS analysis.
Overview of tested and significant (FDR<0.05) GWAS trait classes in eQTS analysis.
Figure 1.
Figure 1.. Overview of the study.
Overview of discovery analyses and their results.
Figure 2.
Figure 2.. Results of the cis- and trans-eQTL analysis.
All genes tested in (a) cis-eQTL analysis, (b) trans-eQTL analysis, and (c) eQTS analysis were divided into 10 bins based on their average expression levels in blood (BIOS Cohort). Highly expressed genes without any eQTL effect (grey bars) were less tolerant to loss-of-function variants (two-sided Wilcoxon rank sum test on pLI scores). Indicated are median pLIs per bin. n/s (not significant) P>0.05; * P<0.05; ** P<0.01; *** P<0.001; **** P<1×10⁻⁴. (d) Genes with strong effect sizes are more likely to have a lead SNP located within (top panel) or close to the gene (bottom panel) (e) Lead cis-eQTL SNPs overlap capture Hi-C contacts with transcription start sites (TSS). (f) Example of IRS1 locus.
Figure 3.
Figure 3.. Trans-eQTL replication in scRNA-seq and mechanisms leading to trans-eQTLs.
(a) Replication analyses in scRNA-seq of 8 cell types in up to 1,139 individuals. Left panels: allelic concordances relative to trans-eQTL effect direction in the discovery trans-eQTL analysis. Middle panel: correlation estimates (rb) of trans-eQTL effects between the discovery analysis in blood and scRNA-seq blood cell types and corresponding two-sided P-values (Methods). n/s P>0.05; * P<0.05; ** P<0.01; *** P<0.001; **** P<1×10⁻⁴. Error bars indicate the standard error (SE) for rb. Right panel: correlation between cell type counts (mean over the subset of samples from 1M-scBloodNL cohort; N=112) and rb estimates. Shown are the squared Pearson correlation coefficient and the two-sided P-value from the Pearson correlation test. Error bars indicate SE for rb and standard error of the mean (SEM) for the cell counts. (b) Enrichment analyses for TF binding, gene co-regulation and protein–protein interactions (PPIs). Cis-acting genes were determined by cis-eQTLs or assigned by the Pascal method (Methods, Supplementary Note). Shown are odds ratio and two-sided P-value from Fisher’s exact test. (c) All 59,786 trans-eQTLs stratified by putative mechanism of action. Hi-C enrichment results are not shown as we only observed enrichment when using a lenient threshold for Hi-C contacts (>0 value for contact). Full results are shown in Supplementary Figure 9.
Figure 4.
Figure 4.. REST locus regulates the expression of 88 trans-eQTL genes.
Left, overview of the cis- and trans-eQTL effects for coronary artery disease associated rs17087335. Color of the nodes indicates the trans-eQTL effect direction and size, relative to risk allele. Right, trans-eQTL genes for the REST locus are highly enriched for REST transcription factor targets (TF binding data from ENCODE, and ChEA) and for the expression of brain-related genes. For each TF and tissue, the length of the bar indicates -log10(P-value) from one-sided Fisher’s exact test (Methods). Twenty most significant effects are visualized.
Figure 5.
Figure 5.. SNPs associated with systemic lupus erythematosus (SLE) converge on a shared cluster of interferon-response genes.
The genes shown are those affected by at least three independent GWAS SNPs. SNPs in the HLA region are not visualized and SNPs in partial linkage disequilibrium are grouped together. The heatmap indicates the direction and strength of individual trans-eQTL effects (Z-scores), relative to the SLE risk allele.
Figure 6.
Figure 6.. eQTS analyses.
(a) In trans-eQTL analysis, individual SNPs are associated with gene expression. (b) In eQTS analysis, the effect sizes and directions of individual trait-associated SNPs are combined into a polygenic score (PGS) that is associated with gene expression. Here, we outline the case where eQTS analysis identifies a gene not detectable in the trans-eQTL analysis. Other scenarios we observed include: Gene A also being identified by eQTS analysis, Gene B being identified by both methods, or the combined effect of PGS yielding no significant eQTS. (c) The PGS for high density lipoprotein (HDL) associates to lipid metabolism genes. (d) The role of ABCA1, ABCG1, LDLR and SREBF2 in cholesterol transport. (e) Both trans-eQTLs and the serine PGS associate with the known serine biosynthesis genes PHGDH and PSAT1. (f) Serine biosynthesis pathway.

References

References for main text

    1. Yao C et al.Dynamic Role of trans Regulation of Gene Expression in Relation to Complex Traits. American Journal of Human Genetics 100, 571–580 (2017). - PMC - PubMed
    1. O’Connor LJ et al.Extreme Polygenicity of Complex Traits Is Explained by Negative Selection. American Journal of Human Genetics 105, 456–476 (2019). - PMC - PubMed
    1. Zeng J et al.Signatures of negative selection in the genetic architecture of human complex traits. Nature Genetics 50, 746–753 (2018). - PubMed
    1. Yao DW, O’Connor LJ, Price AL & Gusev A Quantifying genetic effects on disease mediated by assayed gene expression levels. Nature Genetics 52, 626–633 (2020). - PMC - PubMed
    1. Westra HJ et al.Systematic identification of trans eQTLs as putative drivers of known disease associations. Nature Genetics 45, 1238–1243 (2013). - PMC - PubMed

Methods-only references

    1. Deelen P et al.Genotype harmonizer: Automatic strand alignment and format conversion for genotype data integration. BMC Research Notes 7, 901 (2014). - PMC - PubMed
    1. Rumble SM et al.SHRiMP: Accurate mapping of short color-space reads. PLoS Computational Biology 5, e1000386 (2009). - PMC - PubMed
    1. Purcell S et al.PLINK: A tool set for whole-genome association and population-based linkage analyses. American Journal of Human Genetics 81, 559–575 (2007). - PMC - PubMed
    1. Westra HJ et al.MixupMapper: Correcting sample mix-ups in genome-wide datasets increases power to detect small genetic effects. Bioinformatics 27, 2104–2111 (2011). - PubMed
    1. Robinson MD & Oshlack A A scaling normalization method for differential expression analysis of RNA-seq data. Genome Biology 11, R25 (2010). - PMC - PubMed

Publication types

MeSH terms