. 2020 Sep;1(9):923-934.
doi: 10.1038/s43018-020-00110-7. Epub 2020 Sep 18.

Autophagy promotes growth of tumors with high mutational burden by inhibiting a T-cell immune response

Affiliations

Autophagy promotes growth of tumors with high mutational burden by inhibiting a T-cell immune response

Laura Poillet-Perez et al. Nat Cancer. 2020 Sep.

Erratum in

Abstract

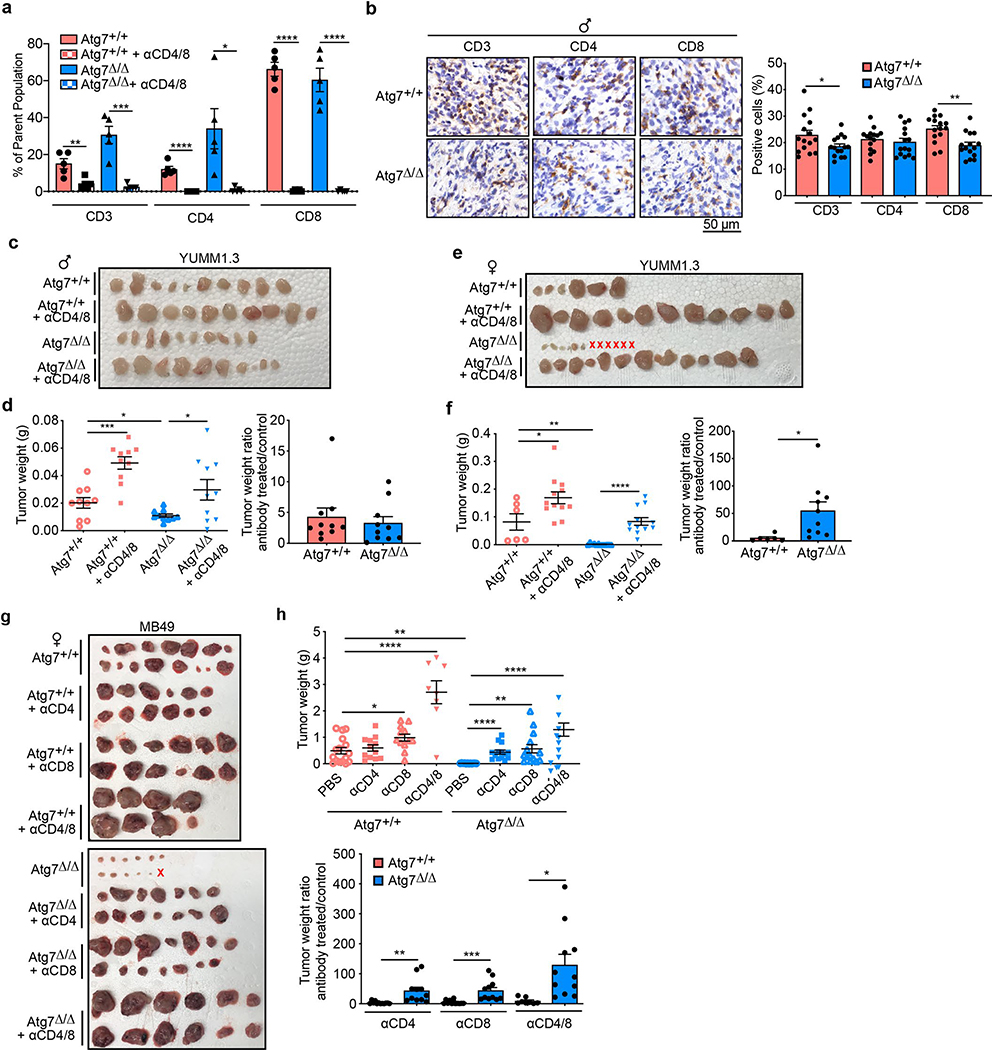
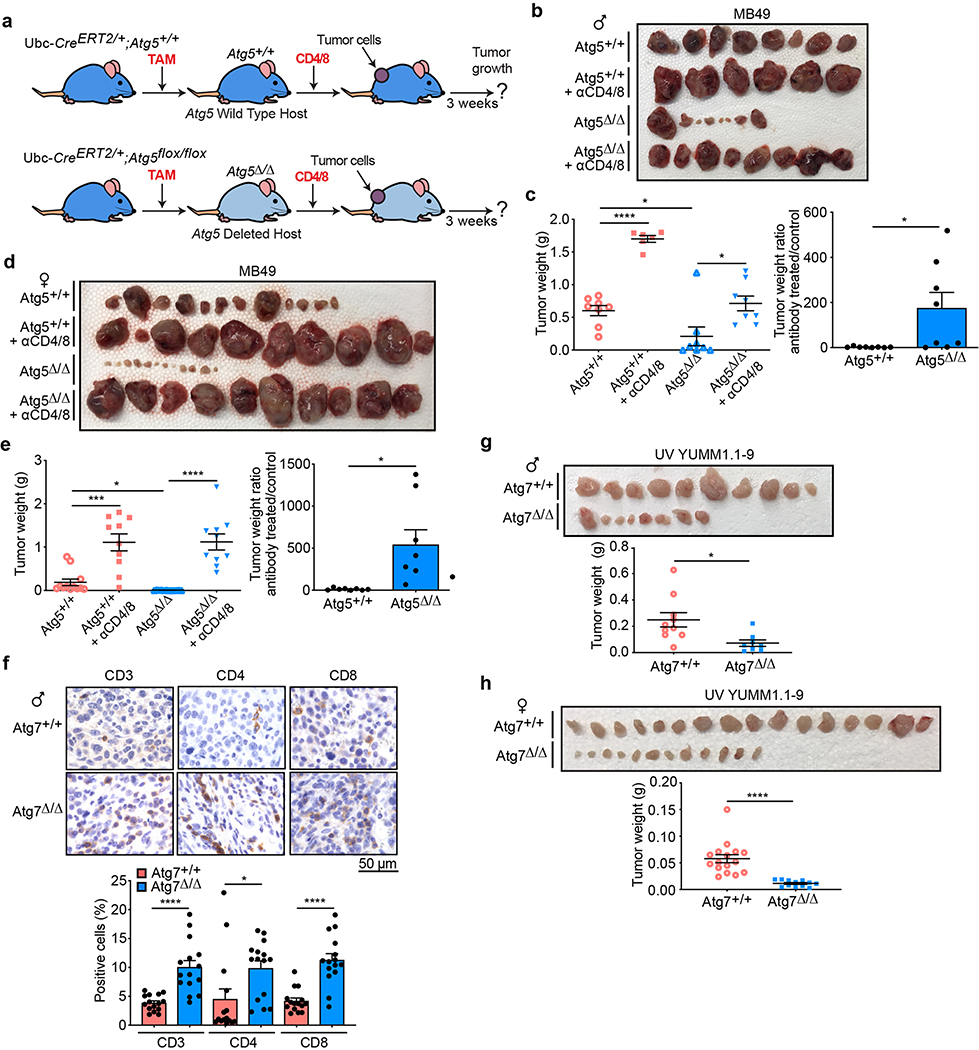
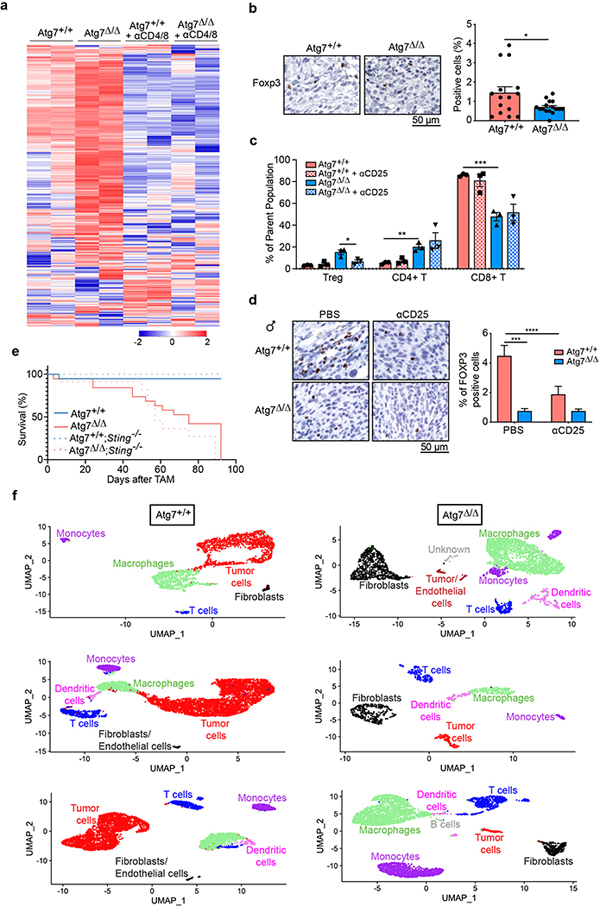
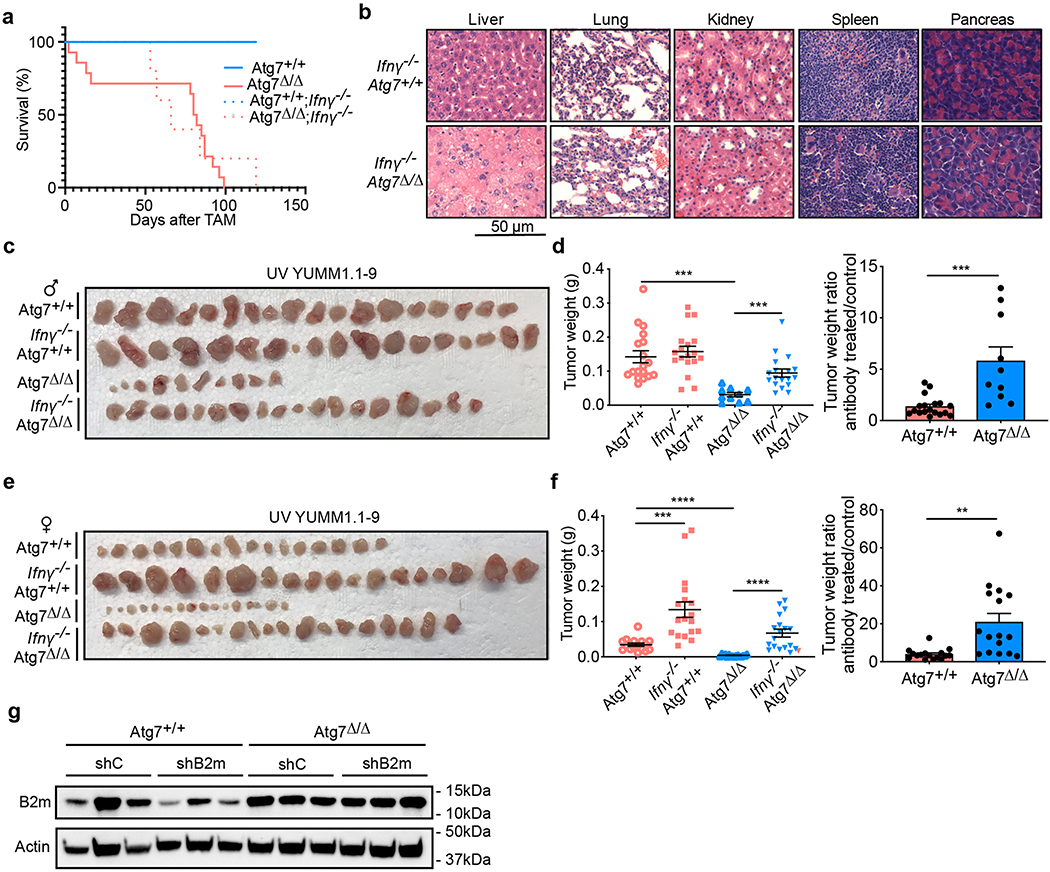
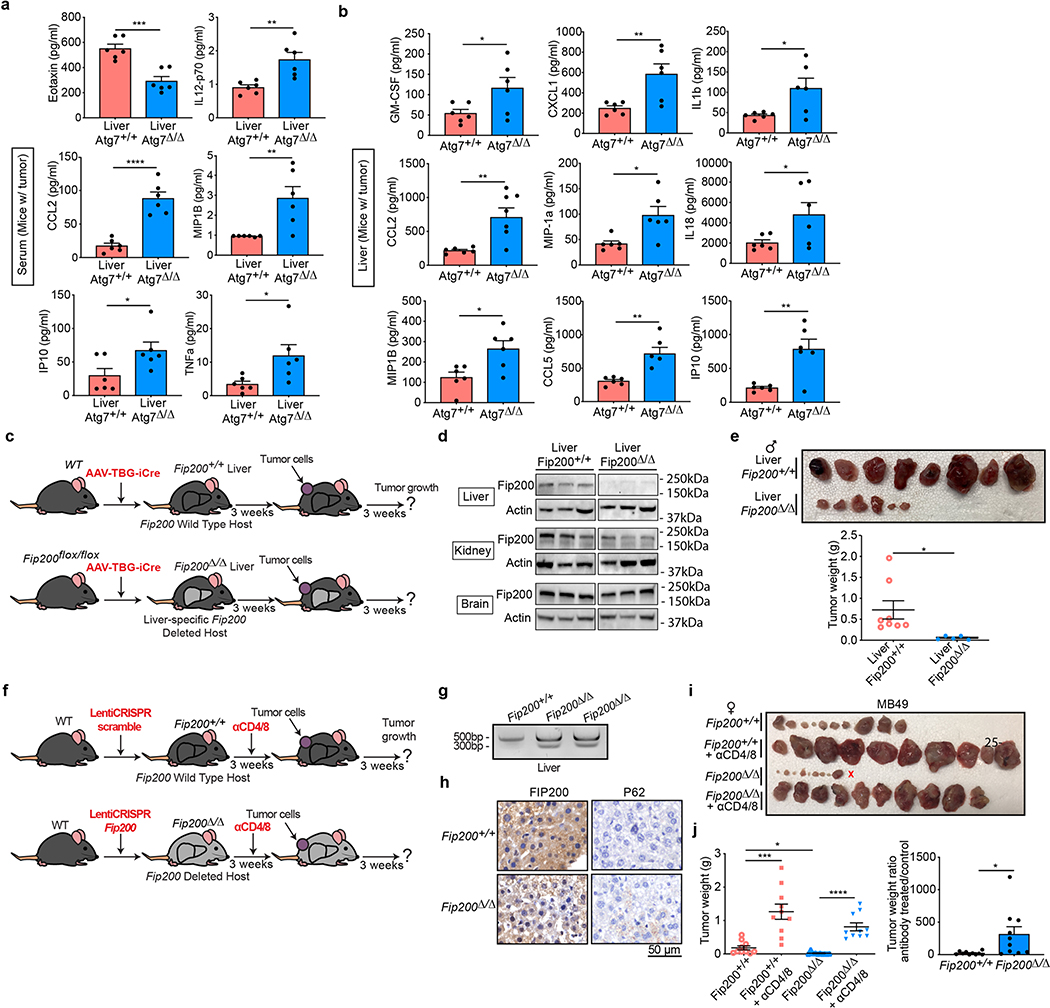
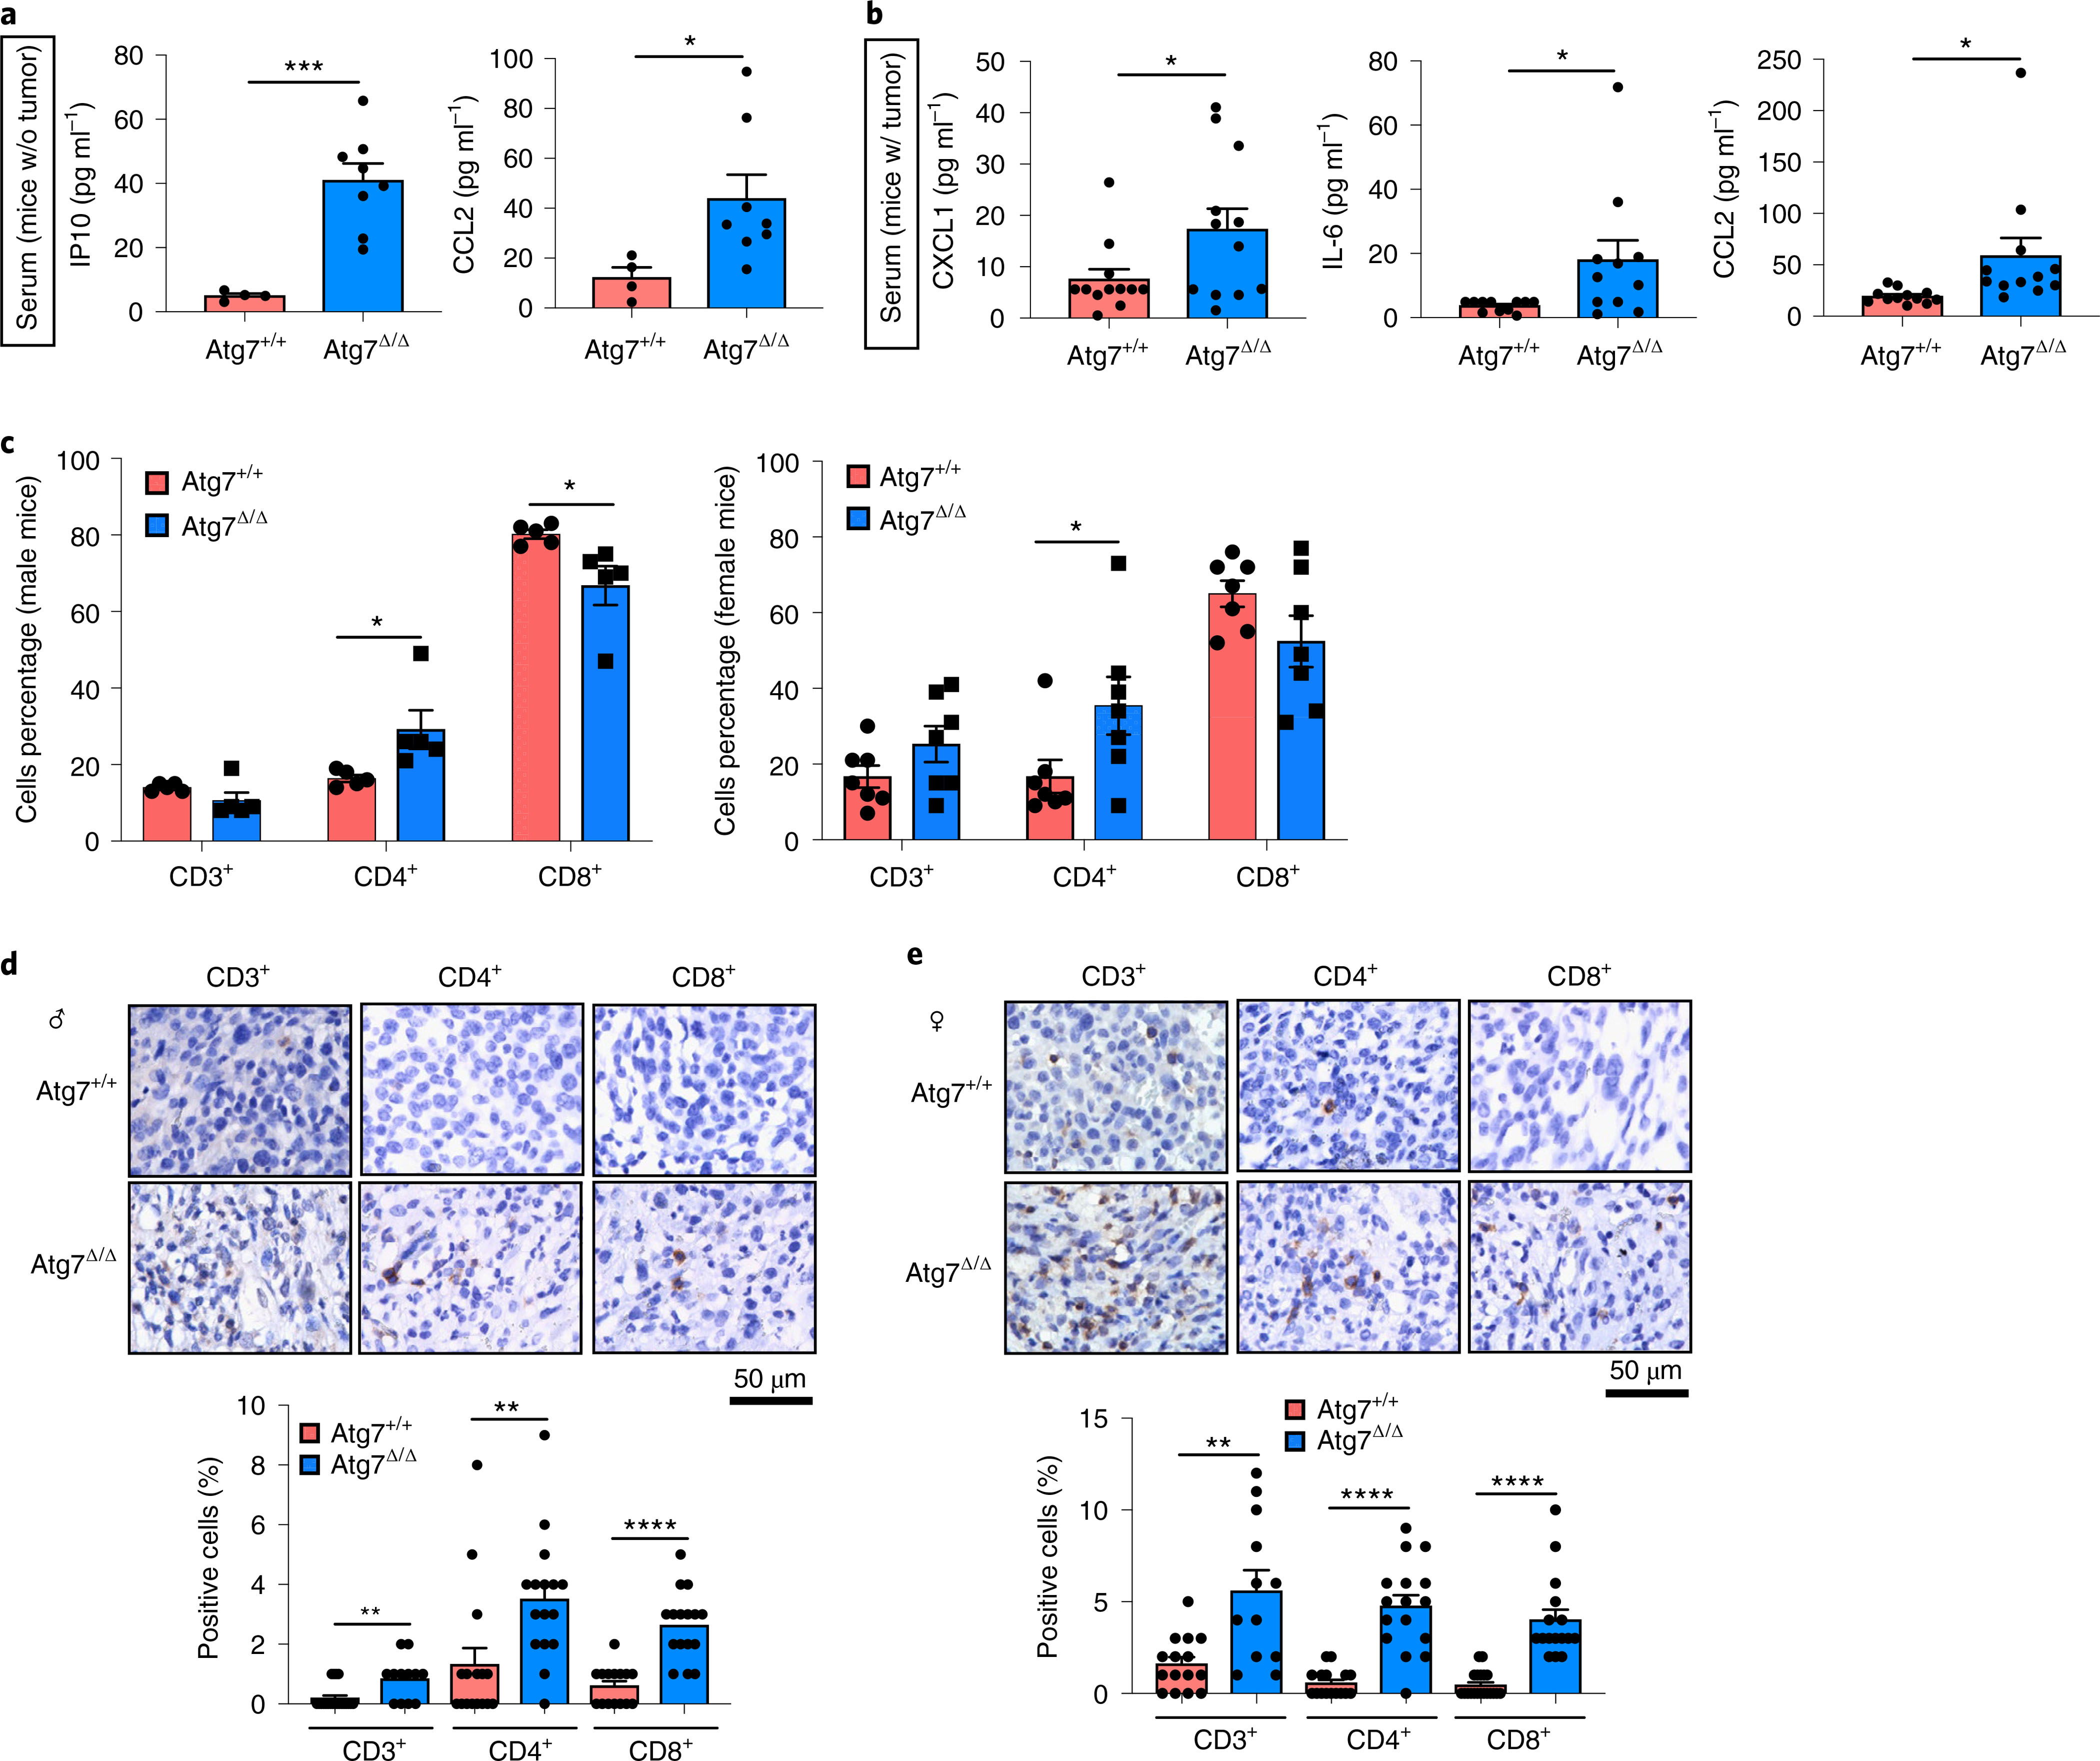
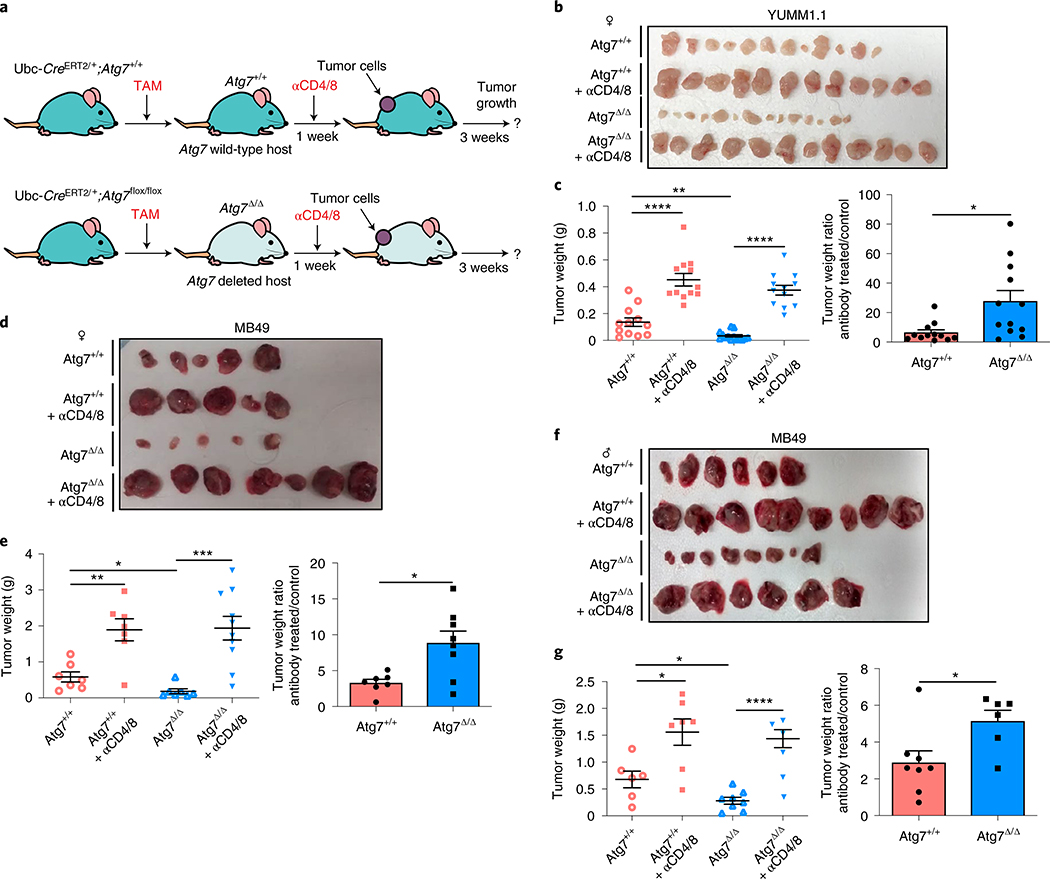
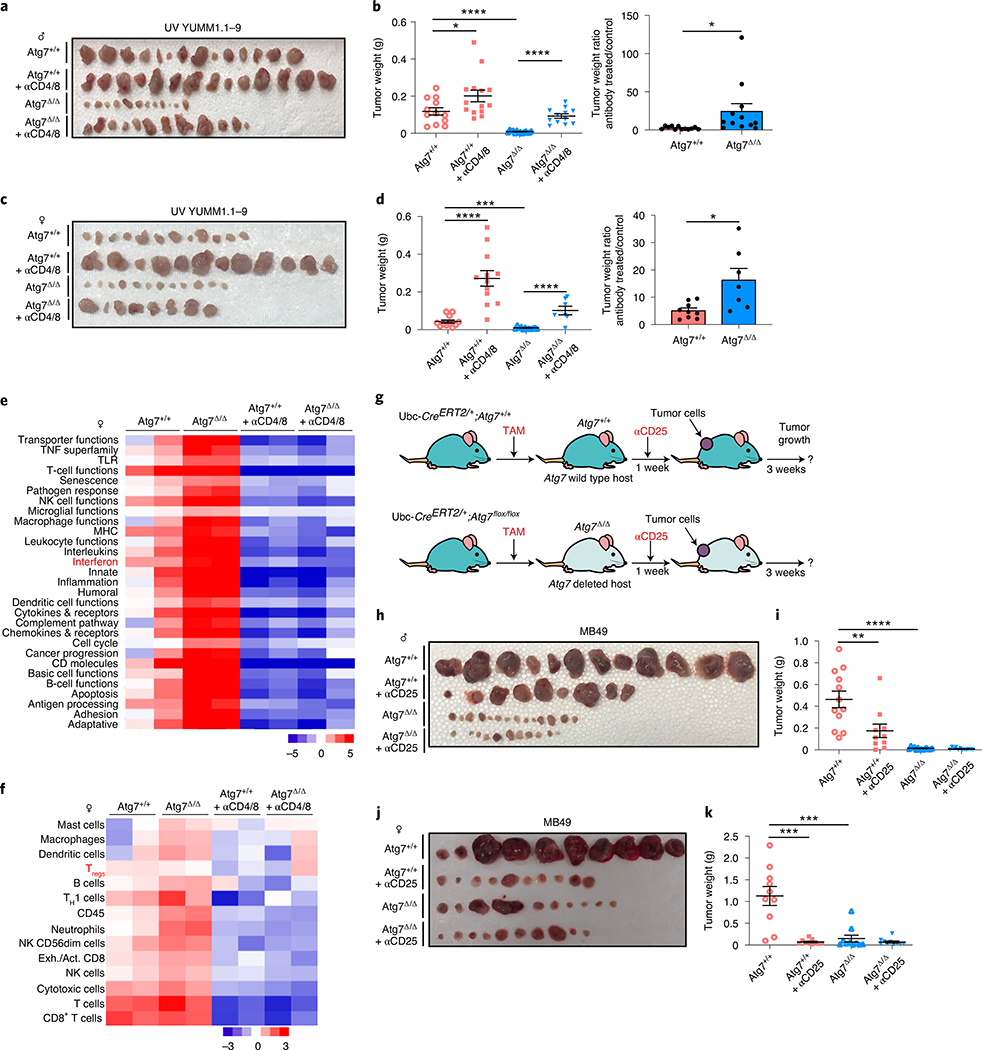
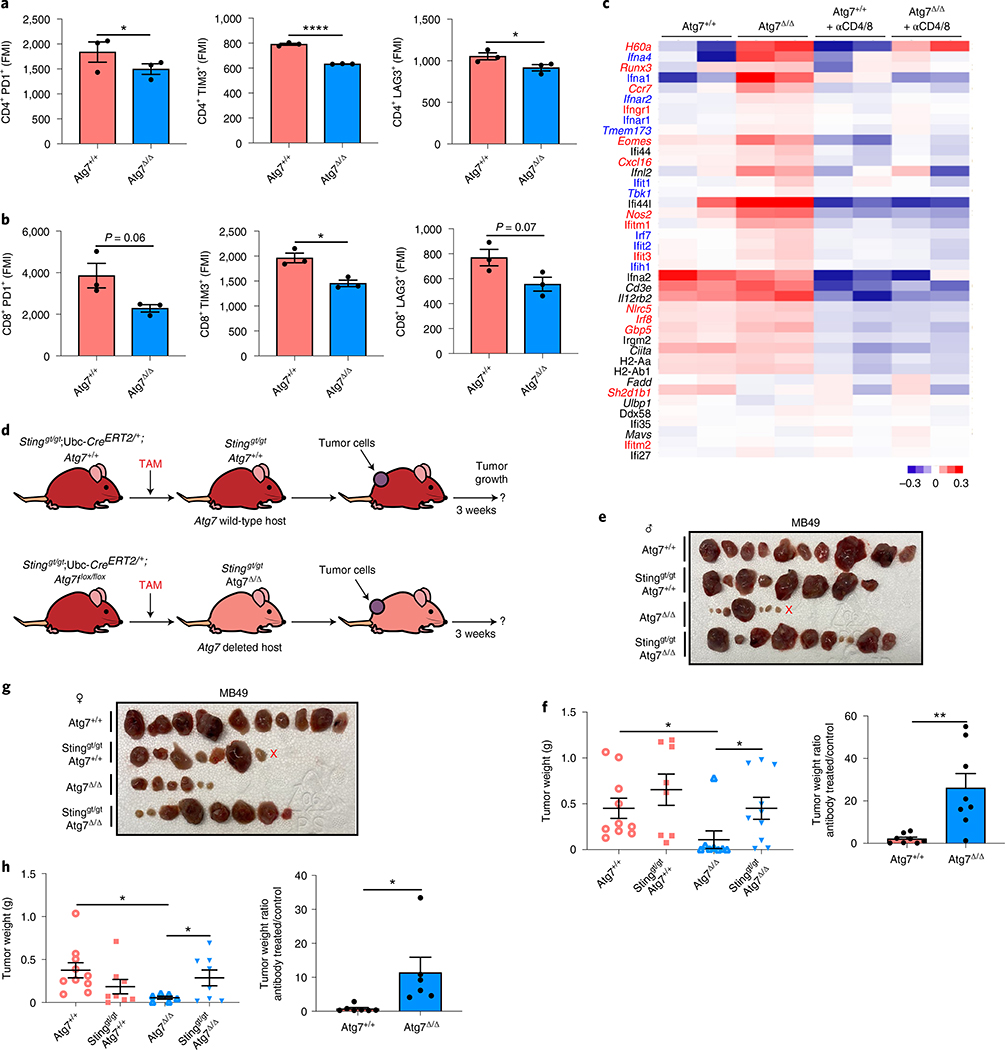
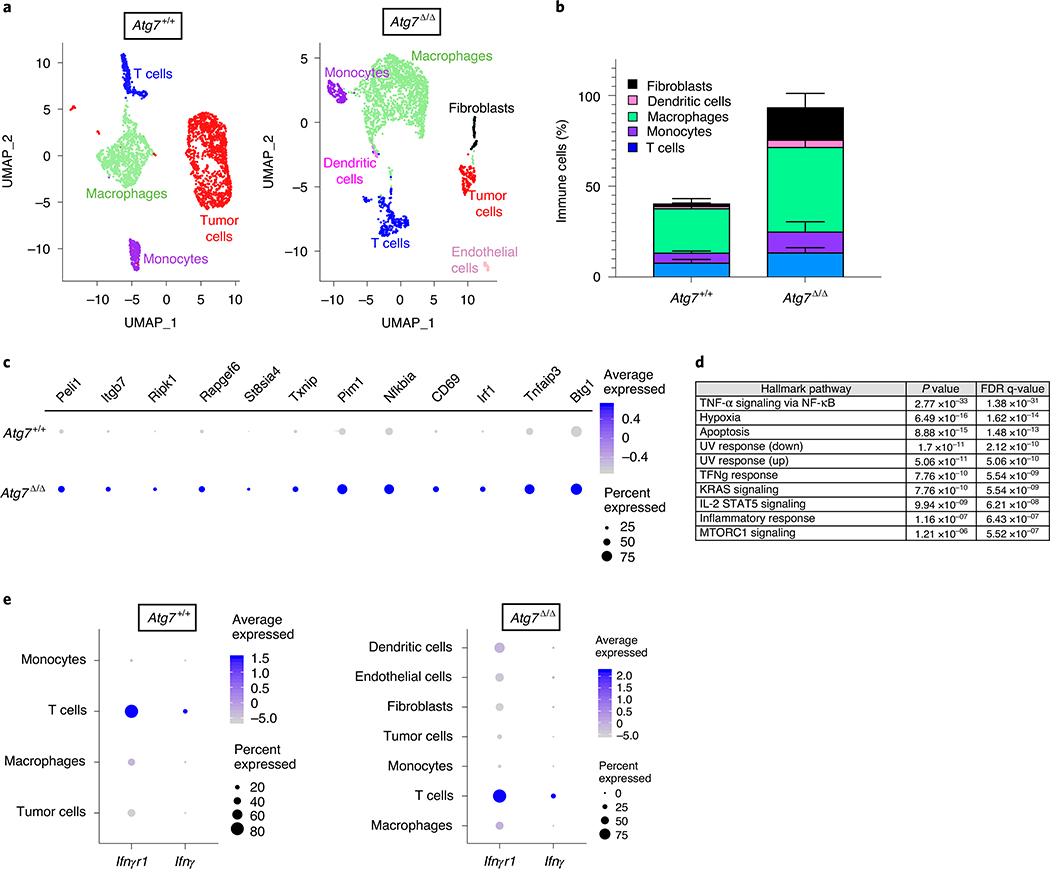
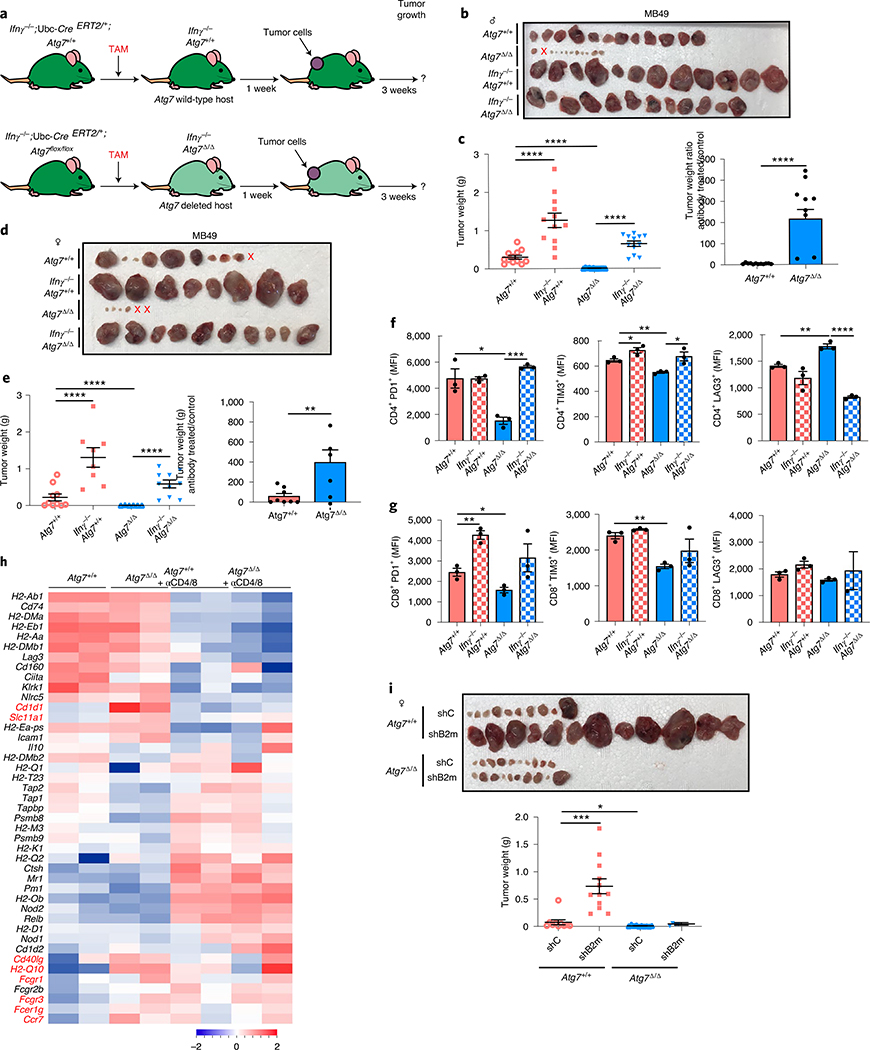
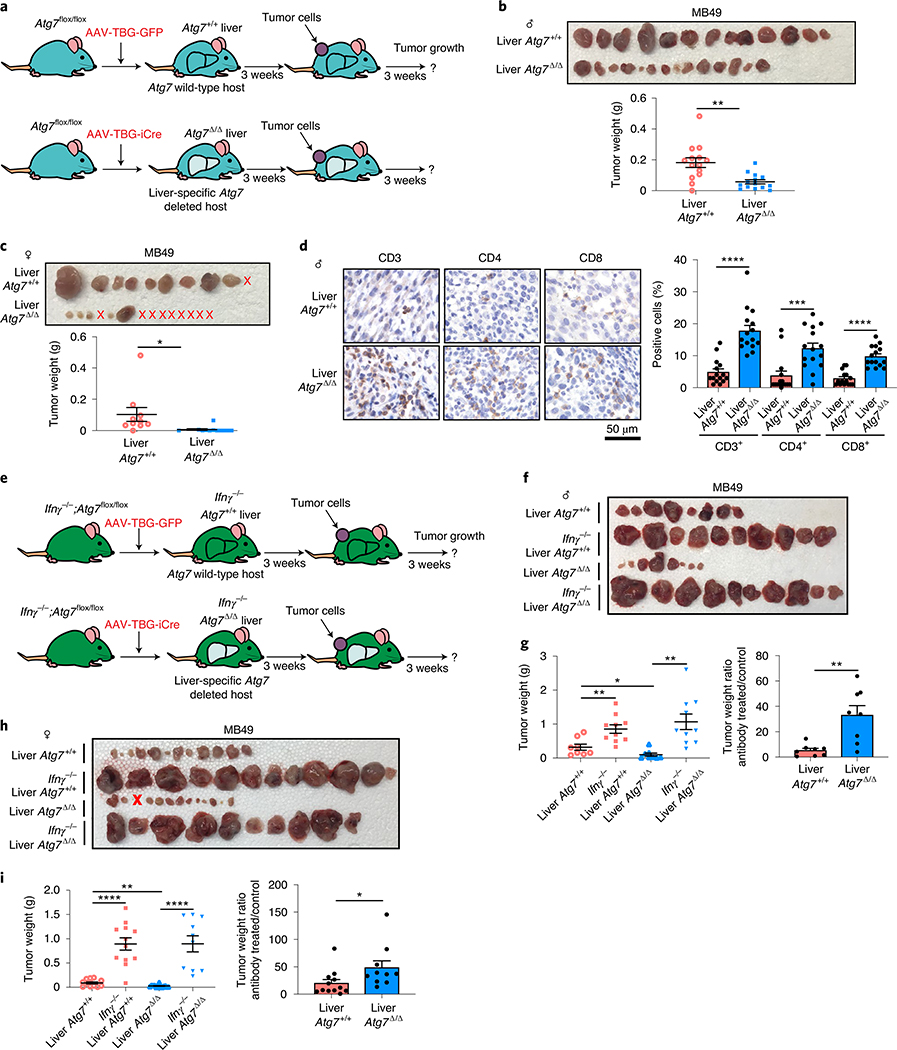
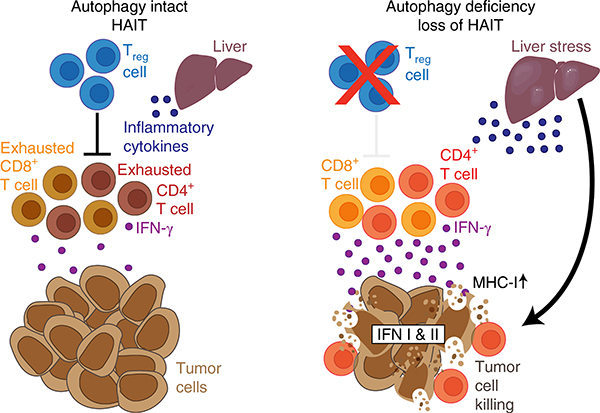
Macroautophagy (hereafter autophagy) degrades and recycles intracellular components to sustain metabolism and survival during starvation. Host autophagy promotes tumor growth by providing essential tumor nutrients. Autophagy also regulates immune cell homeostasis and function and suppresses inflammation. Although host autophagy does not promote a T-cell anti-tumor immune response in tumors with low tumor mutational burden (TMB), whether this was the case in tumors with high TMB was not known. Here we show that autophagy, especially in the liver, promotes tumor immune tolerance by enabling regulatory T-cell function and limiting stimulator of interferon genes, T-cell response and interferon-γ, which enables growth of high-TMB tumors. We have designated this as hepatic autophagy immune tolerance. Autophagy thereby promotes tumor growth through both metabolic and immune mechanisms depending on mutational load and autophagy inhibition is an effective means to promote an antitumor T-cell response in high-TMB tumors.


Conflict of interest statement

Competing interests E.W. is co-founder of Vescor Therapeutics and is a consultant for Novartis. S.G. has consulted for Roche, Merck, Novartis, Foundation Medicine and Foghorn Therapeutics. The other authors declare no competing interests. Additional information Extended data is available for this paper at https://doi.org/10.1038/s43018-020-00110-7. Supplementary information is available for this paper at https://doi.org/10.1038/s43018-020-00110-7. Reprints and permissions information is available at www.nature.com/reprints.

Figures

Extended Data Fig. 1 |
Extended Data Fig. 1 |. Loss of host autophagy does not decrease the growth of low TMB tumors in a T cell-dependent manner.
a, CD3+, CD4+, CD8+ T cells (percentage) in high TMB tumors (MB49) grown on female Atg7+/+ and Atg7Δ/Δ (n = 5 mice each) hosts following αCD4/8, analyzed by flow cytometry. b, Representative IHC images and quantification of CD3+, CD4+ and CD8+ T cells in YUMM1.3 tumors from male Atg7+/+ and Atg7Δ/Δ hosts (n = 5 mice each). c, d, e, f, Comparison of YUMM1.3 tumor growth on male (c, d) Atg7+/+, Atg7+/+ + αCD4/8, Atg7Δ/Δ and Atg7Δ/Δ + αCD4/8 (n = 10 tumors each) and female (e, f) Atg7+/+(n = 6 tumors), Atg7+/+ + αCD4/8 (n = 12 tumors), Atg7Δ/Δ (n = 12 tumors) and Atg7Δ/Δ + αCD4/8 (n = 12 tumors). Tumor pictures (c, e), and tumor weight and ratio (antibody treated/control) (d, f) from the experimental endpoint. g, h, Comparison of MB49 tumor growth on female Atg7+/+(n = 14 tumors), Atg7+/+ + αCD4 (n = 12 tumors), Atg7+/+ + αCD8 (n = 12 tumors), Atg7+/+ + αCD4/8 (n = 8 tumors), Atg7Δ/Δ (n = 12 tumors), Atg7Δ/Δ + αCD4 (n = 14 tumors), Atg7Δ/Δ + αCD8 (n = 14 tumors) and Atg7Δ/Δ + αCD4/8 (n = 12 tumors). Tumor pictures (g), and tumor weight and ratio (antibody treated/control) (h) from the experimental endpoint. All data are mean +/− s.e.m. *P < 0.05, **P < 0.01, ***P < 0.001, ****P < 0.001 using two-sided Student’s t-test. Source data available for a, b, d, f, h.
Extended Data Fig. 2 |
Extended Data Fig. 2 |. Loss of host autophagy through Atg5 deletion decreases tumor growth through a T cell-dependent mechanism.
a, experimental design to induce conditional whole-body Atg5 deletion (Atg5Δ/Δ), and wild-type (Atg5+/+) controls without and with T cell depletion. Ubc-CreERT2/+;Atg5+/+ and Ubc-CreERT2/+;Atg5flox/flox mice were injected with TAM to delete Atg5 and were then injected subcutaneously with tumor cells and intraperitoneally with αCD4/8. Tumor growth was monitored over three weeks. b, c, d, e, Comparison of MB49 tumor growth on male (b, c) Atg5+/+(n = 8 tumors), Atg5+/+ + αCD4/8 (n = 6 tumors), Atg5Δ/Δ (n = 8 tumors) and Atg5Δ/Δ + αCD4/8 (n = 8 tumors) and female (d, e) Atg5+/+(n = 12 tumors), Atg5+/+ + αCD4/8 (n = 10 tumors), Atg5Δ/Δ (n = 12 tumors) and Atg5Δ/Δ + αCD4/8 (n = 10 tumors). Tumor pictures (b, d), and tumor weight and ratio (antibody treated/control) (c, e) from the experimental endpoint. f, Representative IHC images and quantification of CD3+, CD4+ and CD8+ T cells in MB49 tumors from male Atg5+/+ and Atg5Δ/Δ hosts (n = 5 mice each). g, h, Comparison of UV YUMM1.1–9 tumor growth on male (g) Atg7+/+ (n = 10 tumors) and Atg7Δ/Δ (n = 8 tumors) and female (h) Atg7+/+ (n = 16 tumors) and Atg7Δ/Δ (n = 12 tumors) hosts. Tumor pictures and tumor weight from the experimental endpoint. All data are mean +/− s.e.m. *P < 0.05, ***P < 0.001, ****P < 0.0001 using two-sided Student’s t-test. Source data available for c, e, f, g, h.
Extended Data Fig. 3 |
Extended Data Fig. 3 |. Loss of autophagy reduces Tregs and increases immune cell fraction.
a, Overall NanoString gene expression analysis (750 genes) from tumors on female Atg7+/+ and Atg7Δ/Δ hosts with or without αCD4/8 (n = 2 tumors each). Red: high, blue: low expression level. b, Representative IHC images and quantification of FOXP3+ cells in MB49 tumors from female Atg7+/+ and Atg7Δ/Δ hosts (n = 5 tumors each). c, FOXP3+ Treg cells, CD4+ and CD8+ T cells (percentage) in high TMB tumors (MB49) grown on female (n = 3 tumors) Atg7+/+ and Atg7Δ/Δ hosts following αCD25, analyzed by flow cytometry. d, Representative IHC images and quantification of FOXP3+ cells in MB49 tumors from female Atg7+/+ and Atg7Δ/Δ hosts following αCD25 (n = 3 tumors each). e, Survival analysis of Atg7+/+ (n = 19 mice), Atg7Δ/Δ (n = 19 mice), Stinggt/gt;Atg7+/+ (n = 15 mice) and Stinggt/gt;Atg7Δ/Δ (n = 13 mice) mice. f, scRNA-seq UMAP projection of cell cluster from tumors from female Atg7+/+ and Atg7Δ/Δ hosts (n = 3 tumors each). All data are mean +/− s.e.m. *P < 0.05, **P < 0.01, ***P < 0.001, ****P < 0.0001 using two-sided Student’s t-test. Source data available for b, c, d.
Extended Data Fig. 4 |
Extended Data Fig. 4 |. Loss of autophagy increases high TMB tumor growth in an IFNγ-dependent manner.
a, Survival analysis of Atg7+/+ (n = 16 mice), Atg7Δ/Δ (n = 14 mice), IFNγ−/−;Atg7+/+ (n = 6 mice) and IFNγ−/−;Atg7Δ/Δ (n = 5 mice) hosts. b, Representative H&e tissue staining from IFNγ−/−;Atg7+/+ and IFNγ−/−;Atg7Δ/Δ hosts. Images are representative of two independent experiments. c, d, e, f. Comparison of UV YUMM1.1–9 tumor growth on male (c, d) Atg7+/+ (n = 18 tumors), IFNγ−/−;Atg7+/+ (n = 18 tumors), Atg7Δ/Δ (n = 10 tumors), IFNγ−/−;Atg7Δ/Δ (n = 18 tumors) and female (e, f) Atg7+/+ (n = 16 tumors), IFNγ−/−;Atg7+/+ (n = 18 tumors), Atg7Δ/Δ (n = 16 tumors), IFNγ−/−;Atg7Δ/Δ (n = 18 tumors) hosts. Tumor pictures (c, e), and tumor weight and ratio (antibody treated/control) (d, f) from the experimental endpoint. g, Cropped Western blotting showing expression of B2m in MB49 shC and shB2m tumors from Atg7+/+ and Atg7Δ/Δ hosts (n = 3 tumors each) from one experiment. Actin was used a loading control. All data are mean +/− s.e.m. **P < 0.01, ***P < 0.001 using two-sided Student’s t-test. Source data available for d, f.
Extended Data Fig. 5 |
Extended Data Fig. 5 |. Loss of autophagy, not LC3-associated phagocytosis (LAP), decreases tumor growth through a T cell-dependent mechanism.
a, Serum and b, liver cytokine and chemokine profiling of female and male hosts bearing MB49 tumors with or without liver-specific deletion of Atg7 (n = 6 mice each), showing those with significant differences among 26. c, experimental design to induce liver-specific Fip200 deletion (liver Fip200Δ/Δ) and wild-type controls (liver Fip200+/+). Fip200flox/flox or C57BL/6J mice were injected with AAV-TBG-iCre and MB49 cells were then injected subcutaneously and tumor growth was monitored over three weeks. d, Cropped Western blotting showing expression of Fip200 in livers, kidneys and brains (n = 3 each) from one experiment. e, Comparison of MB49 tumor growth on male liver Fip200+/+(n = 8 tumors) and liver Fip200Δ/Δ (n = 6 tumors) hosts. f, experimental design to induce conditional Fip200 deletion (Fip200Δ/Δ) and wild-type (Fip200+/+) controls. C57BL/6J mice were injected with lentiCRISPR scramble or Fip200 to delete Fip200 and were then injected subcutaneously with tumor cells. Tumor growth was monitored over three weeks. g, Representative surveyor assay for Fip200 gRNA screening using liver gDNA from Fip200+/+ and Fip200Δ/Δ hosts (n = 10 mice each) from one experiment. h, Representative IHC images of FIP200+ and p62+ cells in liver from Fip200+/+ and Fip200Δ/Δ hosts (n = 10 mice each). i, j, Comparison of MB49 tumor growth on female Fip200+/+ and Fip200Δ/Δ hosts with or without CD4/8 depletion (n = 10 tumors each). Tumor pictures (i), and tumor weight and ratio (antibody treated/control) (j) from the experimental endpoint. Data are mean +/− s.e.m. *P < 0.05, **P < 0.01, ***P<0.001, ****P < 0.0001 using two-sided Student’s t-test. Source data available for a, b, e, j.
Fig. 1 |
Fig. 1 |. Loss of host autophagy increases the level of circulating pro-inflammatory cytokines and promotes T-cell infiltration in high-TMB tumors.
a, Serum cytokine and chemokine profiling of female and male Atg7+/+ (n = 4 mice) and Atg7Δ/Δ (n = 8 mice) hosts without (w/o) tumors, showing those with significant differences among 26 cytokines and chemokines. b, Serum cytokine and chemokine profiling of female and male Atg7+/+ and Atg7Δ/Δ hosts with (w/) MB49 tumors (n = 12 tumors each) showing those with significant differences. c, CD3+, CD4+ and CD8+ cells (percentage) in high-TMB tumors (MB49) grown on male (n = 5 mice each) and female (n = 7 mice each) Atg7+/+ and Atg7Δ/Δ hosts analyzed by flow cytometry. These data are representative of three independent experiments. d,e, Representative IHC images and quantification of CD3+, CD4+ and CD8+ T cells in MB49 tumors from male (d) and female (e) Atg7+/+ and Atg7Δ/Δ hosts (n = 5 mice each). All data are mean ± s.e.m. *P < 0.05, **P < 0.01, ***P < 0.01, ****P < 0.0001 using a two-sided Student’s t-test. Source data are available for ae.
Fig. 2 |
Fig. 2 |. Host autophagy promotes high-TMB tumor growth through a T-cell-dependent mechanism.
a, experimental design to induce host mice with conditional whole-body Atg7 deletion (Atg7Δ/Δ) and the wild-type control (Atg7+/+), without and with T-cell depletion. Ubc-CreERT2/+;Atg7+/+ and Ubc-CreERT2/+;Atg7flox/flox mice were injected with tamoxifen (TAM) to delete Atg7 and were then injected subcutaneously with tumor cells and intraperitoneally with anti-CD4/8. Tumor growth was monitored over 3 weeks, where all tumors establish similarly with antitumor effects becoming apparent beyond 2 weeks. b,c, Comparison of YUMM1.1 tumor growth on female Atg7+/+ (n = 12 tumors), Atg7+/+ + anti-CD4/8 (n = 12 tumors), Atg7Δ/Δ (n = 14 tumors) and Atg7Δ/Δ + anti-CD4/8 (n = 12 tumors). Tumor pictures (b), tumor weight and ratio (antibody treated/control) (c) from the experimental end point. dg, Comparison of MB49 tumor growth on female (d,e) Atg7+/+ (n = 7 tumors), Atg7+/+ + anti-CD4/8 (n = 7 tumors), Atg7Δ/Δ (n = 7 tumors) and Atg7Δ/Δ + anti-CD4/8 (n = 10 tumors) and male (f,g) Atg7+/+ (n = 6 tumors), Atg7+/+ + anti-CD4/8 (n = 8 tumors), Atg7Δ/Δ (n = 8 tumors) and Atg7Δ/Δ + anti-CD4/8 (n = 6 tumors) hosts. Tumor pictures (d,f), tumor weight and ratio (antibody treated/control) (e,g) from the experimental end point. All data are mean ± s.e.m. *P < 0.05, **P < 0.01, ***P < 0.01, ****P < 0.0001 using a two-sided Student’s t-test. Source data are available for c,e,g.
Fig. 3 |
Fig. 3 |. Loss of autophagy upregulates an antitumor immune response in a T-cell-dependent manner and increases Treg cells.
ad, Comparison of UV YUMM1.1–9 tumor growth on male (a,b) Atg7+/+ (n = 14 tumors), Atg7+/+ + anti-CD4/8 (n = 14 tumors), Atg7Δ/Δ (n = 12 tumors) and Atg7Δ/Δ + anti-CD4/8 (n = 12 tumors) and female (c,d) Atg7+/+ (n = 12 tumors), Atg7+/+ + anti-CD4/8 (n = 12 tumors), Atg7Δ/Δ (n = 12 tumors) and Atg7Δ/Δ + anti-CD4/8 (n = 8 tumors). Tumor pictures (a,c), tumor weight and ratio (antibody treated/control) (b,d) from the experimental end point. e,f, NanoString expression analysis of genes involved in signature immune pathways (e) or immune cell type (f) on female Atg7+/+ and Atg7Δ/Δ hosts with or without anti-CD4/8 (n = 2 mice each). Red, high expression level; blue, low expression level. TNF, tumor necrosis factor; TLR, Toll-like receptor; NK, natural killer; MHC, major histocompatibility complex; TH1, type 1 helper T cells. g, experimental design to induce conditional whole-body Atg7 deletion (Atg7Δ/Δ) and wild-type (Atg7+/+) controls without and with Treg cell depletion. Ubc-CreERT2/+;Atg7+/+ and Ubc-CreERT2/+;Atg7flox/flox mice were injected with TAM to delete Atg7 and were then injected subcutaneously with tumor cells and intraperitoneally with anti-CD25. Tumor growth was monitored over 3 weeks. hk, Comparison of MB49 tumor growth on male (h,i) Atg7+/+ (n = 12 tumors), Atg7+/+ + anti-CD25 (n = 10 tumors), Atg7Δ/Δ (n = 14 tumors) and Atg7Δ/Δ + anti-CD25 (n = 12 tumors) and female (j,k) Atg7+/+, Atg7+/+ + anti-CD25, Atg7Δ/Δ and Atg7Δ/Δ + anti-CD25 (n = 10 tumors each). Tumor pictures (h,j) and tumor weight (i,k) from the experimental end point. All data are mean ± s.e.m. *P < 0.05, ***P < 0.001, ****P < 0.0001 using a two-sided Student’s t-test. Source data are available for b,d,i,k.
Fig. 4 |
Fig. 4 |. Host autophagy promotes high-TMB tumor growth through suppression of Sting.
a, Percentage of CD4+PD1+, CD4+TIM3+ and CD4+LAG3+ cells in tumors in male Atg7+/+ and Atg7Δ/Δ hosts (n = 3 tumors each) analyzed by flow cytometry. These data are representative of three independent experiments. MFI: mean fluorescent intensity. b, Percentage of CD8+PD1+, CD8+TIM3+ and CD8+LAG3+ cells in tumors in male Atg7+/+ and Atg7Δ/Δ hosts (n = 3 tumors each) analyzed by flow cytometry. c, NanoString expression analysis of genes involved in the IFN pathway in MB49 tumors from female Atg7+/+ and Atg7Δ/Δ hosts with or without anti-CD4/8 (n = 2 mice each). Blue genes indicate IFN-αβ, red genes indicate IFN-γ pathways. Red: high expression level; blue: low expression level. d, experimental design to induce conditional whole-body Atg7 deletion (Atg7Δ/Δ) and wild-type (Atg7+/+) controls with loss of Sting. Stinggt/gt;Ubc-CreERT2/+;Atg7+/+ and Stinggt/gt;Ubc-CreERT2/+;Atg7flox/flox mice were injected with TAM to delete Atg7 and were then injected subcutaneously with tumor cells. Tumor growth was monitored over 3 weeks. eh, Comparison of MB49 tumor growth on male (e,f) Atg7+/+(n = 10 tumors), Stinggt/gt;Atg7+/+(n = 8 tumors), Atg7Δ/Δ (n = 8 tumors) and Stinggt/gt;Atg7Δ/Δ (n = 10 tumors) and female (g,h) Atg7+/+ (n = 10 tumors), Stinggt/gt;Atg7+/+ (n = 8 tumors), Atg7Δ/Δ (n = 6 tumors) and Stinggt/gt;Atg7Δ/Δ (n = 8 tumors). Tumor pictures (e,g) and tumor weight and ratio (antibody treated/control) (f,h) from the experimental end point. All data are mean ± s.e.m. *P < 0.05, ****P < 0.0001 using a two-sided Student’s t-test. Source data are available for a,b,f,h.
Fig. 5 |
Fig. 5 |. Loss of autophagy increases immune cell fraction and IFN-γ pathway gene expression.
a, Representative scRNA-seq uniform manifold approximation and projection (UMAP) projection of cell cluster from tumors from female Atg7+/+ and Atg7Δ/Δ hosts (n = 1 tumor each). These data are representative of two independent experiments with two tumors from Atg7+/+ and Atg7Δ/Δ hosts each. b, Immune cell fractions in tumors from female Atg7+/+ and Atg7Δ/Δ hosts (n = 4 tumors each). All data are mean ± s.e.m. c, Dot plot of differential IFN-γ pathway gene expression in tumors infiltrated T cells from female Atg7+/+ and Atg7Δ/Δ hosts (n = 2 tumors each). d, Top ten pathways enriched in tumor-infiltrated T cells from Atg7Δ/Δ hosts compared to Atg7+/+ hosts (n = 2 tumors each). NF-κB, nuclear factor κB; FDR, false discovery rate. e, Dot plot of differential gene expression (Ifnγr1 and Ifnγ) in tumors and tumor-infiltrated immune cells from female Atg7+/+ and Atg7Δ/Δ hosts (n = 2 tumors each).
Fig. 6 |
Fig. 6 |. Loss of autophagy decreases tumor growth in an IFN-γ- and MHC-I-dependent manner.
a, experimental design to induce conditional whole-body Atg7 deletion (Atg7Δ/Δ) and wild-type (Atg7+/+) controls with loss of Ifnγ. Ifnγ−/−;Ubc-CreERT2/+;Atg7+/+ and Ifnγ−/−;Ubc-CreERT2/+;Atg7flox/flox mice were injected with TAM to delete Atg7 and were then injected subcutaneously with tumor cells. Tumor growth was monitored over 3 weeks. be, Comparison of MB49 tumor growth on male (b,c) Atg7+/+, Ifnγ−/−;Atg7+/+, Atg7Δ/Δ and Ifnγ−/−;Atg7Δ/Δ (n = 12 tumors each) and female (d,e) Atg7+/+ (n = 10 tumors), Ifnγ−/−;Atg7+/+ (n = 8 tumors), Atg7Δ/Δ (n = 6 tumors) and Ifnγ−/−;Atg7Δ/Δ (n = 10 tumors). Tumor pictures (b,d) and tumor weight and ratio (antibody treated/control) (c,e) from the experimental end point. f, Percentage of CD4+PD1+, CD4+TIM3+ and CD4+LAG3+ cells in tumors in male Atg7+/+, Ifnγ−/−;Atg7+/+, Atg7Δ/Δ and Ifnγ−/−;Atg7Δ/Δ hosts (n = 3 tumors each) analyzed by flow cytometry. g, Percentage of CD8+PD1+, CD8+TIM3+ and CD8+LAG3+ cells in tumors in male Atg7+/+, Ifnγ−/−;Atg7+/+, Atg7Δ/Δ and Ifnγ−/−;Atg7Δ/Δ hosts (n = 3 tumors each) analyzed by flow cytometry. h, NanoString expression analysis of genes involved in the MHC and antigen presentation pathway in MB49 tumors from female Atg7+/+ and Atg7Δ/Δ hosts with or without anti-CD4/8 (n = 2 tumors each). Red genes indicate MHC pathway. Red: high expression level; blue: low expression level. i, Comparison of MB49 shC and shB2m tumor growth on female Atg7+/+ (n = 10–12 tumors) and Atg7Δ/Δ (n = 10 tumors) hosts. Tumor pictures and tumor weight from the experimental end point. All data are mean ± s.e.m. *P < 0.05, **P < 0.01, ***P < 0.01, ****P < 0.0001 using a two-sided Student’s t-test. Source data are available for c,eg,i.
Fig. 7 |
Fig. 7 |. Liver autophagy is necessary to maintain tumor growth in an IFN-γ-dependent manner.
a, experimental design to induce liver hepatocyte-specific Atg7 deletion (liver Atg7Δ/Δ) and wild-type controls (liver Atg7+/+). Atg7flox/flox mice were either injected with adeno-associated virus (AAV)–thyroxine binding globulin (TBG) promoter–GFP or AAV–TBG–iCre and MB49 cells were then injected subcutaneously and tumor growth was monitored over 3 weeks. b,c, Comparison of MB49 tumor growth on male (b) liver Atg7Δ/Δ and liver Atg7+/+ (n = 14 tumors each) and female (c) liver Atg7Δ/Δ and liver Atg7+/+ (n = 10 and 14 tumors, respectively). Tumor pictures and weight from the experimental end point. d, Representative IHC images and quantification of CD3+, CD4+ and CD8+ T cells in MB49 tumors from male liver Atg7+/+ and liver Atg7Δ/Δ hosts (n = 5 mice each). e, experimental design to induce conditional liver-specific liver Atg7Δ/Δ and liver Atg7+/+ controls with loss of Ifnγ. The Ifnγ−/−;Atg7flox/flox were either injected with AAV–TBG–GFP or AAV–TBG–iCre and MB49 cells were then injected subcutaneously and tumor growth was monitored over 3 weeks. fi, Comparison of MB49 tumor growth on male (f,g) liver Atg7+/+ (n = 8 tumors), Ifnγ−/−;liver Atg7+/+ (n = 10 tumors), liver Atg7Δ/Δ (n = 8 tumors) and liver Ifnγ−/−;Atg7Δ/Δ (n = 10 tumors) and female (h,i) liver Atg7+/+ (n = 12 tumors), Ifnγ−/−;liver Atg7+/+ (n = 12 tumors), liver Atg7Δ/Δ (n = 12 tumors) and liver Ifnγ−/−;Atg7Δ/Δ (n = 10 tumors). Tumor pictures (f,h) and tumor weight and ratio (antibody treated/control) (g,i) from the experimental end point. All data are mean ± s.e.m. *P < 0.05, **P < 0.01, ***P < 0.001, ****P < 0.0001 using a two-sided Student’s t-test. Source data are available for bd,g,i.
Fig. 8 |
Fig. 8 |. Model depicting hepatic autophagic immune tolerance.
Loss of host autophagy promotes high-TMB tumor growth through immune response inhibition. Autophagy, especially in the liver, suppresses inflammation, antitumor T-cell activity and IFN type I and II responses, allowing the growth of high-TMB tumors. HAIT, hepatic autophagy immune tolerance.

Comment in

References

    1. Karsli-Uzunbas G et al.Autophagy is required for glucose homeostasis and lung tumor maintenance. Cancer Discov. 4, 914–927 (2014). - PMC - PubMed
    1. Komatsu M et al.Impairment of starvation-induced and constitutive autophagy in Atg7-deficient mice. J. Cell Biol. 169, 425–434 (2005). - PMC - PubMed
    1. Kuma A et al.The role of autophagy during the early neonatal starvation period. Nature 432, 1032–1036 (2004). - PubMed
    1. Guo JY et al.Autophagy provides metabolic substrates to maintain energy charge and nucleotide pools in Ras-driven lung cancer cells. Genes Dev. 30, 1704–1717 (2016). - PMC - PubMed
    1. Kamada Y, Sekito T & Ohsumi Y Autophagy in yeast: a TOR-mediated response to nutrient starvation. Curr. Top. Microbiol. Immunol. 279, 73–84 (2004). - PubMed

Publication types