. 2021 Sep;7(9):000643.
doi: 10.1099/mgen.0.000643.

Whole-genome-based phylogenomic analysis of the Belgian 2016-2017 influenza A(H3N2) outbreak season allows improved surveillance

Affiliations

Whole-genome-based phylogenomic analysis of the Belgian 2016-2017 influenza A(H3N2) outbreak season allows improved surveillance

Laura A E Van Poelvoorde et al. Microb Genom. 2021 Sep.

Abstract

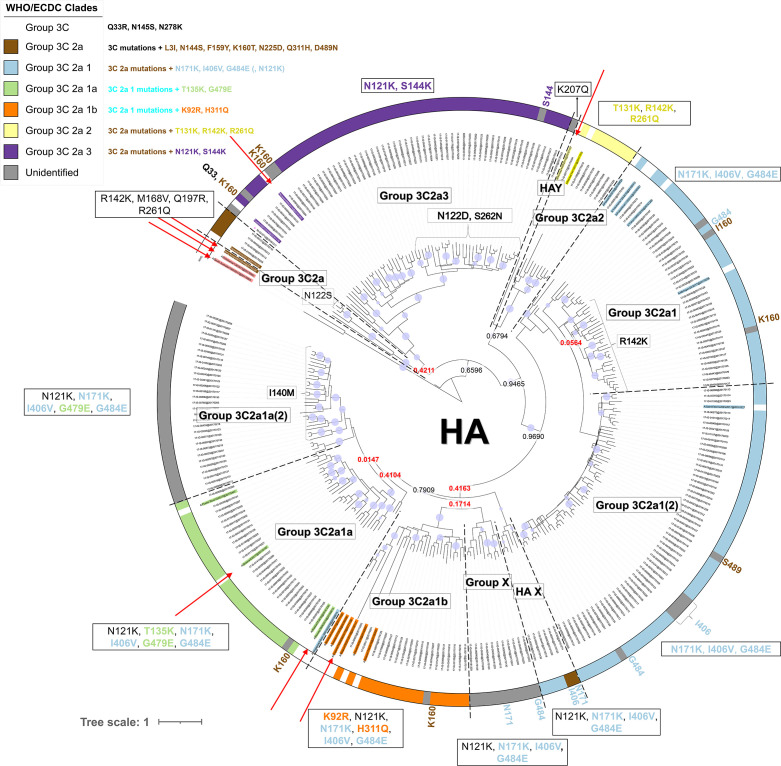
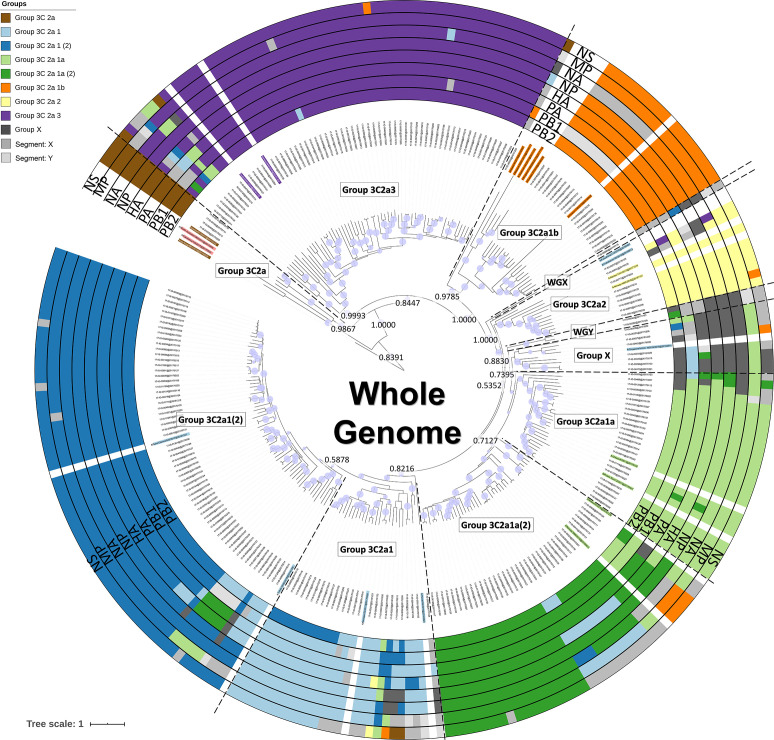
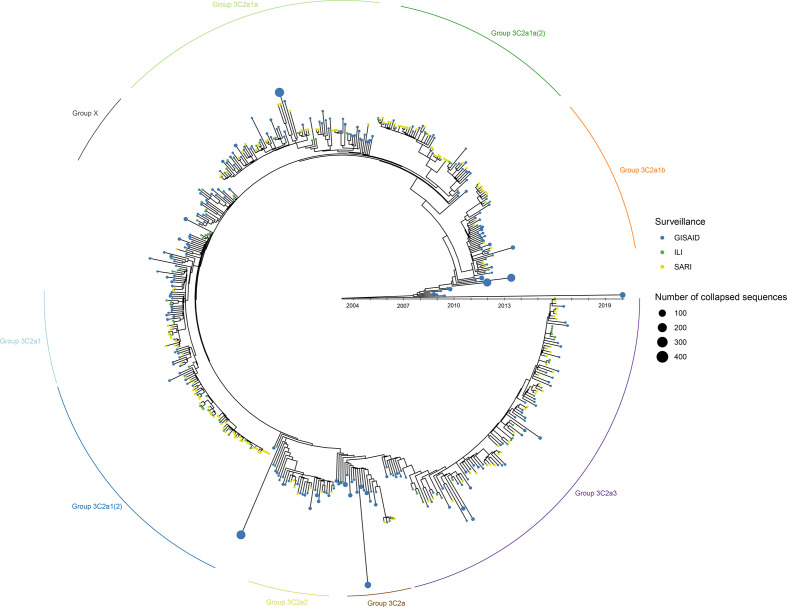
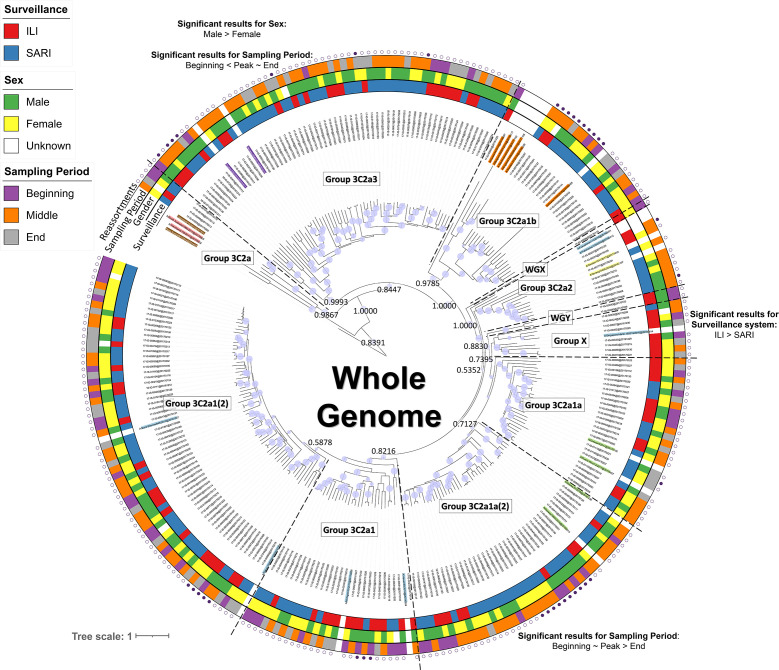
Seasonal influenza epidemics are associated with high mortality and morbidity in the human population. Influenza surveillance is critical for providing information to national influenza programmes and for making vaccine composition predictions. Vaccination prevents viral infections, but rapid influenza evolution results in emerging mutants that differ antigenically from vaccine strains. Current influenza surveillance relies on Sanger sequencing of the haemagglutinin (HA) gene. Its classification according to World Health Organization (WHO) and European Centre for Disease Prevention and Control (ECDC) guidelines is based on combining certain genotypic amino acid mutations and phylogenetic analysis. Next-generation sequencing technologies enable a shift to whole-genome sequencing (WGS) for influenza surveillance, but this requires laboratory workflow adaptations and advanced bioinformatics workflows. In this study, 253 influenza A(H3N2) positive clinical specimens from the 2016-2017 Belgian season underwent WGS using the Illumina MiSeq system. HA-based classification according to WHO/ECDC guidelines did not allow classification of all samples. A new approach, considering the whole genome, was investigated based on using powerful phylogenomic tools including beast and Nextstrain, which substantially improved phylogenetic classification. Moreover, Bayesian inference via beast facilitated reassortment detection by both manual inspection and computational methods, detecting intra-subtype reassortants at an estimated rate of 15 %. Real-time analysis (i.e. as an outbreak is ongoing) via Nextstrain allowed positioning of the Belgian isolates into the globally circulating context. Finally, integration of patient data with phylogenetic groups and reassortment status allowed detection of several associations that would have been missed when solely considering HA, such as hospitalized patients being more likely to be infected with A(H3N2) reassortants, and the possibility to link several phylogenetic groups to disease severity indicators could be relevant for epidemiological monitoring. Our study demonstrates that WGS offers multiple advantages for influenza monitoring in (inter)national influenza surveillance, and proposes an improved methodology. This allows leveraging all information contained in influenza genomes, and allows for more accurate genetic characterization and reassortment detection.

Keywords: beast; influenza; next-generation sequencing; nextstrain; surveillance.


Conflict of interest statement

The authors declare that there are no conflicts of interest.

Figures

Fig. 1.
Fig. 1.
Phylogenetic HA gene tree. Red arrows indicate (coloured) reference names assigned to the various groups as defined by the WHO/ECDC, and coloured names without red arrows indicate additional references selected from ECDC reports and nextstrain.org. Specific amino acid substitutions designated to groups according to WHO/ECDC guidelines are indicated on the figure, and the circular coloured outer strip around the tree represents the assigned groups based on amino acid substitutions defined in the WHO/ECDC guidelines, according to the colour legend. Within the tree, the group labels represent the 11 phylogenetic groups that were assigned to their respective samples according to their classification based on references (coloured names) and the support of nodes by posterior probability values. Group ‘X’ clustered together in a separate cluster from the other groups. Groups ‘HAX’ and ‘HAY’ contain samples that could not be classified. Posterior probability values are indicated on key nodes that separate groups, and are coloured red if below 0.5. The size of the blue discs on nodes represents the posterior probability scaled between 0.5 and 1. The scale bar represents the mean number of substitutions per site.
Fig. 2.
Fig. 2.
Phylogenetic tree based on the whole genome. Coloured names indicate additional references selected from ECDC reports and nextstrain.org. Coloured rings around the tree represent classification results for the eight segments separately (Fig. 2 for the HA gene, and Figs S2–S8 for the seven other genes). Group ‘X’ clustered together in a separate cluster from the other phylogenetic groups. Groups ‘WGX’ and ‘WGY’ contain samples that could not be classified. Groups labelled with the segment name and a single letter (e.g. PB1X) similarly represent any remaining samples that could not be confidently assigned into phylogenetic groups according to their segment trees (Figs S2–S8). Within the tree, the group labels represent the phylogenetic groups that were assigned to their respective samples according to their classification based on references (coloured names) and the support of nodes by posterior probability values. Posterior probability values are indicated on key nodes that separate phylogenetic groups. The size of the blue discs on nodes represents the posterior probability scaled between 0.5 and 1. The scale bar represents the mean number of substitutions per site.
Fig. 3.
Fig. 3.
Time-resolved overview of influenza samples from the Belgian 2016–2017 outbreak season in the context of globally circulating influenza strains based on an in-house Nextstrain instance using only whole-genome sequences. Green- and yellow-coloured dots represent ILI and SARI samples sequenced in this study, respectively. Blue coloured dots represent GISAID samples. If an ancestor only included GISAID sequences, these nodes were collapsed for better visualization with the size of such nodes proportional to the number of included samples. Phylogenetic groups based on the whole genome (Fig. 2) are indicated around the tree. The branch lengths correspond to the sampling date of the sample. In case of grouped GISAID samples, the sampling date of the latest sample is used.
Fig. 4.
Fig. 4.
Phylogenetic tree based on the whole-genome annotated patient data for which significant associations with phylogenetic groups were detected. Coloured taxon labels indicate additional references selected from ECDC reports and nextstrain.org. Coloured rings around the tree represent patient data, including the surveillance system, sex and sampling period, for samples where this information was available. Around the outside of these strips, the presence (filled circle) or absence (empty circle) of reassorted genomes is indicated based on the consensus of both manual inspection and computational analysis with GiRaF. Statistically significant results using the Fisher’s exact test with FDR correction for associations between host characteristics and sample parameters with the newly defined phylogenetic groups for the whole genome (see Fig. 2) are presented on the figure near their respective phylogenetic group. Results for individual segments and more detailed information, including the effect size and confidence interval, are presented in Table S4. The host characteristics and sample parameters for the reference genomes were excluded. Posterior probability values are indicated on key nodes that separate phylogenetic groups. The size of the blue discs on nodes represents the posterior probability scaled between 0.5 and 1. The scale bar represents the mean number of substitutions per site.

References

    1. WHO Influenza (Seasonal) Geneva: World Health Organization; 2019.
    1. Taubenberger JK, Morens DM. 1918 Influenza: The mother of all pandemics. Emerg Infect Dis. 2006;12:15–22. doi: 10.3201/eid1201.050979. - DOI - PMC - PubMed
    1. Chowell G, Bertozzi SM, Colchero MA, Lopez-Gatell H, Alpuche-Aranda C, et al. Severe respiratory disease concurrent with the circulation of H1N1 influenza. N Engl J Med. 2009;361:674–679. doi: 10.1056/NEJMoa0904023. - DOI - PubMed
    1. Webster RG, Bean WJ, Gorman OT, Chambers TM, Kawaoka Y. Evolution and ecology of Influenza A viruses. Microbiol Rev. 1992;56:152–179. doi: 10.1128/mr.56.1.152-179.1992. - DOI - PMC - PubMed
    1. Mosnier A, Caini S, Daviaud I, Nauleau E, Bui TT, et al. Clinical characteristics are similar across type A and B influenza virus infections. PLoS One. 2015;10:e0136186. doi: 10.1371/journal.pone.0136186. - DOI - PMC - PubMed

Publication types

MeSH terms

Substances