. 2021 Sep;10(11):e12137.
doi: 10.1002/jev2.12137.

Small extracellular vesicles released by infused mesenchymal stromal cells target M2 macrophages and promote TGF-β upregulation, microvascular stabilization and functional recovery in a rodent model of severe spinal cord injury

Affiliations

Small extracellular vesicles released by infused mesenchymal stromal cells target M2 macrophages and promote TGF-β upregulation, microvascular stabilization and functional recovery in a rodent model of severe spinal cord injury

Masahito Nakazaki et al. J Extracell Vesicles. 2021 Sep.

Abstract

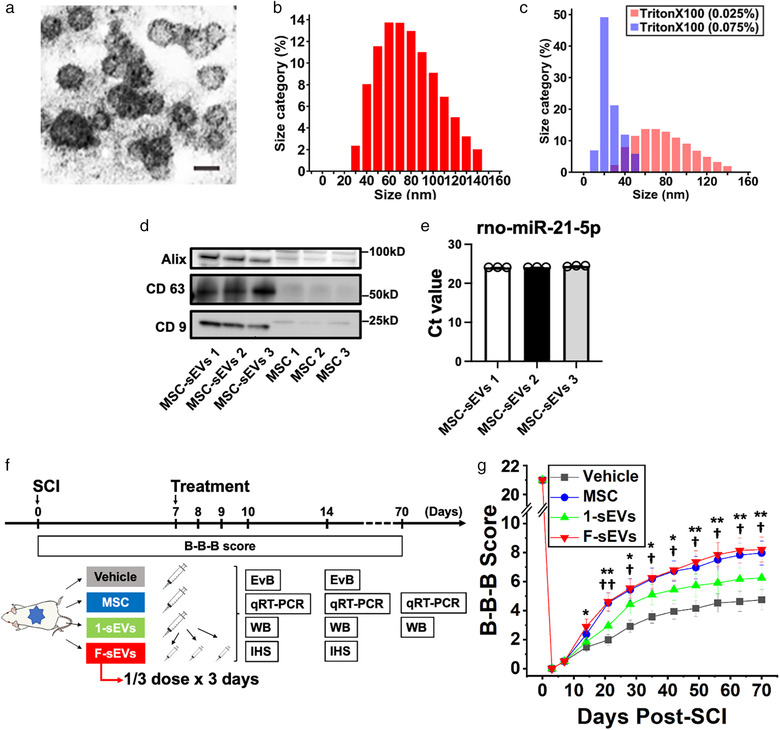
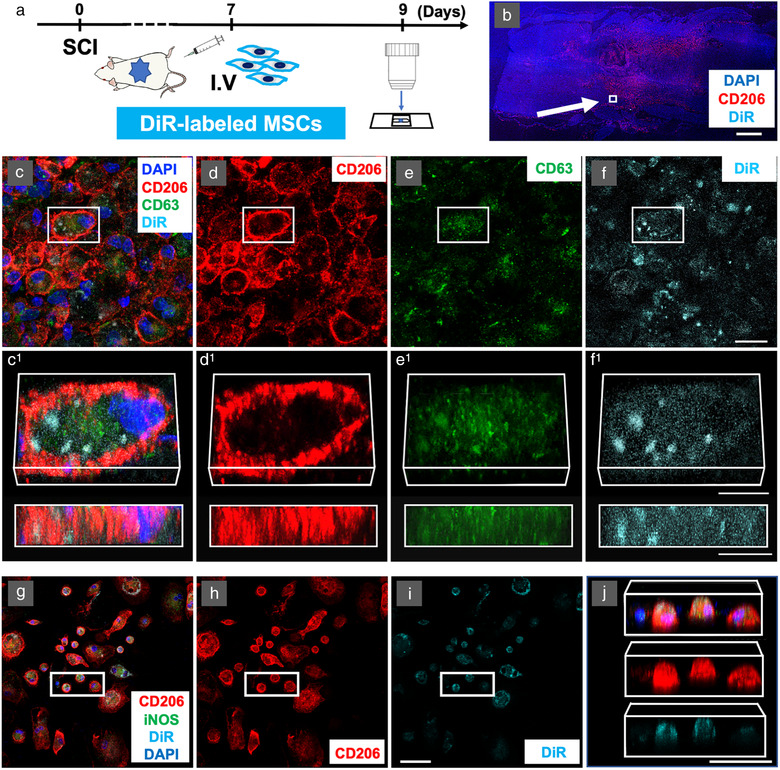
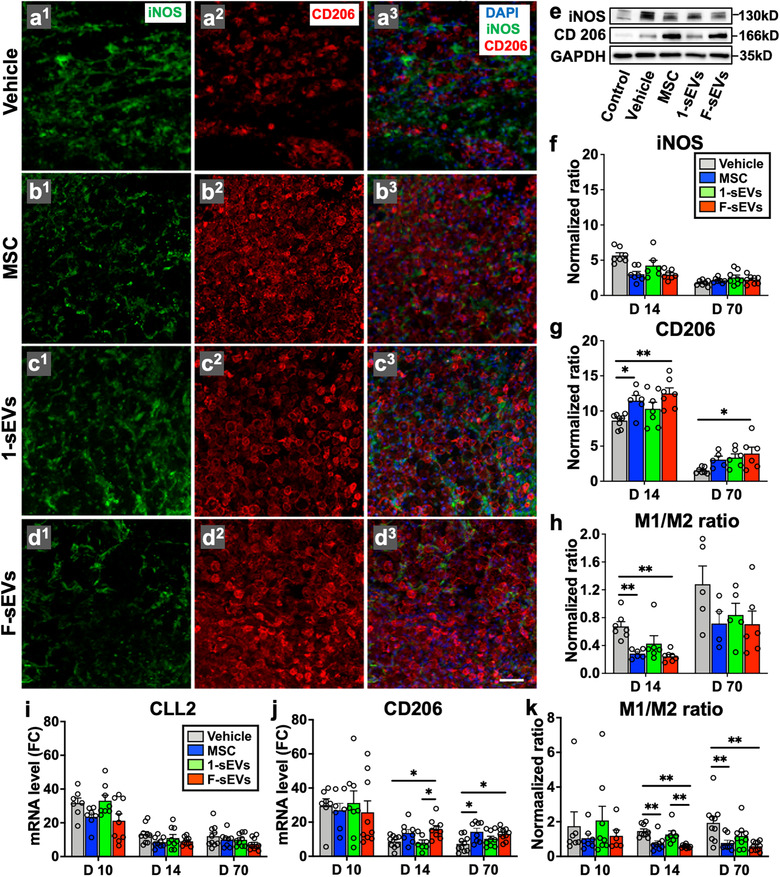
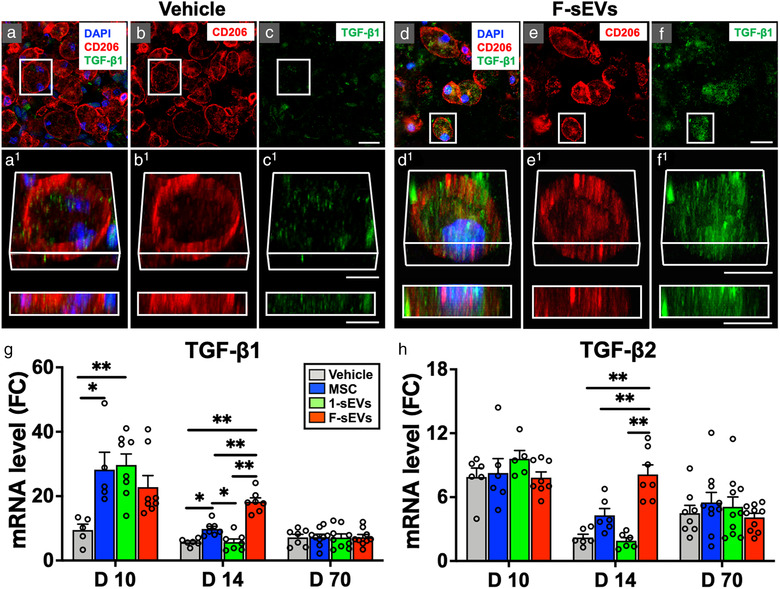
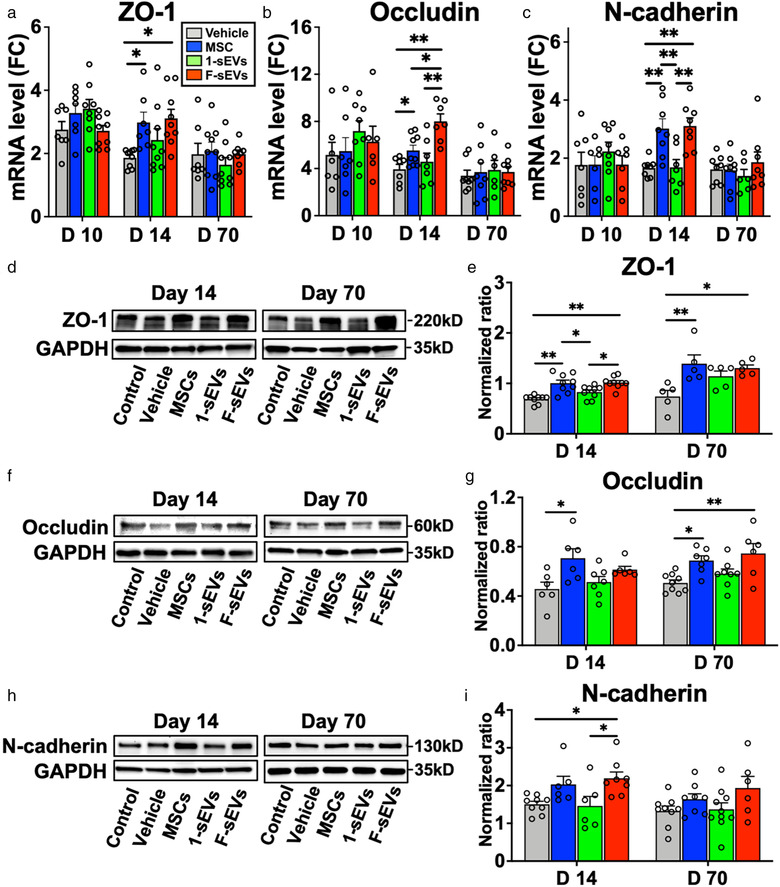
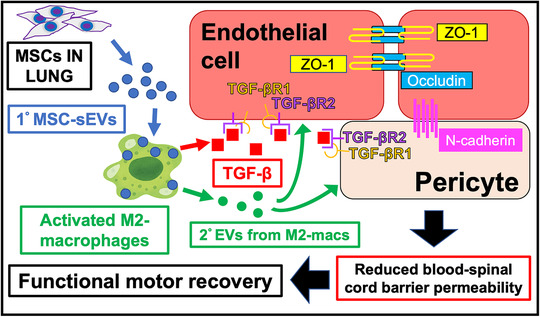
Intravenous (IV) infusion of bone marrow-derived mesenchymal stem/stromal cells (MSCs) stabilizes the blood-spinal cord barrier (BSCB) and improves functional recovery in experimental models of spinal cord injury (SCI). Although IV delivered MSCs do not traffic to the injury site, IV delivered small extracellular vesicles (sEVs) derived from MSCs (MSC-sEVs) do and are taken up by a subset of M2 macrophages. To test whether sEVs released by MSCs are responsible for the therapeutic effects of MSCs, we tracked sEVs produced by IV delivered DiR-labelled MSCs (DiR-MSCs) after transplantation into SCI rats. We found that sEVs were released by MSCs in vivo, trafficked to the injury site, associated specifically with M2 macrophages and co-localized with exosome markers. Furthermore, while a single MSC injection was sufficient to improve locomotor recovery, fractionated dosing of MSC-sEVs over 3 days (F-sEVs) was required to achieve similar therapeutic effects. Infusion of F-sEVs mimicked the effects of single dose MSC infusion on multiple parameters including: increased expression of M2 macrophage markers, upregulation of transforming growth factor-beta (TGF-β), TGF-β receptors and tight junction proteins, and reduction in BSCB permeability. These data suggest that release of sEVs by MSCs over time induces a cascade of cellular responses leading to improved functional recovery.

Keywords: blood-spinal cord barrier; exosomes; macrophages; mesenchymal stem/stromal cells; small extracellular vesicles; spinal cord injury; transforming growth factor-beta.


Conflict of interest statement

The authors report no competing interests.

Figures

FIGURE 1
FIGURE 1
Experimental protocol, characterization of MSC‐sEVs, and effects of MSC‐derived sEVs infusion on functional recovery. a, Representative electron microscopic image of an sEV preparation showing the sizes and morphology of particles. Scale bar = 100 nm b, Histogram of the size distribution of sEVs. c, Histograms of size distribution of sEVs exposed with 0.025% Triton X‐100 (red) and 0.075% Triton X‐100 (blue). d, Expressions of CD 9, CD 63, and Alix in sEVs derived from MSCs were evaluated by western blotting and compared to equal concentrations of proteins from their MSCs. e, Micro RNA 21 was detected within MSC‐sEVs tested with primers targeting for rno‐miR‐21‐5p. The threshold cycle (Ct value) was evaluated using three exosome samples. f, Experimental protocol. Animals were randomly assigned to one of 4 treatment groups: 1) vehicle (Vehicle), 2) MSCs (MSC), 3) MSC‐sEVs with a single dosing protocol (1‐sEVs), and 4) MSC‐sEVs‐infused rats with fractionated dosing protocol over the course of 3 days (F‐sEVs). g, B‐B‐B locomotor scores of contused rats infused with Vehicle (black squares), MSCs (blue circles), or MSC‐derived sEVs delivered in a single dose (1‐sEVs green upward triangles) or three fractionated doses over 3 days (F‐sEVs red downward triangles). Values are presented as means ± SEM. Repeated‐ measures two‐way ANOVA followed by Sidak post hoc tests were conducted. *: P < .05 between F‐sEVs group and Vehicle group, **: P < .01 between F‐sEVs group and Vehicle group, †: P < .05 between MSC group and Vehicle group, ††; P < .01 between MSC group and Vehicle group. MSCs: mesenchymal stem/stromal cells, B‐B‐B score: Basso–Beattie–Bresnahan locomotor scale score, EvB: Evans blue leakage analysis, qRT‐PCR: quantitative reverse transcription‐polymerase chain reaction, WB: Western blotting, IHS: Immunohistochemical staining. Particle sizes, stability to detergent degradation, and tetraspanin expression were consistent with sEVs. MSC: mesenchymal stem/stromal cell, sEVs: small extracellular vesicles, MSC‐sEVs: small extracellular vesicles derived from MSCs
FIGURE 2
FIGURE 2
M2 macrophages take up DiR‐labeled MSC‐sEVs in vivo at the lesion site after intravenous infusion of DiR‐labeled MSCs and in vitro after exposure to DiR‐labeled MSC‐sEVs. a, Experimental protocol for tracking the MSC‐sEVs released from IV infused DiR‐labeled MSCs in vivo. b, Confocal micrographs of a representative region of a frozen sectioned contused spinal cord harvested 48 h after IV infusion of DiR‐labeled MSCs, immunostained with antibodies directed against M2 macrophage marker CD206 (red) and DAPI (blue). Scale bars indicate 100 μm. c‐f, Images of a representative region of the white square in the figure. c, immunostained with antibodies directed against CD206 (red) and exosomes marker CD63 (green) counterstained with DAPI (blue) with DiR visualized as cyan. Images from left to right show the same area showing fluorescence channels for c, CD206, CD63, DAPI, & DiR, d, CD206, e, CD63, and f, DiR. Images in c1‐f1 show enlarged images of the boxed area above rotated and illustrated in 3D. Note the strong co‐localization of DiR fluorescence with CD206, suggesting that the majority of these DiR hotspots were localized within CD206+ M2 macrophages. Scale bars in c‐f and c1‐f1 indicate 20 μm and 10 μm, respectively. Note that although the labelled MSCs themselves were not detected at the lesion site DiR‐ labelled hotspots co‐staining with exosome markers were. g‐j Confocal micrographs of a representative region of rat bone marrow macrophage cultures stimulated to induce a phagocytic M2 phenotype with IL‐4 and central myelin enriched fraction and fixed 24 h after the addition of DiR‐labeled MSC‐sEVs at pH = 6. Cultures were stained with antibodies directed against CD206 (red), iNOS (green), and counterstained with DAPI (blue) with DiR fluorescence visualized as Cyan. Images from left to right show: (g) CD206, iNOS, DAPI, & DiR, (h) CD206 & DiR, (i) DiR only, and (j) rotated 3D reconstructions of the boxed area indicated in (g‐j) containing 3 CD206+ presumptive M2 macrophages and one CD206 and iNOS presumptive M0 macrophage (left). Note that the two cells in the centre of the group appear largely filled with DiR fluorescence hotspots, while both the cells on the left and on the right do not appear to have taken up significant quantities of exosomes. Scale bars in (i) and (j) indicate 50 μm. MSC: mesenchymal stem/stromal cell, MSC‐sEVs: small extracellular vesicles derived from MSCs, DiR: DilC18(7);1,1′‐dioctadecyl‐3,3,3′,3′‐tetramethylindotricbocyanine iodide, DAPI: 4′,6‐diamidino‐2‐phenylindole, iNOS: inducible nitric oxide synthase
FIGURE 3
FIGURE 3
Intravenous infusion of MSCs and fractionated dosing of MSC‐sEVs promote M2 macrophage polarization in the injured spinal cord. a1‐3 ‐d1‐3, Confocal micrographs of a representative region of a frozen sectioned contused spinal cord harvested 7 days after the treatment (14‐day post‐SCI), immunostained with antibodies directed against Type M1 macrophage marker iNOS (green), Type M2 macrophage marker CD206 (red), and counterstained with DAPI (blue). Scale bar in a indicates 50 μm. e, Representative images of western blot of the lesion site harvested at 7 days after the treatment (14‐day post‐SCI), immunostained with antibodies directed against Type M1 macrophage marker iNOS, Type M2 macrophage marker CD206, and GAPDH as a control. f and g, Graphs of quantitative density analysis for western blot results for iNOS (f) and CD 206 (g) in each treatment condition normalized to control spinal cords. h, M1/M2 macrophage protein expression ratios calculated using quantitative density analysis of western blot data for iNOS and CD206. i and j, qRT‐PCR analysis of relative mRNA expression levels for M1 macrophage marker CLL2 (i) and M2 macrophage marker CD206 (j). [ΔCT was calculated against the endogenous control (GAPDH), and ΔΔCT (mRNA level) was calculated against the ΔCT of the control.] k, M1/M2 macrophage mRNA ratios calculated by using qRT‐PCR results for CLL2 and CD206. Values are presented as means ± SEM. A 1‐way ANOVA followed by the Tukey‐Kramer test or the Kruskal‐Wallis test followed by the Steel‐Dwass test was conducted. *: < .05, **: P < .01, SCI: spinal cord injury, MSC: mesenchymal stem/stromal cell, MSC‐sEVs: small extracellular vesicles derived from MSCs, iNOS: inducible nitric oxide synthase, DAPI: 4′,6‐diamidino‐2‐phenylindole, GAPDH: Glyceraldehyde 3‐phosphate dehydrogenase, CCL2: C–C motif chemokine ligand 2, ΔCT: delta‐cycle threshold, qRT‐PCR: quantitative reverse transcription‐polymerase chain reaction, FC: fold change
FIGURE 4
FIGURE 4
Both infusion of MSCs and fractionated dosing of MSC‐sEVs upregulate TGF‐β in the injured spinal cord. a‐f, Confocal micrographs of representative regions of frozen sectioned contused spinal cord harvested 14‐day post‐SCI and 7 days after the treatment with Vehicle (a‐c, left) or fractioned MSC‐sEVs (d‐f, right), immunostained with antibodies directed against Type M2 macrophage marker CD206 (red), and TGF‐β1 (green), and counterstained with DAPI (blue). Images in each group (a‐c, and d‐f) from left to right show the same area with fluorescence channels for CD206, TGF‐β1, & DAPI (a and f), CD206 (b and e), and TGF‐β1 (c and f). Note that TGF‐β1 staining is strongly expressed and localized within macrophages staining positive for the M2 type marker in the F‐sEVs group, while such staining is negligible in the Vehicle group. Scale bars indicate 20 μm (c and f) and 10 μm (c1 and f1). g and h, Graphs illustrating the qRT‐PCR analysis of the relative expression of mRNAs for TGF‐β1 (g) and TGF‐β2 (h). [The ΔCT was calculated against the internal control (GAPDH), and ΔΔCT (mRNA level) was calculated against the ΔCT of the control.] Note the transient upregulation of TGF‐β1 at 10‐day post‐ SCI in the 1‐sEVs treatment group, compared with the upregulation of TGF‐β1 and TGF‐β2 expression in both the MSC and the F‐sEVs treatment groups at 14‐day post‐SCI. Values are presented as means ± SEM. A 1‐way ANOVA followed by the Tukey‐Kramer test or the Kruskal‐Wallis test followed by the Steel‐Dwass test was conducted. *: < .05, **: P < .01, TGF: transforming growth factor, MSC: mesenchymal stem/stromal cell, MSC‐sEVs: small extracellular vesicles derived from MSCs, TGF‐β: transforming growth factor‐beta, DAPI: 4′,6‐diamidino‐2‐phenylindole, qRT‐PCR: quantitative reverse transcription‐polymerase chain reaction, ΔCT: delta‐cycle threshold, SCI: spinal cord injury, FC: fold change
FIGURE 5
FIGURE 5
Both infusion of MSCs and fractionated dosing of MSC‐sEVs upregulate TGF‐β receptors in the injured spinal cord. a‐d, Confocal micrographs of a representative region of a frozen sectioned contused spinal cord harvested 7 days after the treatment with fractioned MSC‐sEVs (14‐day post‐SCI), immunostained with antibodies directed against endothelial cell marker CD31 (red), PDGFRβ (purple), and TGF‐βR2 (green), and counterstained with DAPI (blue). Images in each group from left to right show the same area with fluorescence channels for CD31, PDGFRβ, TGF‐βR2, & DAPI (a), CD31 (b), PDGFRβ (c), and TGF‐βR2 (d). Note that TGF‐βR2 is localized along capillaries. Scale bar indicates 20 μm (d) and 10 μm (d1). e and f, Graphs illustrating qRT‐PCR analysis of the relative expression of mRNAs for TGF‐βR1(e) and TGF‐βR2(f). [The ΔCT was calculated against the internal control (GAPDH), and ΔΔCT (mRNA level) was calculated against the ΔCT of the control.] g, Representative images of western blots from lesioned tissue harvested 7 days after the onset of treatment (14‐day post‐SCI), showing levels of TGF‐βR2 protein. h, Quantitative density analysis of western blot results for TGF‐βR2. The normalized ratio was calculated relative to intact controls. Note the upregulation of TGF‐βR1, TGF‐βR2, and increased TGF‐βR2 protein expression in both the MSC and F‐sEVs treatment groups at 14‐day post‐SCI. Values are presented as means ± SEM. A 1‐way ANOVA followed by the Tukey‐Kramer test or the Kruskal‐Wallis test followed by the Steel‐Dwass test was conducted. *: < .05, **: P < .01, MSC: mesenchymal stem/stromal cell, MSC‐sEVs: small extracellular vesicles derived from MSCs, SCI: spinal cord injury, PDGFRβ: platelet‐derived growth factor receptor‐beta, TGF‐βR: transforming growth factor‐beta receptor, ΔCT: delta‐cycle threshold, GAPDH: Glyceraldehyde 3‐phosphate dehydrogenase, DAPI: 4′,6‐diamidino‐2‐phenylindole, FC: fold change
FIGURE 6
FIGURE 6
Both infusion of MSCs and fractionated dosing of MSC‐sEVs reduce BSCB leakage in the injured cord. a, Photographs illustrating the typical appearances of spinal cords of Evans blue injected animals from left to right for the Vehicle‐treated group, MSC‐treated group, 1‐sEV‐treated group, and F‐sEV‐treated group harvested at 10‐day post‐SCI (upper row) and 14‐day post‐SCI (lower row). Note that while no visible differences were apparent between dye extravasation levels for different treatment conditions at 10‐day post‐SCI, blue dye at the lesion site was noticeably diminished in both the MSC and F‐sEV treated conditions compared to the 1‐sEVs or Vehicle treatment conditions at 14‐day post‐SCI. Scale bar indicates 3 mm. b and c, Quantification of EvB concentrations (b) and total dye content (c) of the entire 1 cm segment surrounding the lesion at 10‐ and 14‐day post‐SCI. Note: EvB concentration and total dye content of lesioned tissue were significantly reduced in both the MSC treated and F‐sEV treated compared to the Vehicle treated condition at 14‐day post‐SCI. Values are presented as means ± SEM. A 1‐way ANOVA followed by the Tukey‐Kramer test or the Kruskal‐Wallis test followed by the Steel‐Dwass test was conducted. *: < .05, **: P < .01, MSC: mesenchymal stem/stromal cell, MSC‐sEVs: small extracellular vesicles derived from MSCs, SCI: spinal cord injury, EvB: Evans blue
FIGURE 7
FIGURE 7
Both infusion of MSCs and fractionated MSC‐sEVs dosing promote increases of tight and adherens junction proteins. a‐c, Graphs showing qRT‐PCR analysis of relative mRNA expression levels of ZO‐1 (a), occludin (b), and N‐cadherin (c). [ΔCT was calculated against GAPDH control, and ΔΔCT (mRNA level) was calculated against the ΔCT of the control.] Note significant increases were observed in ZO‐1, occludin, and N‐cadherin mRNA in both the MSC and F‐sEVs treatment groups relative to the Vehicle groups at 14‐day post‐SCI. d‐i, Representative images of western blots and quantitative density analysis of the lesion sites harvested at 14‐ and 70‐day post‐SCI, showing levels of ZO‐1 (d and e), occludin (f and g), and N‐cadherin (h and i). Note that levels ZO‐1, occludin, and N‐cadherin were all significantly increased in the MSC treated condition and levels of ZO‐1 and N‐cadherin levels were significantly increased in the F‐sEVs treatment condition relative to the Vehicle treated condition at 14‐day post‐SCI. Animals in both the MSC and F‐sEVs treatment conditions also showed increases in ZO‐1 and occludin protein levels at 70‐day post‐SCI. Values are presented as means ± SEM. A 1‐way ANOVA followed by the Tukey‐Kramer test or the Kruskal‐Wallis test followed by the Steel‐Dwass test was conducted. *: < .05, **: P < .01, MSC: mesenchymal stem/stromal cell, MSC‐sEVs: small extracellular vesicles derived from MSCs, ΔCT: delta‐cycle threshold, SCI: spinal cord injury, GAPDH: Glyceraldehyde 3‐phosphate dehydrogenase, FC: fold change
FIGURE 8
FIGURE 8
Schematic representation of the proposed mechanisms underlying the therapeutic effects of MSC‐sEVs on the blood‐spinal cord barrier (BSCB) in spinal cord injury. Circulating MSC‐sEVs (1° MSC‐sEVs: blue circles) produced either by release of sEVs from IV infused MSCs trapped in the lungs or by repeated IV dosing of MSC‐sEVs are taken up by M2 macrophages in the lesion. sEVs uptake by M2 macrophages promotes sustained M2 macrophage polarization and increased TGF‐β (red squares) production. TGF‐β or TGF‐β surface expressing second order EVs (2° EVs) released by the MSC‐sEV‐stimulated M2 macrophages (green circles) bind to TGF‐βR2 on endothelial cells and/or pericytes, to complex with TGF‐βR1 with thereby enhance avidity as a surface array to activate downstream pathways, which lead to upregulation of junctional proteins ZO‐1, occludin, and N‐cadherin contributing to restoration of BSCB integrity. The restored BSCB provides a more favourable environment for neuronal functioning and promotes greater recovery of locomotor functioning. MSCs: mesenchymal stem/stromal cells, MSC‐sEVs: small extracellular vesicles derived from MSCs, M2‐macs: M2 macrophages, 1° MSC‐sEVs: first order MSC‐sEVs, 2° EVs: second order extracellular vesicles released from activated M2 macrophages, TGF‐β: transforming growth factor‐beta, TGF‐βR1 or 2: transforming growth factor‐beta receptor 1 or 2, BSCB: blood spinal cord barrier

References

    1. Basso, D. M., Beattie, M. S., & Bresnahan, J. C. (1996). Graded histological and locomotor outcomes after spinal cord contusion using the NYU weight‐drop device versus transection. Experimental Neurology, 139:244–256. - PubMed
    1. Beck, K. D., Nguyen, H. X., Galvan, M. D., Salazar, D. L., Woodruff, T. M., & Anderson, A. J. (2010). Quantitative analysis of cellular inflammation after traumatic spinal cord injury: Evidence for a multiphasic inflammatory response in the acute to chronic environment. Brain, 133, 433–447. - PMC - PubMed
    1. Bradbury, E. J., Moon, L. D., Popat, R. J., King, V. R., Bennett, G. S., Patel, P. N., Fawcett, J. W., & McMahon, S. B. (2002). Chondroitinase ABC promotes functional recovery after spinal cord injury. Nature, 416, 636–640. - PubMed
    1. Chen, C., Skog, J., Hsu, C. H., Lessard, R. T., Balaj, L., Wurdinger, T., Carter, B. S., Breakefield, X. O., Toner, M., & Irimia, D. (2010). Microfluidic isolation and transcriptome analysis of serum microvesicles. Lab on A Chip, 10, 505–511. - PMC - PubMed
    1. Chen, H. J., Li Yim, A. Y. F., Griffith, G. R., de Jonge, W. J., Mannens, M., Ferrero, E., Henneman, P., & de Winther, M. P. J. (2019). Meta‐analysis of in vitro‐differentiated macrophages identifies transcriptomic signatures that classify disease macrophages in vivo. Frontiers in Immunology, 10, 2887. - PMC - PubMed

Publication types

Substances