. 2022 Jan;42(1):233-248.
doi: 10.1111/liv.15049. Epub 2021 Sep 16.

The protease-inhibitor SerpinB3 as a critical modulator of the stem-like subset in human cholangiocarcinoma

Affiliations

The protease-inhibitor SerpinB3 as a critical modulator of the stem-like subset in human cholangiocarcinoma

Margherita Correnti et al. Liver Int. 2022 Jan.

Abstract

Background and aims: Cholangiocarcinoma (CCA) is a form of primary liver cancer with limited therapeutic options. Recently, cancer stem cells (CSCs) have been proposed as a driving force of tumour initiation and dissemination, thus representing a crucial therapeutic target. The protease inhibitor SerpinB3 (SB3) has been identified in several malignancies including hepatocellular carcinoma. SB3 has been involved in the early events of hepatocarcinogenesis and is highly expressed in hepatic progenitor cells and in a mouse model of liver progenitor cell activation. However, only limited information on the possible role of SB3 in CCA stem-like compartment is available.

Methods: Enrichment of CCA stem-like subset was performed by sphere culture (SPH) in CCA cell lines (CCLP1, HUCCT1, MTCHC01 and SG231). Quantitative RT-PCR and Western blotting were used to detect SB3 in both SPH and parental monolayer (MON) cells. Acquired CSC-like features were analysed using an endogenous and a paracrine in vitro model, with transfection of SB3 gene or addition of recombinant SB3 to cell medium respectively. SB3 tumorigenic role was explored in an in vivo mouse model of CCA by subcutaneous injection of SB3-transfected MON (MONSB3+ ) cells in immune-deficient NOD-SCID/IL2Rgnull (NSG) mice. SB3 expression in human CCA sections was investigated by immunohistochemistry. Overall survival (OS) and time to recurrence (TTR) analyses were carried out from a transcriptome database of 104 CCA patients.

Results: SB3, barely detected in parental MON cells, was overexpressed in the same CCA cells grown as 3D SPH. Notably, MONSB3+ showed significant overexpression of genes associated with stemness (CD24, CD44, CD133), pluripotency (c-MYC, NOTCH1, STAT3, YAP, NANOG, BMI1, KLF4, OCT4, SOX2), epithelial mesenchymal transition (β-catenin, SLUG) and extracellular matrix remodelling (MMP1, MMP7, MMP9, ADAM9, ADAM10, ADAM17, ITGB3). SB3-overexpressing cells showed superior spherogenic capacity and invasion ability compared to control. Importantly, MONSB3+ exhibited activation of MAP kinases (ERK1/2, p38, JNK) as well as phosphorylation of NFκB (p65) in addition to up-regulation of the proto-oncogene β-catenin. All these effects were reversed after transient silencing of SB3. According to the in vitro finding, MONSB3+ cells retained high tumorigenic potential in NSG mice. SB3 overexpression was observed in human CCA tissues and analysis of OS as well as TTR indicated a worse prognosis in SB3+ CCA patients.

Conclusion: These findings indicate a SB3 role in mediating malignant phenotype of CCA and identify a new therapeutic target.

Keywords: SerpinB3; cancer stem cells; cholangiocarcinoma; invasion.


Conflict of interest statement

The authors declare no competing interests.

Figures

FIGURE 1
FIGURE 1
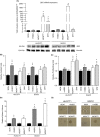
(A) Relative expression of transcript‐encoding SerpinB3 (SB3) in sphere (SPH) and monolayer (MON) of CCLP1, HUCCT1, MTCHC01 and SG231 cells. GAPDH was used as the internal control. All mRNA levels are presented as 2^−ΔCt. Data are expressed as mean ±SEM (P value vs MON by Student t test, *P ≤ .05, **P ≤ .01, ***P ≤ .001). (B) Western blot analysis was used to determine SB3 in CCLP1, HUCCT1, MTCHC01 and SG231 cells. Equal loading was evaluated using anti‐Vinculin antibody
FIGURE 2
FIGURE 2
(A) Comparison of paracrine (+rhSB3) and endogenous (MONSB3+) effect on the expression of SB3 (SB3) mRNA in HUCCT1 and SG231 cells. GAPDH was used as the internal control. Not treated monolayer (MON), monolayer transfected with control vector (MONCTR) as controls. Sphere (SPH) condition was also evaluated. All mRNA levels are presented as fold changes normalized to 1 (mean expression of MON or MONCTR respectively). Data are expressed as mean ± SEM (P value vs MON or MONCTR, respectively, by Student t test, *P ≤ .05, *** P ≤ .001). Below, Western blot analysis was used to determine SB3 in +rhSB3 and MONSB3+ condition for both HUCCT1 and SG231 cells. (B) Invasion assay using Matrigel‐coated transwells. Cells counted and normalized to migrated MON or MONCTR respectively (n = 3). Mean ±SEM (P value vs MON or MON CTR by Student's t test, *P ≤ .05, **P ≤ .01). (C) Cell proliferation analysis evaluated by BrdU incorporation using a colorimetric immunoassay. Absorbance values were normalized to MON or MONCTR respectively (n = 3). Mean ± SEM (P value vs MON or MON CTR by Student's t test, *P ≤ .05, **P ≤ .01, ***P ≤ .001). (D) SB3 paracrine and endogenous effect on CCA‐SPH volume. Mean ± SEM (P value vs MON or MONCTR by Student's t test, *P ≤ .05, **P ≤ .01, ***P ≤ .001). (E) Representative images of CCA SPH are shown (original magnification 40×, scale bar 50 μmol/L)
FIGURE 3
FIGURE 3
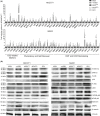
(A) Relative expression of transcript‐encoding liver CSC‐like, Self‐Renewal, Pluripotency, Epithelial Mesenchymal Transition (EMT) as well as Extracellular Matrix (ECM) remodelling genes in SB3 pretreated (rhSB3) or transfected (MON+SB3) of both HUCCT1 and SG231 cells. GAPDH was used as an internal control. Not treated monolayer (MON), monolayer transfected with control vector (MONCTR) as control. Sphere (SPH) condition was also evaluated. All mRNA levels are presented as fold changes normalized to 1 (mean expression of MON or MONCTR respectively). Data are expressed as mean ± SEM (P value vs MON or MONCTR, respectively, by Student t test, *P ≤ .05, **P ≤ .01***P ≤ .001). (B) Immunoblot analysis in SB3 monolayer (MONSB3+) and control vector (MONCTR) in both transfected HUCCT1 and SG231 cells. Sphere (SPH) condition was also tested. Phospho ERK1/2, total ERK1, phospho p38, total p38, phospho JNK, total JNK1, c‐MYC, phospho NFKB p65, total NFKB p65, NOTCH1, MMP9 and β‐catenin. Vinculin immunoblot was performed to ensure equal loading
FIGURE 4
FIGURE 4
SB3 tumorigenic capacity in NSG mice. A) Tumour growth kinetic (n = 10), (B) weight of generated tumours at 15 weeks after subcutaneous injection into NSG mice of 1000 SPH, MONSB3+ and MONCTR isolated cells as monitored by weekly palpation. Mean ± SEM (P value vs MONCTR by Student's t test, * P ≤ .05, *** P ≤ .001). (C) Representative images of SPH, MONSB3+ and MONCTR‐derived tumours. (D) qRT‐PCR arrays focused on liver cancer pathways. Heatmap of different tumour samples based on the expression of 84 genes. Gene expression levels are expressed in colour code from green (low) to red (high) according to the colour key scale bar. Hierarchical clustering was based on complete linkage on Euclidean distances between genes (rows) or samples (columns). (E) Representative images of haematoxylin and eosin staining and of immunofluorescence for SB3 (red), MMP9 (red), CD44 (green) and NOTCH (green) on MONCTR, SPH, MONSB3+‐derived tumours in NSG mice. Original magnifications 63×. Below, quantification of the fluorescence of the analysed proteins by Axiovision software. Data were expressed as the mean of fluorescence of each protein vs Dapi measurement for each acquisition ±SEM. Statistical significance was assessed by Student t test (*P ≤ .05, **P ≤ .01***P ≤ .001)
FIGURE 5
FIGURE 5
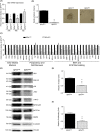
Effects of SerpinB3 silencing in CCA SPH cells (SPHSB3‐). (A) SerpinB3 (SB3) gene expression levels following siRNA transfection, presented as fold changes normalized to mean expression of siCTR SPH (SPHCTR). mRNA levels at 24, 48 and 72 hours after transfection (n = 4), Mean ±SEM (P value vs SPHCTR by Student's t test, **P ≤ .01, ***P ≤. 001 vs S). (B) Effects of SB3 silencing on CCA sphere‐volume (n = 3). Mean ± SEM (P value vs SPHCTR by Student's t test, **P ≤ .01). Representative images of CCA SPH are shown (original magnification 40×, scale bar 50 μmol/L). (C) Expression of different genes, expressed as fold changes normalized to mean expression of SPHCTR sample (n = 3). Mean ± SEM (P value vs SPHCTR by Student's t test, *P ≤ .05, **P ≤ .01, ***P ≤ .01). Gene groups are indicated at the bottom of the barograms. (D) Immunoblot of different proteins following SB3 silencing. (E) Invasion of SB3‐silenced HUCCT1 SPH was measured in modified Boyden chambers (n = 5). Mean ± SEM (P value vs SPHCTR by Student's t test, ***P ≤ .001). (F) Cell proliferation analysis evaluated by BrdU incorporation using a colorimetric immunoassay. Absorbance values were normalized to SPHCTR (n = 3). Mean ± SEM (P value vs SPHCTR by Student's t test, **P ≤ .01)
FIGURE 6
FIGURE 6
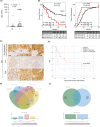
(A) Scatter dot plot of 104 tumour samples (T) vs 59 matched surrounding livers (SL) showing a significantly higher expression of SB3 mRNA in the tumours. Mann‐Whitney test (2‐tailed) was used for significance. (B) Overall survival (OS, 5 years) (left) and time to recurrence (months over 5 years) (right) for 104 CCA patients sub‐grouped based on SB3 expression. Patients were stratified with an average signal of 10 as the cut off value. Samples <10 would be ‘no/low expression’ and samples >10 would be ‘high’. With that stratification the association of SB3 mRNA expression with survival and time to recurrence was analysed Log‐rank and Gehan‐Breslow‐Wilcoxon KM curves respectively. (C) Representative SB3 low‐ and high‐grade immunohistochemical staining in the considered CCA series (n = 38). Normal bile ducts of non‐neoplastic liver parenchyma are indicated by the black arrows. (Original magnifications 20×; magnification bar = 100 µm). (D) Kaplan‐Meier of the time to recurrence (months) in CCA cases divided according to the SB3 score determined by immunohistochemistry (n = 38) (high SB3 = score 3, low SB3 = score 1‐2). Survival Curves were estimated using Kaplan‐Meier method and the differences between curves was assessed by long‐rank test. (E) Venn diagram showing the number and overlap of genes significantly positively correlated with SERPINB3 in four different CCA cohorts (Cohort#1=GSE26566, Cohort#2=GSE45001, Cohort#3=EGA00001000950, Cohort#4=TCGA database) (F) Venn diagram showing the number and overlap of genes significantly positively correlated with SERPINB3 in 10 primary iCCA tumours and 10 iCCA recurrent tumours (data from dataset GSE107102)

References

    1. Banales JM, Marin JJG, Lamarca A, et al. Cholangiocarcinoma 2020: the next horizon in mechanisms and management. Nat Rev Gastroenterol Hepatol. 2020;17(9):557‐588. - PMC - PubMed
    1. Bertuccio P, Malvezzi M, Carioli G, et al. Reply to: "Global trends in mortality from intrahepatic and extrahepatic cholangiocarcinoma". J Hepatol. 2019;71(6):1262‐1263. - PubMed
    1. Banales JM, Cardinale V, Carpino G, et al. Fouassier L and others. Expert consensus document: Cholangiocarcinoma: current knowledge and future perspectives consensus statement from the European Network for the Study of Cholangiocarcinoma (ENS‐CCA). Nat Rev Gastroenterol Hepatol. 2016;13(5):261‐280. - PubMed
    1. Yamashita T, Honda M, Nakamoto Y, et al. Discrete nature of EpCAM+ and CD90+ cancer stem cells in human hepatocellular carcinoma. Hepatology. 2013;57(4):1484‐1497. - PMC - PubMed
    1. Oikawa T. Cancer Stem cells and their cellular origins in primary liver and biliary tract cancers. Hepatology. 2016;64(2):645‐651. - PubMed

Publication types