. 2021 Oct 20;109(20):3239-3251.e7.
doi: 10.1016/j.neuron.2021.08.005. Epub 2021 Sep 2.

Rewiring of human neurodevelopmental gene regulatory programs by human accelerated regions

Affiliations

Rewiring of human neurodevelopmental gene regulatory programs by human accelerated regions

Kelly M Girskis et al. Neuron. .

Abstract

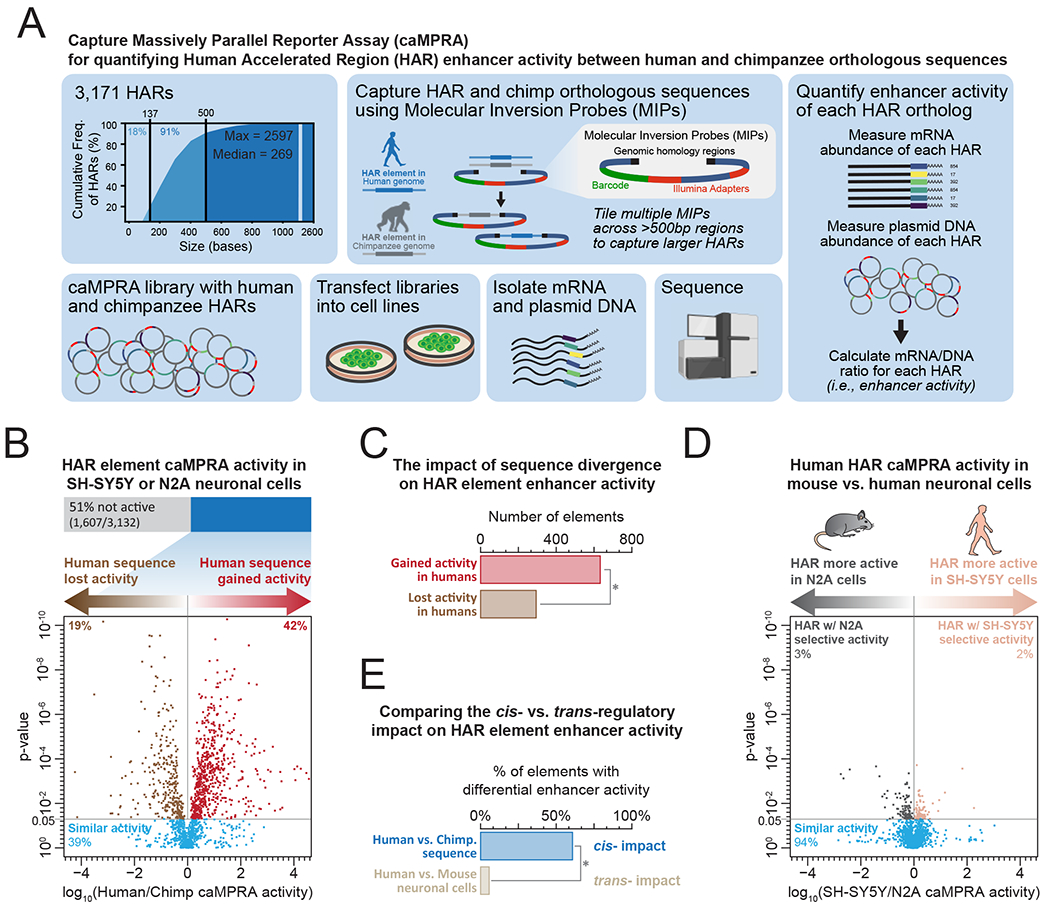
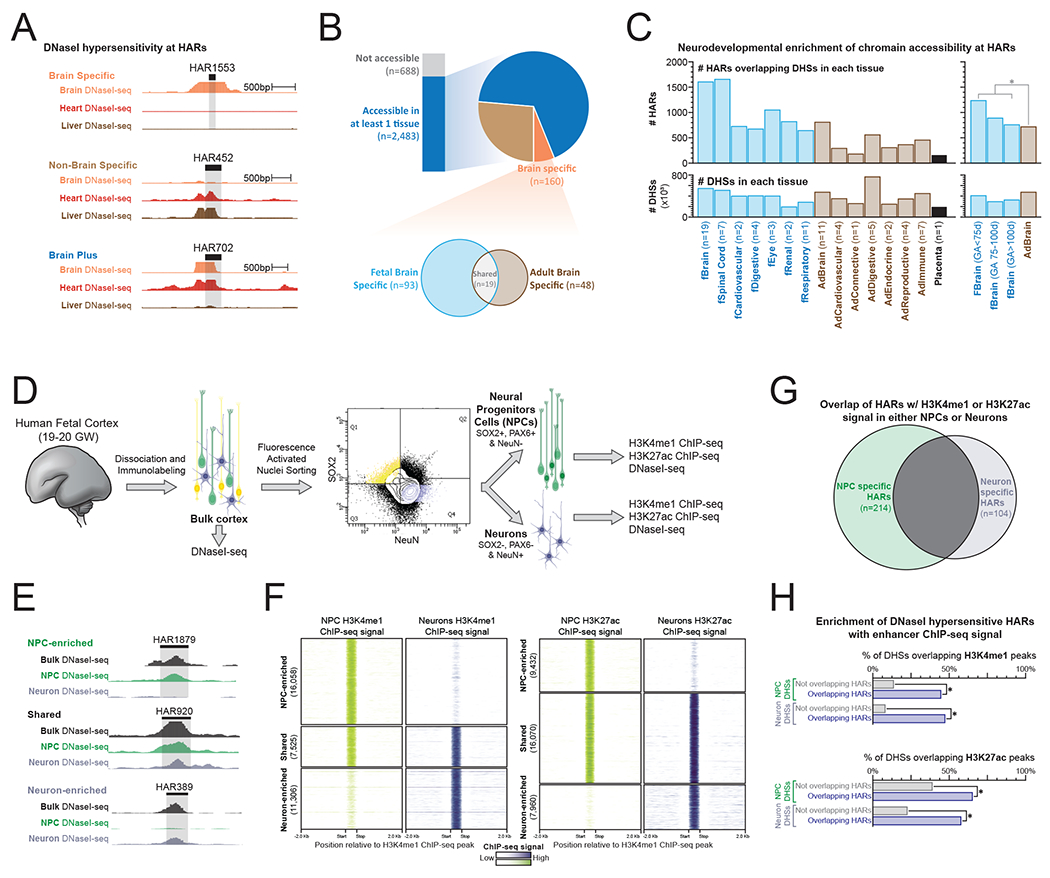
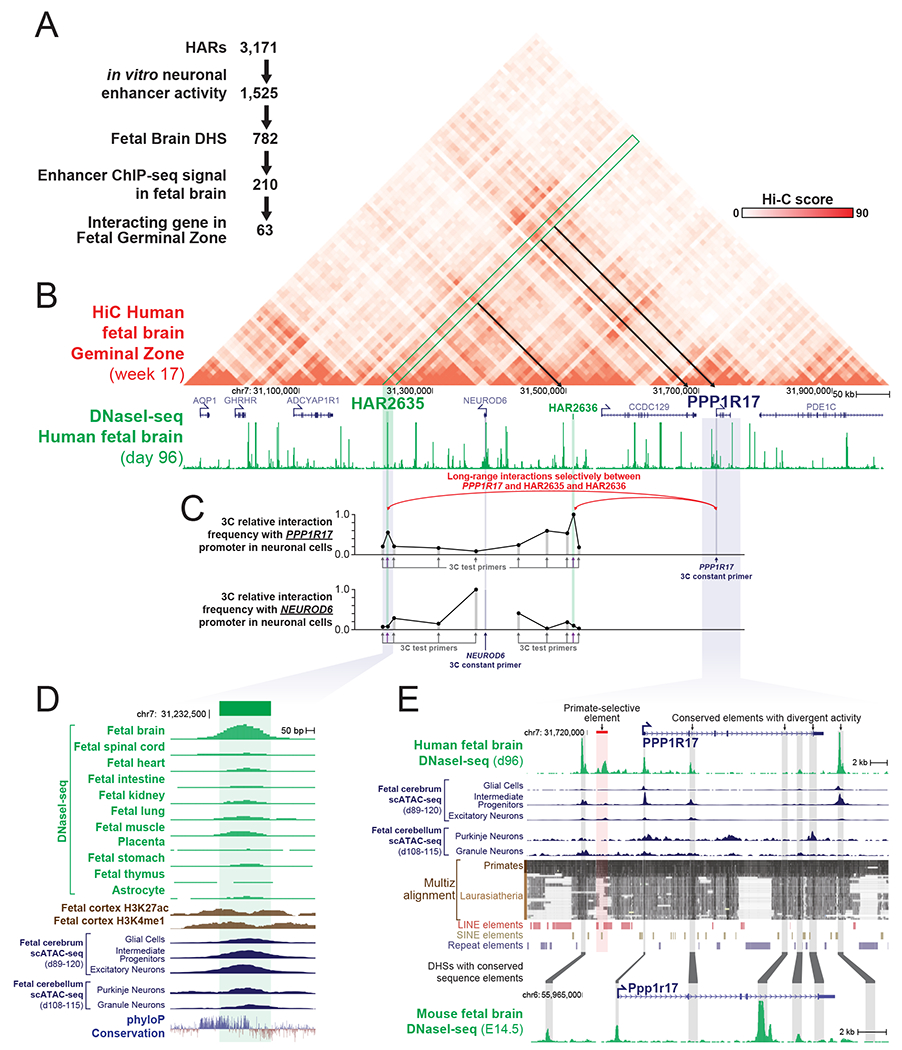
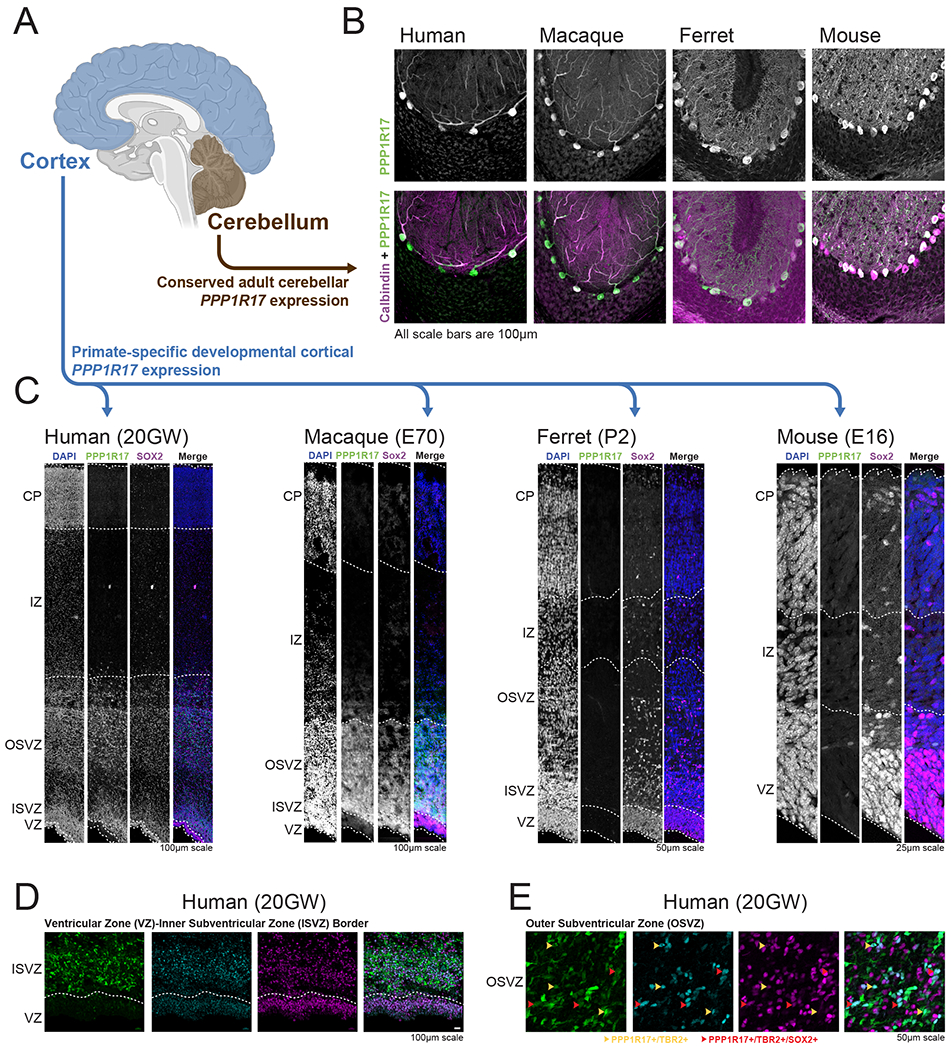
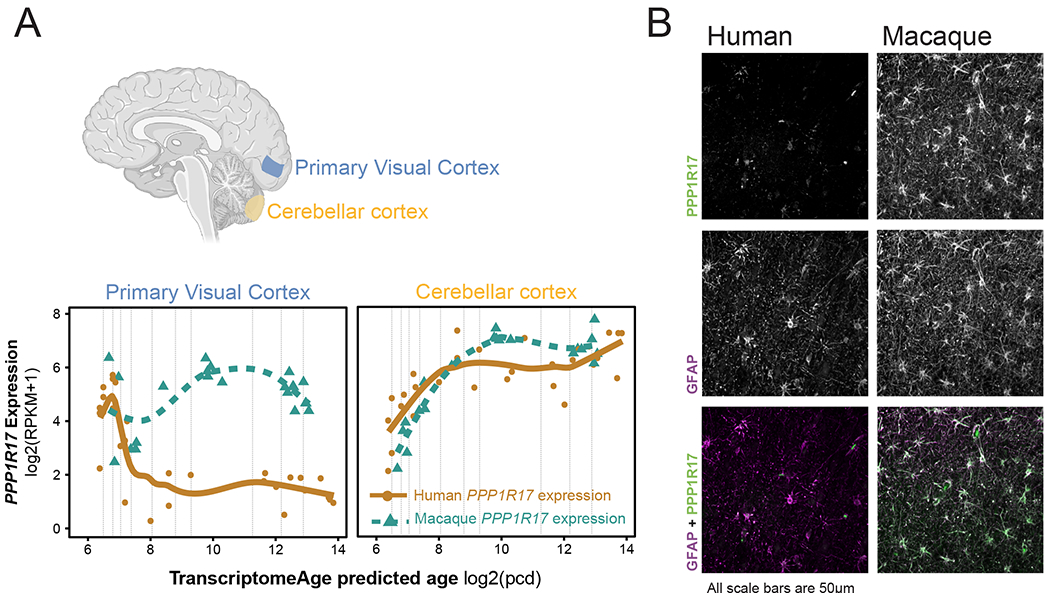
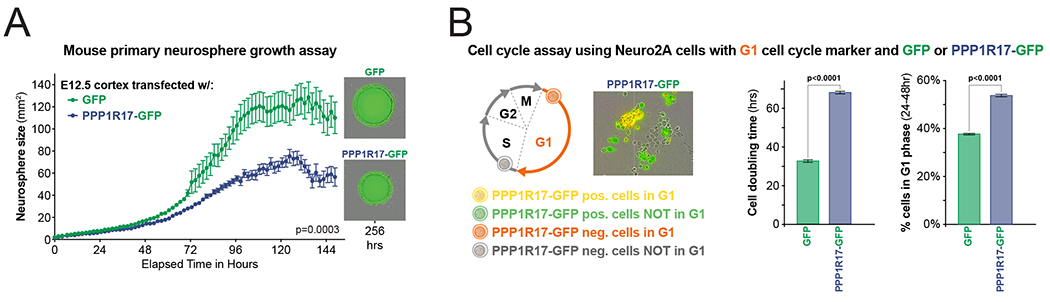
Human accelerated regions (HARs) are the fastest-evolving regions of the human genome, and many are hypothesized to function as regulatory elements that drive human-specific gene regulatory programs. We interrogate the in vitro enhancer activity and in vivo epigenetic landscape of more than 3,100 HARs during human neurodevelopment, demonstrating that many HARs appear to act as neurodevelopmental enhancers and that sequence divergence at HARs has largely augmented their neuronal enhancer activity. Furthermore, we demonstrate PPP1R17 to be a putative HAR-regulated gene that has undergone remarkable rewiring of its cell type and developmental expression patterns between non-primates and primates and between non-human primates and humans. Finally, we show that PPP1R17 slows neural progenitor cell cycle progression, paralleling the cell cycle length increase seen predominantly in primate and especially human neurodevelopment. Our findings establish HARs as key components in rewiring human-specific neurodevelopmental gene regulatory programs and provide an integrated resource to study enhancer activity of specific HARs.

Keywords: HARs; cerebral cortex; enhancers; evolution; human accelerated regions; neurodevelopment.


Conflict of interest statement

Declaration of interests The authors declare no competing interests.

Figures

Figure 1.
Figure 1.. Rewiring of the cis-regulatory enhancer activity of HAR elements in the human-lineage.
(A) Schematic describing captureMPRA assay. (B) caMPRA activity of all HARs and their chimpanzee orthologs in human neural cells. P-value calculated using two-sided paired T-test. (C) Bar graph showing the number of HAR elements with increased or reduced activity of the human versus chimpanzee ortholog. * signifies p-value <0.001 (2-proportions z-test) (D) caMPRA activity of all HARs and their chimpanzee orthologs in human neural cells versus mouse neural cells. P-value calculated using two-sided paired T-test. (E) Bar graph showing the percentage of HAR elements with altered activity of the human versus chimpanzee ortholog versus the percentage of HAR elements with altered activity in human versus mouse neural cells. * signifies p-value <0.001 (2-proportions z-test)
Figure 2.
Figure 2.. HARs are enriched for human neurodevelopmental enhancer elements
(A) Genomic loci demonstrating tissue-specific DNaseI-seq chromatin accessibility at three separate HAR elements. (B) (top) The proportion of HAR elements that demonstrate DNaseI hypersensitivity within 79 diverse human tissues based on whether the element is DNaseI hypersensitive in brain tissues only, brain tissues plus other tissues, or non-brain tissues only. (bottom) For HAR elements that are DNaseI hypersensitive in brain tissues only, shown is a Venn diagram of the number of elements that are DNaseI hypersensitive in fetal versus adult brain tissue. (C) Bar graphs displaying (top) the number of HAR elements overlapping DHSs in each tissue as well as (bottom) the total number of DHSs in each tissue. Fetal tissues are labeled in blue, whereas adult tissues are labeled in brown. * signifies p-value <0.001 (2-proportions z-test) (D) Schematic for fluorescence-activated nuclear sorting (FANS) of human fetal brain tissue. (E-F) Genomic loci and density plots demonstrating FANS tissue-specific (E) DNaseI-seq chromatin accessibility and (F) H3K4me1 and H3K27ac ChIP-seq signal at HAR elements. (G) Venn diagram demonstrating the overlap of HARs with H3K4me1 or H3K27ac signal in either NPCs or Neurons. (H) Bar plots showing the percentage of NPC and Neuron DHSs that overlap with H3K4me1 or H3K27ac ChIP-seq peaks based on whether the DHS is also a HAR. * signifies p-value <0.001 (2-proportions z-test)
Figure 3.
Figure 3.. PPP1R17 is a putative HAR-regulated neurodevelopmental gene
(A) Integration of caMPRA activity, chromatin accessibility, histone modification datasets and long-range chromatin interaction data defines 63 HARs as likely contributors to human brain evolution. (B) hg19 HiC and DNaseI-seq data at the locus surrounding HAR2635, which is one of the HARs identified in panel A. HAR2635 interacting loci are indicated by the green box and black arrows. (C) Chromatin Confirmation Capture (3C) signal in SH-SY5Y human neural cells demonstrating long-range chromatin contacts between the PPP1R17 promoter and HAR2635 and HAR3636. Data is maximum signal normalized. (D) Genomic locus of HAR2635 showing evolutionary conservation and DNaseI-seq signal and single cell ATAC-seq signal across multiple human fetal tissues and adult astrocytes. (E) Genomic locus of the HAR2635-interacting gene PPP1R17 showing human fetal brain DNaseI-seq signal and single cell ATAC-seq signal in addition to evolutionary conserved elements and the DNaseI-seq signal of contiguous sequence in mouse fetal brain. Red box indicates primate-selective regulatory element. Contiguous sequence elements between human and mouse are indicated by grey boxes.
Figure 4.
Figure 4.. Primate-specific gain of PPP1R17 expression in the developing cortex
(A) Diagram of brain regions stained in this figure. (B) Staining of human, macaque, ferret and mouse cerebellum for both PPP1R17 (green) and the Purkinje cell marker Calbindin (pink), demonstrates conserved cerebellar expression of PPP1R17 across these four mammals. (C) Staining of human, macaque, ferret and mouse developing cortex with PPP1R17 and SOX2 demonstrates cortical expression of PPP1R17 selectively within the two primate species, which appears to be localized to both the outer and inner subventricular cortical germinal zones. VZ, ventricular zone; ISVZ, inner subventricular zone; OFL, outer fiber layer; SP, subplate; CP, cortical plate. (D-E) Staining of human fetal cortex with PPP1R17, SOX2 and TBR2 demonstrating (D) PPP1R17 expression localized to the subventricular zones, and (E) PPP1R17, SOX2, and TBR2 colocalization.
Figure 5.
Figure 5.. Human-specific divergence in PPP1R17 cell-type distribution
(A) (top) Diagram of brain regions evaluated by RNA-sequencing at various developmental time stages in human and macaque brain development from fetal to adult. (Bottom) PPP1R17 expression in the cerebellum and cortex in macaque and humans as a function of developmental age demonstrates persistent expression of PPP1R17 selectively in macaque well into adulthood. (B) Staining of human and macaque adult neocortex for both PPP1R17 (green) and the astrocyte marker GFAP (purple) demonstrates predominant expression of PPP1R17 in cortical astrocytes in adult macaque.
Figure 6.
Figure 6.. PPP1R17 regulates cell proliferation and G1 phase in vitro
(A) Mouse primary neurosphere growth assay using cells transfected with either a GFP or PPP1R17 construct exposes a growth restriction for PPP1R17-expressing neurospheres, which were 36% smaller than GFP controls (2-way ANOVA, p=0.0003). Error bars = SEM. Individual values represent wells containing neurospheres imaged at each timepoint, n = 48 GFP- and n = 37 PPP1R17-transfected wells. (B) Cell cycle assay using Neuro2A cells with G1 cell cycle marker in addition to either a GFP or PPP1R17 construct demonstrates both (middle) a longer doubling time (PPP1R17 cells = 68.2 hours vs GFP = 32.7 hours, p<0.0001) and (right) a prolonged G1 phase for PPP1R17-expressing Neuro2A cells (48.5% PPP1R17 vs 33.8% GFP, p<0.0001, 2-way ANOVA). Total number of cells and percent of cells expressing both the G1 marker and either GFP or PPP1R17-GFP were quantitated at 24h and 48h from 4 images per well, for each well containing transfected Neuro2A cells (n=13 GFP-transfected wells, n=13 PPP1R17-transfected wells). Error bars = SEM.

Comment in

References

    1. Arai Y, Pulvers JN, Haffner C, Schilling B, Nüsslein I, Calegari F, and Huttner WB (2011). Neural stem and progenitor cells shorten S-phase on commitment to neuron production. Nat. Commun 2, 1–12. - PMC - PubMed
    1. Betizeau M, Cortay V, Patti D, Pfister S, Gautier E, Bellemin-Ménard A, Afanassieff M, Huissoud C, Douglas RJ, Kennedy H, et al. (2013). Precursor Diversity and Complexity of Lineage Relationships in the Outer Subventricular Zone of the Primate. Neuron 80, 442–457. - PubMed
    1. Bird CP, Stranger BE, Liu M, Thomas DJ, Ingle CE, Beazley C, Miller W, Hurles ME, and Dermitzakis ET (2007). Fast-evolving noncoding sequences in the human genome. Genome Biol. 8, R118. - PMC - PubMed
    1. Boldog E, Bakken TE, Hodge RD, Novotny M, Aevermann BD, Baka J, Bordé S, Close JL, Diez-Fuertes F, Ding SL, et al. (2018). Transcriptomic and morphophysiological evidence for a specialized human cortical GABAergic cell type. Nat. Neurosci 21, 1185–1195. - PMC - PubMed
    1. Bolger AM, Lohse M, and Usadel B (2014). Trimmomatic: a flexible trimmer for Illumina sequence data. Bioinformatics 30, 2114–2120. - PMC - PubMed

Publication types