. 2021 Oct 7;108(10):1880-1890.
doi: 10.1016/j.ajhg.2021.08.005. Epub 2021 Sep 2.

Fast two-stage phasing of large-scale sequence data

Affiliations

Fast two-stage phasing of large-scale sequence data

Brian L Browning et al. Am J Hum Genet. .

Abstract

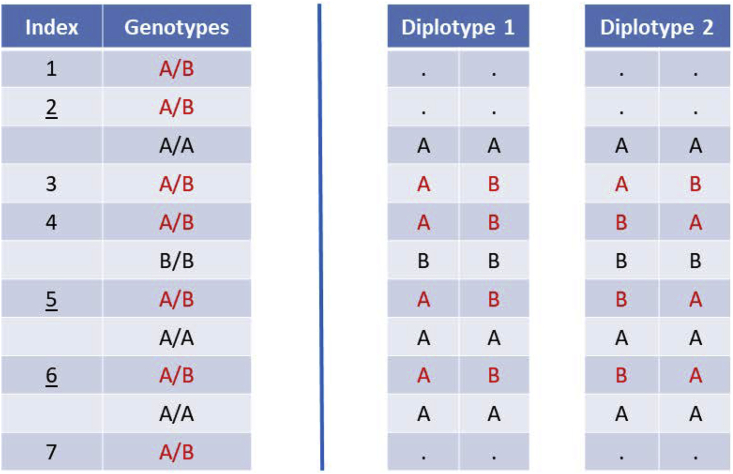
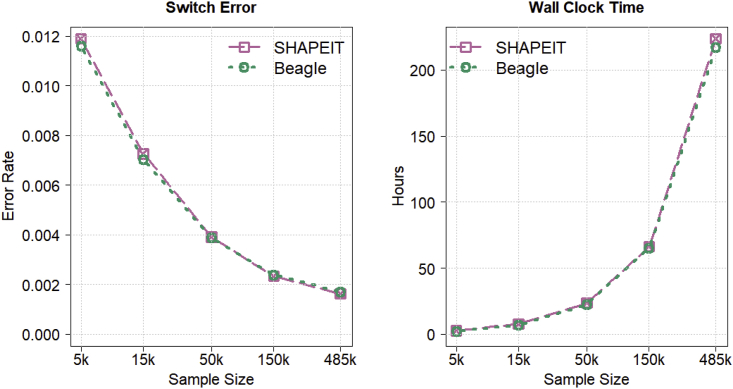
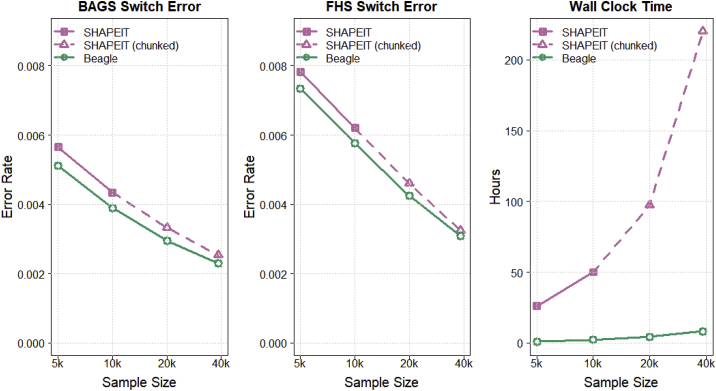
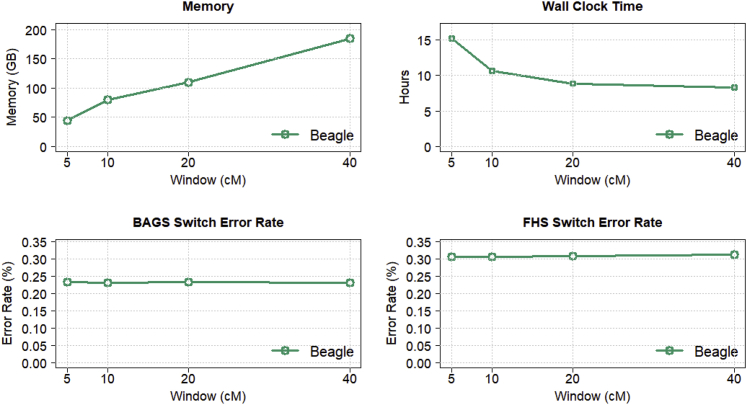
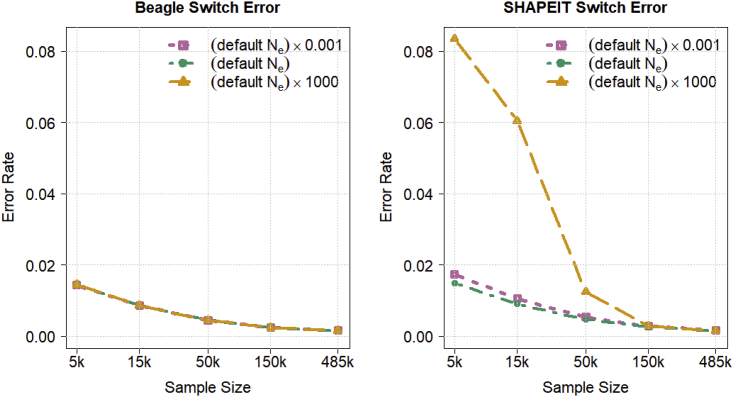
Haplotype phasing is the estimation of haplotypes from genotype data. We present a fast, accurate, and memory-efficient haplotype phasing method that scales to large-scale SNP array and sequence data. The method uses marker windowing and composite reference haplotypes to reduce memory usage and computation time. It incorporates a progressive phasing algorithm that identifies confidently phased heterozygotes in each iteration and fixes the phase of these heterozygotes in subsequent iterations. For data with many low-frequency variants, such as whole-genome sequence data, the method employs a two-stage phasing algorithm that phases high-frequency markers via progressive phasing in the first stage and phases low-frequency markers via genotype imputation in the second stage. This haplotype phasing method is implemented in the open-source Beagle 5.2 software package. We compare Beagle 5.2 and SHAPEIT 4.2.1 by using expanding subsets of 485,301 UK Biobank samples and 38,387 TOPMed samples. Both methods have very similar accuracy and computation time for UK Biobank SNP array data. However, for TOPMed sequence data, Beagle is more than 20 times faster than SHAPEIT, achieves similar accuracy, and scales to larger sample sizes.

Keywords: TOPMed; UK Biobank; genotype phasing; haplotype phasing; phasing.


Conflict of interest statement

Declaration of interests The authors declare no competing interests.

Figures

Figure 1
Figure 1
Two possible diplotypes after heterozygote masking The left side lists eleven genotypes in chromosome order whose alleles are labeled A and B. The seven heterozygous genotypes are in red font and are indexed in the left column. Indices of three heterozygous genotypes are underlined (2, 5, and 6). Each of these three heterozygous genotypes is “finished,” which means that the heterozygote has known phase with respect to the preceding heterozygote. Alleles are labeled so that each heterozygote with known phase has the A allele on the same haplotype as the preceding heterozygote. The right side shows the two possible diplotypes after heterozygote masking when phasing the 4th heterozygote with respect to the 3rd heterozygote. The 2nd heterozygote, which has known phase with respect to the 1st heterozygote, is masked because the 3rd heterozygote has unknown phase with respect to the 2nd heterozygote.
Figure 2
Figure 2
Phase accuracy and computation time for autosomal UK Biobank SNP array data Switch error rate and wall clock computation time for Beagle 5.2 and SHAPEIT 4.2.1 when phasing 5,000, 15,000, 50,000, 150,000, and 485,301 UK Biobank individuals genotyped for 711,651 autosomal markers with default parameter values. Sample size is plotted on the log scale. Switch error rate is calculated with heterozygous genotypes in 1,064 offspring whose phase is determined from parental data that were excluded from the phasing analysis. All analyses were run with 20 threads on a computer server with 20 CPU cores and 256 GB memory.
Figure 3
Figure 3
Phase accuracy and computation time for phasing TOPMed chromosome 20 sequence data Switch error rate and wall clock computation time for Beagle 5.2 and SHAPEIT 4.2.1 when phasing 5,000, 10,000, 20,000, and 38,387 sequenced TOPMed individuals genotyped for 7,209,890 chromosome 20 markers with default parameter values. Sample size is plotted on the log scale. Switch error rate is computed with heterozygous genotypes in 217 BAGS and 669 FHS offspring whose phase is determined from parental data that were excluded from the phasing analysis. All analyses were run with 20 threads on a computer server with 20 CPU cores and 256 GB of memory. The SHAPEIT whole-chromosome phasing of the 20,000 and 38,387 individuals did not complete because of insufficient memory. SHAPEIT results for the 20,000 and 38,387 individuals were obtained by dividing the chromosome into two and three chunks, respectively, and phasing each chunk separately. Adjacent chunks had 500 kb overlap. The SHAPEIT wall clock for each sample size is the sum of the wall clock times for the individual chunks. The procedure for merging the individual chunks for each sample size is described in the subjects and methods.
Figure 4
Figure 4
Memory and computation time as a function of window length Beagle 5.2 memory use, wall clock time, and switch error rate when phasing 38,387 sequenced TOPMed individuals genotyped for 7,209,890 chromosome 20 markers when using 5, 10, 20, and 40 cM marker windows. The default window length is 40 cM. All other parameters were set to default values. Switch error rate is computed with heterozygous genotypes in 217 BAGS and 669 FHS offspring whose phase is determined from parental data that were excluded from the phasing analysis. All analyses were run with 20 threads on a computer server with 20 CPU cores and 256 GB of memory.
Figure 5
Figure 5
Phase accuracy as a function of user-specified effective population size Switch error rate for Beagle 5.2 and SHAPEIT 4.2.1 when phasing 5,000, 15,000, 50,000, 150,000, and 485,301 UK Biobank individuals genotyped for 18,424 chromosome 20 markers for three different user-specified values of the effective population size parameter: the program’s default parameter value, a value 1,000 times smaller than the default value, and a value 1,000 times larger than the default value. All other analysis parameters are set to their default values. Switch error rate is calculated with heterozygous genotypes in 1,064 offspring whose phase is determined from parental data that were excluded from the phasing analysis. Beagle’s switch error rate does not depend on the user-specified effective population size parameter because Beagle estimates and updates this parameter.

References

    1. Howie B., Fuchsberger C., Stephens M., Marchini J., Abecasis G.R. Fast and accurate genotype imputation in genome-wide association studies through pre-phasing. Nat. Genet. 2012;44:955–959. - PMC - PubMed
    1. Das S., Abecasis G.R., Browning B.L. Genotype Imputation from Large Reference Panels. Annu. Rev. Genomics Hum. Genet. 2018;19:73–96. - PubMed
    1. Browning B.L., Zhou Y., Browning S.R. A One-Penny Imputed Genome from Next-Generation Reference Panels. Am. J. Hum. Genet. 2018;103:338–348. - PMC - PubMed
    1. Rubinacci S., Delaneau O., Marchini J. Genotype imputation using the Positional Burrows Wheeler Transform. PLoS Genet. 2020;16:e1009049. - PMC - PubMed
    1. Larsen L.A., Fosdal I., Andersen P.S., Kanters J.K., Vuust J., Wettrell G., Christiansen M. Recessive Romano-Ward syndrome associated with compound heterozygosity for two mutations in the KVLQT1 gene. Eur. J. Hum. Genet. 1999;7:724–728. - PubMed

Publication types