. 2021 Oct 11;39(10):1361-1374.e9.
doi: 10.1016/j.ccell.2021.08.005. Epub 2021 Sep 2.

Activating a collaborative innate-adaptive immune response to control metastasis

Affiliations

Activating a collaborative innate-adaptive immune response to control metastasis

Lijuan Sun et al. Cancer Cell. .

Abstract

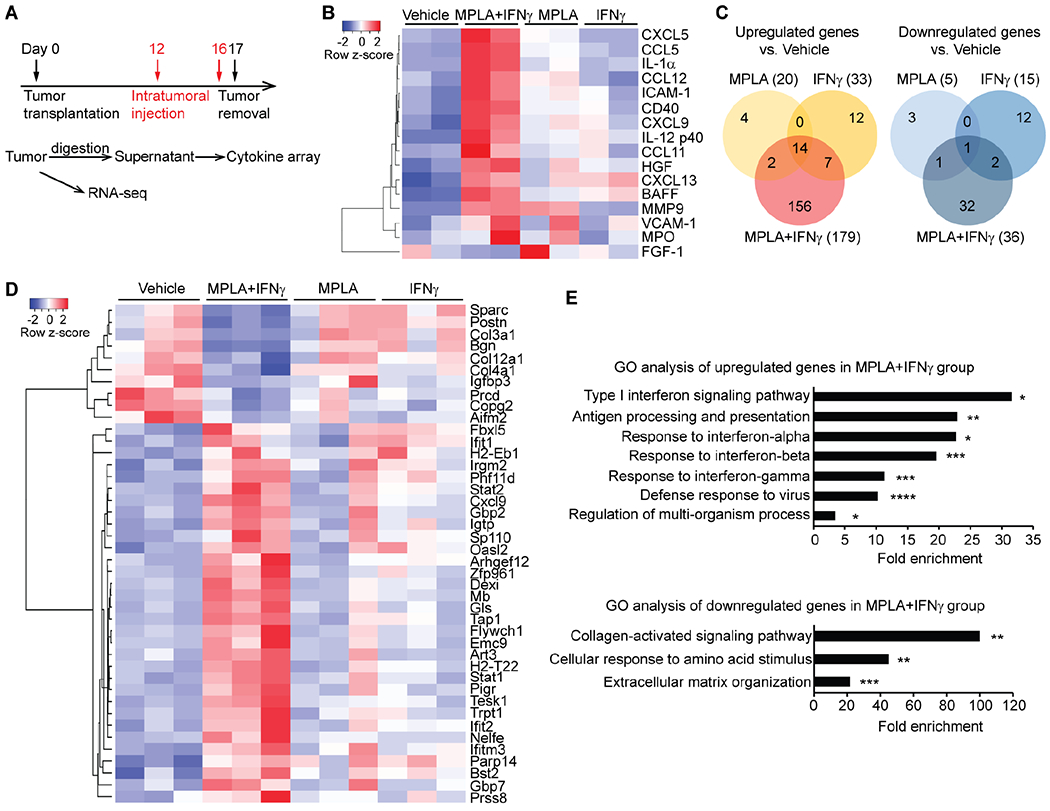
Tumor-associated macrophages (TAMs) promote metastasis and inhibit T cells, but macrophages can be polarized to kill cancer cells. Macrophage polarization could thus be a strategy for controlling cancer. We show that macrophages from metastatic pleural effusions of breast cancer patients can be polarized to kill cancer cells with monophosphoryl lipid A (MPLA) and interferon (IFN) γ. MPLA + IFNγ injected intratumorally or intraperitoneally reduces primary tumor growth and metastasis in breast cancer mouse models, suppresses metastasis, and enhances chemotherapy response in an ovarian cancer model. Both macrophages and T cells are critical for the treatment's anti-metastatic effects. MPLA + IFNγ stimulates type I IFN signaling, reprograms CD206+ TAMs to inducible NO synthase (iNOS)+ macrophages, and activates cytotoxic T cells through macrophage-secreted interleukin-12 (IL-12) and tumor necrosis factor alpha (TNFα). MPLA and IFNγ are used individually in clinical practice and together represent a previously unexplored approach for engaging a systemic anti-tumor immune response.

Keywords: IFNγ; MPLA; anti-tumor immune response; breast cancer; cytotoxic T cells; metastasis treatment; ovarian cancer; tumor-associated macrophages.


Conflict of interest statement

Declaration of interests M.E. is a member of the research advisory board for brensocatib for Insmed, a member of the scientific advisory board for Vividion Therapeutics, a consultant for Protalix, and holds shares in Agios. I.A.M. is on the advisory boards for Clovis Oncology, AstraZeneca, GSK, Epsila Bio, Roche, and Scancell; has institutional funding from AstraZeneca; and is a Trustee of Worldwide Cancer Research. S.A. has uncompensated consulting or advisory roles with Bristol-Myers Squibb, Genentech, and Merck, and research funding to her institution from Amgen, Bristol-Myers Squibb, Celgene, Genentech, Merck, and Novartis. T.K. is currently an employee of Novartis. The other authors declare no competing interests.

Figures

Figure 1.
Figure 1.. MPLA+IFNγ induces tumoricidal effects of breast TAMs from mice and patients.
(A) Macrophages and PyMT tumor cells were isolated from primary tumors of MMTV-PyMT (BL/6) mice, fluorescently labeled, and co-cultured for 48 hours as indicated. (B) Statistical analysis of relative PyMT cancer cell numbers for panel A. (C) The effect of macrophages on PyMT tumor cells were studied using: 1) CM: conditioned medium of vehicle- or MPLA+IFNγ-treated macrophages was added to the cancer cells; 2) Transwell: macrophages and cancer cells were seeded in upper or lower chambers, respectively; 3) Direct contact: macrophages and cancer cells were co-cultured in direct contact. B, C: Graph depicts the average results of three independent experiments. (D) Macrophages and EpCAM+ cancer cells were isolated from pleural effusions of breast cancer patients and co-cultured as indicated. EpCAM+ cancer cells did not proliferate during co-culture. For A–D, macrophages were stained with Deep Red Dye (falsely colored green); cancer cells were stained with CMFDA Dye. LPS, MPLA, polyI:C, mouse IFNγ, or human IFNγ was added at 0 hour. (E) Gene expressions in pleural effusion-derived macrophages (cultured without cancer cells) was determined by RT-qPCR 24 hours after indicated treatments were initiated. NOS2, CD40, TNF, and IL12B (p40 subunit of IL-12) are markers of tumoricidal macrophages. IL10 and MRC1 are markers of TAMs. The relative expression to ACTB was normalized to the relative expression in vehicle-treated samples, which was set to 1. D, E: Graph depicts the average results from three patients. One-way ANOVA was used for all panels. Data are represented as mean ± SD (standard deviation). See also Figure S1, Movies S1 and S2.
Figure 2.
Figure 2.. MPLA+IFNγ suppresses breast tumor growth and lung metastasis in mice.
(A, B) Tumor growth curve of (A) transplanted PyMT or (B) 4T1 tumors, arrows indicate time of treatments; 1 μg MPLA, 1 μg (A) or 3 μg (B) mouse IFNγ, or both (MPLA and IFNγ were mixed, then injected) per tumor. N=8 tumors/group. (C, D) Lung metastatic burden of (C) PyMT (N=4–6 mice/group) and (D) 4T1 tumor-bearing mice (N=5–9 mice/group) determined from histology. (E, H) Tumor growth curves, (F, I) representative H&E staining of lungs (scale bar: 4 mm), and (G, J) lung metastatic burden determined from histology of spontaneous C57BL/6-MMTV-PyMT (E–G, N=6-7 mice/group) and FVB/N-MMTV-PyMT (H–J, N=6-10 mice/group) mice (1 μg MPLA+1 μg IFNγ per tumor). Lungs were collected 3 days after last treatment. One-way ANOVA (2A–D) or t-test (2E, 2G, 2H, and 2J) was performed for tumor volume analysis at the end point and for lung metastasis analysis, and due to unequal group variances, Welch’s ANOVA was used for panels 2A, 2C, 2D, and Welch’s t-test was used for panels 2E, 2G, 2J. ***p<0.001, compared to vehicle. Data are represented as mean ± SD. (K) Body weight and (L) serum levels of AST (aspartate aminotransferase), ALP (alkaline phosphatase), albumin, and creatine kinase of tumor-free C57BL/6 mice treated with vehicle (N=9) or MPLA+IFNγ, treated as in Figure S2F (N=10). T-test was performed for panels 2K and 2L. Data are represented as mean ± SD. n.s.: not significant. (M) Representative H&E stained sections of liver, lung, kidney, bone marrow, heart, or spleen. Scale bar: 100 μm. Serum and tissues were collected 2 days after the 6th treatment. See also Figure S2.
Figure 3.
Figure 3.. MPLA+IFNγ enhances chemokine secretion and stimulates the type I IFN signaling pathway in breast tumors.
(A) Experimental design for obtaining cytokine array and RNA-seq data; 1 μg MPLA, 1 μg mouse IFNγ, or both were used per PyMT tumor. (B) Heatmap of the secreted cytokines that were changed by MPLA+IFNγ compared to vehicle. (C) Venn diagrams of upregulated and downregulated genes in tumors after the indicated treatments. MPLA+IFNγ uniquely upregulated 156 genes and downregulated 32 genes that did not show altered transcription when tumors were treated by MPLA or IFNγ alone. (D) Heatmap of the top genes that were uniquely changed in the MPLA+IFNγ group. (E) Gene ontology analysis of the genes that were uniquely up- or down-regulated in the MPLA+IFNγ group. *FDR<0.05, **FDR<0.01, ***FDR<0.001, ****FDR<0.0001, compared to vehicle. See also Figure S3 and Data file S1.
Figure 4.
Figure 4.. MPLA+IFNγ reprograms TAMs to be tumoricidal in breast tumors.
(A) Flow cytometry of inflammatory monocytes in PyMT tumors. N=5 mice/group. (B) IF staining of macrophages (F4/80+) in PyMT tumors. In total, 6–14 fields of view (FOVs) were evaluated from 4 mice/group. Scale bar: 50 μm. (C–E) The percentages of tumoricidal macrophages (iNOS+ or CD40+) and TAMs (CD206+) of total macrophages were identified by flow cytometry. N=3–6 mice/group. (F, G) IF staining of iNOS+ (F) and CD40+ cells (G) in PyMT tumors. In total, 6–14 FOVs were evaluated from 4 mice/group. Scale bar: 50 μm. (H) Antigen-presenting activities of macrophages determined by the percentage of H-2Kb OVA+ cells in PyMT-chOVA tumors. N=5 mice/group. For all figure panels, the analysis was performed 2 days after the last (6th) intratumoral injection. One-way ANOVA was used for panels 4A, 4C–E, and 4H, and Welch’s ANOVA was used for panels 4B, 4F, and 4G. Data are represented as mean ± SD. See also Figure S4.
Figure 5.
Figure 5.. MPLA+IFNγ can activate cytotoxic T cells through macrophage-secreted IL-12 and TNFα and antigen presentation.
(A) IF staining of CD8+ T cells in PyMT tumors. In total, 5–9 FOVs were evaluated from 4 mice/group. Scale bar: 50 μm. (B–D) The percentages of cytotoxic T cells (CD8+CD107a+, B), PD1+CD8+ T cells (C), and effector memory CD8+ T cells (CD44+CD62L, D) in PyMT tumors were identified by flow cytometry. For panels A–D, the analysis was performed 2 days after the last (6th) intratumoral injection. (E–G) CD69 expression of CD8+ T cells in in vitro co-culture systems was identified by flow cytometry. (E) CD8+ T cells isolated from the spleens of PyMT tumor-bearing mice were cultured with or without macrophages derived from the bone marrow of the same mice, and MPLA or IFNγ or both were added to the cell cultures immediately after T cell seeding. (F) CD8+ T cells were cultured with macrophages similarly to (E), and neutralized antibodies against IL-12, TNFα, or CXCL9 were added 30 minutes before adding MPLA+IFNγ. (G) Macrophages derived from the bone marrow of PyMT tumor-bearing mice were activated with MPLA (or IFNγ or both) for 16 hours, then incubated with OVA-Q4H7 peptide (10−9 M) for 2 hours, washed with PBS and added to CD8+ T cells isolated from the spleens of OT1 mice. One-way ANOVA was used for panels 5C, 5E, and 5F, and Welch’s ANOVA was used for panels 5A, 5B, 5D, and 5G. Data are represented as mean ± SD. See also Figure S5.
Figure 6.
Figure 6.. Both macrophages and T cells are essential for MPLA+IFNγ’s anti-tumor effects.
(A) Tumor growth curve of 4T1 tumors after T cell depletion (anti-CD4, anti-CD8, or anti-CD4/CD8) or macrophage depletion (anti-CSF1R). N=8 tumors/group. Immune cell-depleting antibodies were injected 1 day before intratumoral injection of MPLA+IFNγ. Welch’s ANOVA was performed for the tumor volume analysis at the end point. *p<0.05, **p<0.01, ***p<0.001, compared to MPLA+IFNγ+IgG. (B) Lung metastatic burden of 4T1 tumor-bearing mice was determined by H&E staining. Lung tissues were collected 3 days after the last MPLA+IFNγ treatment. N=5–7 mice/group. (C) Procedure for tumor re-challenge assay with or without T cell depletion (anti-CD4/CD8). i.t.: intratumoral; i.v.: intravenous. (D–E) Lung metastasis formed by newly injected breast cancer cells (ECFP+) without (D) or with (E) T cell depletion was determined by IF staining of lung sections for ECFP. N=4–5 mice/group. Welch’s ANOVA was used to analyze the data in panels 6B, 6D, and 6E. Data are represented as mean ± SD. See also Figure S6.
Figure 7.
Figure 7.. MPLA+IFNγ suppresses metastatic ovarian cancer in mice.
(A) Experimental design: three weeks after intraperitoneal ID8-p53−/− ovarian cancer cell inoculation, MPLA mixed with IFNγ was injected to the mice every 5 days, for six times. Two days after the last treatment, mice were euthanized and ascites/peritoneal lavage was collected for flow cytometry, i.p.: intraperitoneal. (B) Metastasis was evident from the appearance of the ascites/peritoneal lavage of the treated mice. (C, D) Metastasis was determined by the total cell number (C) and percentage of epithelial cancer cells (EpCAM+, D) in the ascites/peritoneal lavage. (E) Kaplan-Meier survival curves of DD8-p53−/− tumor-bearing mice treated with MPLA+IFNγ. Log-rank test, N=10 mice/group. Median survival times: Vehicle: 64 days; MPLA+IFNγ: 103 days. (F) Kaplan-Meier survival curves of DD8-p53−/− tumor-bearing mice treated with MPLA+IFNγ alone or in combination with cisplatin as indicated. Log-rank test, N=10 mice/group. Median survival times: Vehicle: 63 days; MPLA+IFNγ: 98.5 days; cisplatin: 105 days; and cisplatin followed by MPLA+IFNγ: undefined. (G–I) The proportions of monocytes (Ly6C+Ly6G, G), tumoricidal macrophages (iNOS+, H), and TAMs (CD206+, I) in ascites/peritoneal lavage were determined by flow cytometry. N=5 mice/group. T-test was used for panels 7G and 7I, and Welch’s t-test was used for 7C, 7D, and 7H. Data are represented as mean ± SD. See also Figure S7 and Table S1.

Comment in

References

    1. Ackerman SE, Pearson CI, Gregorio JD, Gonzalez JC, Kenkel JA, Hartmann FJ, Luo A, Ho PY, LeBlanc H, Blum LK, et al. (2021). Immune-stimulating antibody conjugates elicit robust myeloid activation and durable antitumor immunity. Nature Cancer 2, 18–33. - PMC - PubMed
    1. Adams S (2009). Toll-like receptor agonists in cancer therapy. Immunotherapy 1, 949–964. - PMC - PubMed
    1. Adams S, Kozhaya L, Martiniuk F, Meng TC, Chiriboga L, Liebes L, Hochman T, Shuman N, Axelrod D, Speyer J, et al. (2012). Topical TLR7 agonist imiquimod can induce immune-mediated rejection of skin metastases in patients with breast cancer. Clin. Cancer Res 18, 6748–6757. - PMC - PubMed
    1. Albrengues J, Shields MA, Ng D, Park CG, Ambrico A, Poindexter ME, Upadhyay P, Uyeminami DL, Pommier A, Kuttner V, et al. (2018). Neutrophil extracellular traps produced during inflammation awaken dormant cancer cells in mice. Science 361, eaao4227. - PMC - PubMed
    1. Arwert EN, Harney AS, Entenberg D, Wang Y, Sahai E, Pollard JW, and Condeelis JS (2018). A Unidirectional Transition from Migratory to Perivascular Macrophage Is Required for Tumor Cell Intravasation. Cell Rep. 23, 1239–1248. - PMC - PubMed

Publication types

LinkOut - more resources