. 2021 Dec 6;31(23):5341-5349.e4.
doi: 10.1016/j.cub.2021.08.022. Epub 2021 Sep 2.

Mechanosensory input during circuit formation shapes Drosophila motor behavior through patterned spontaneous network activity

Affiliations

Mechanosensory input during circuit formation shapes Drosophila motor behavior through patterned spontaneous network activity

Arnaldo Carreira-Rosario et al. Curr Biol. .

Abstract

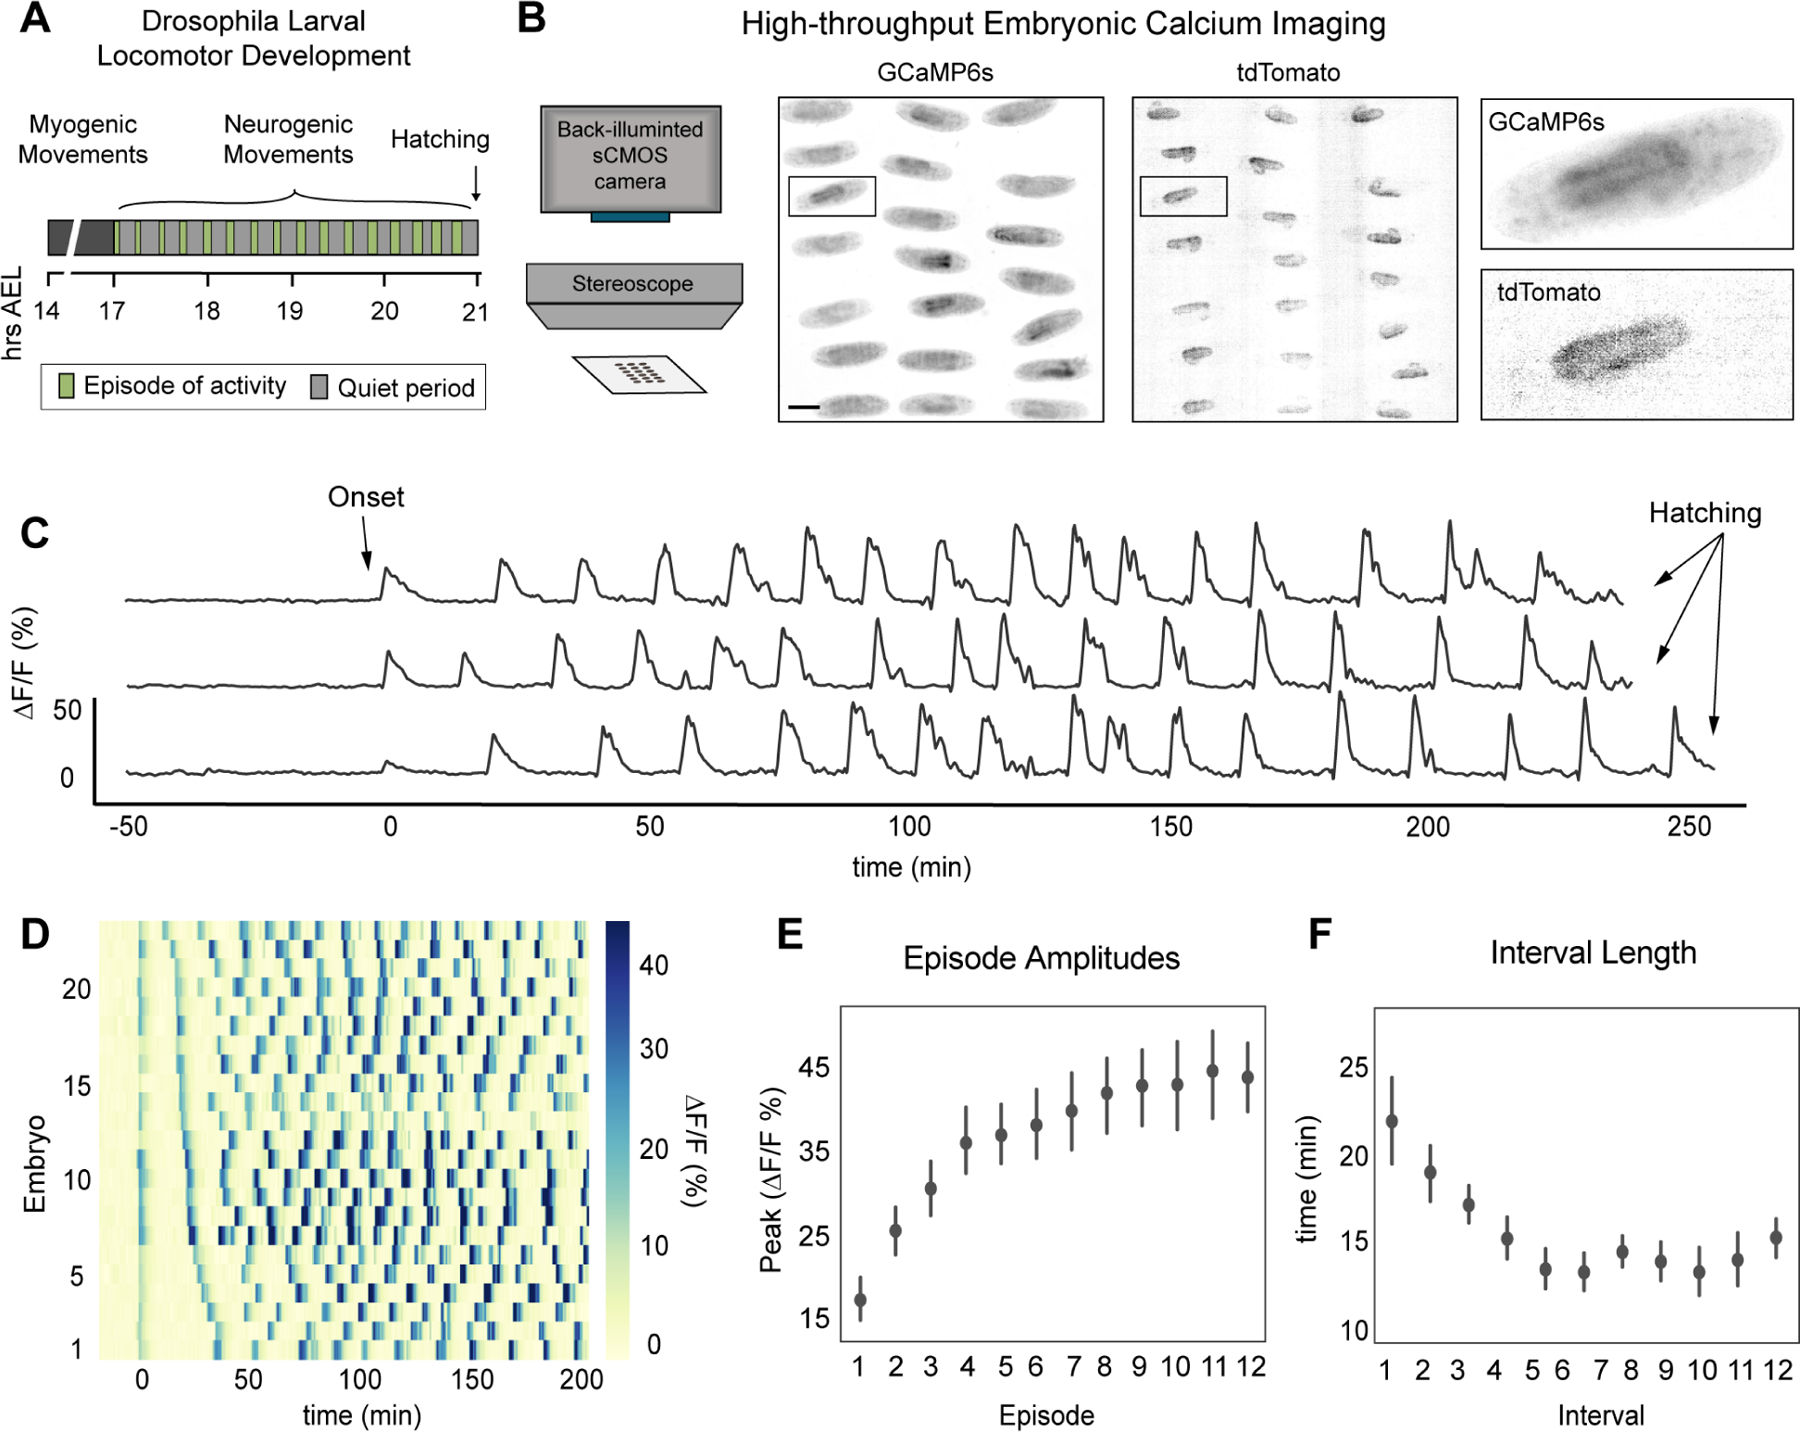
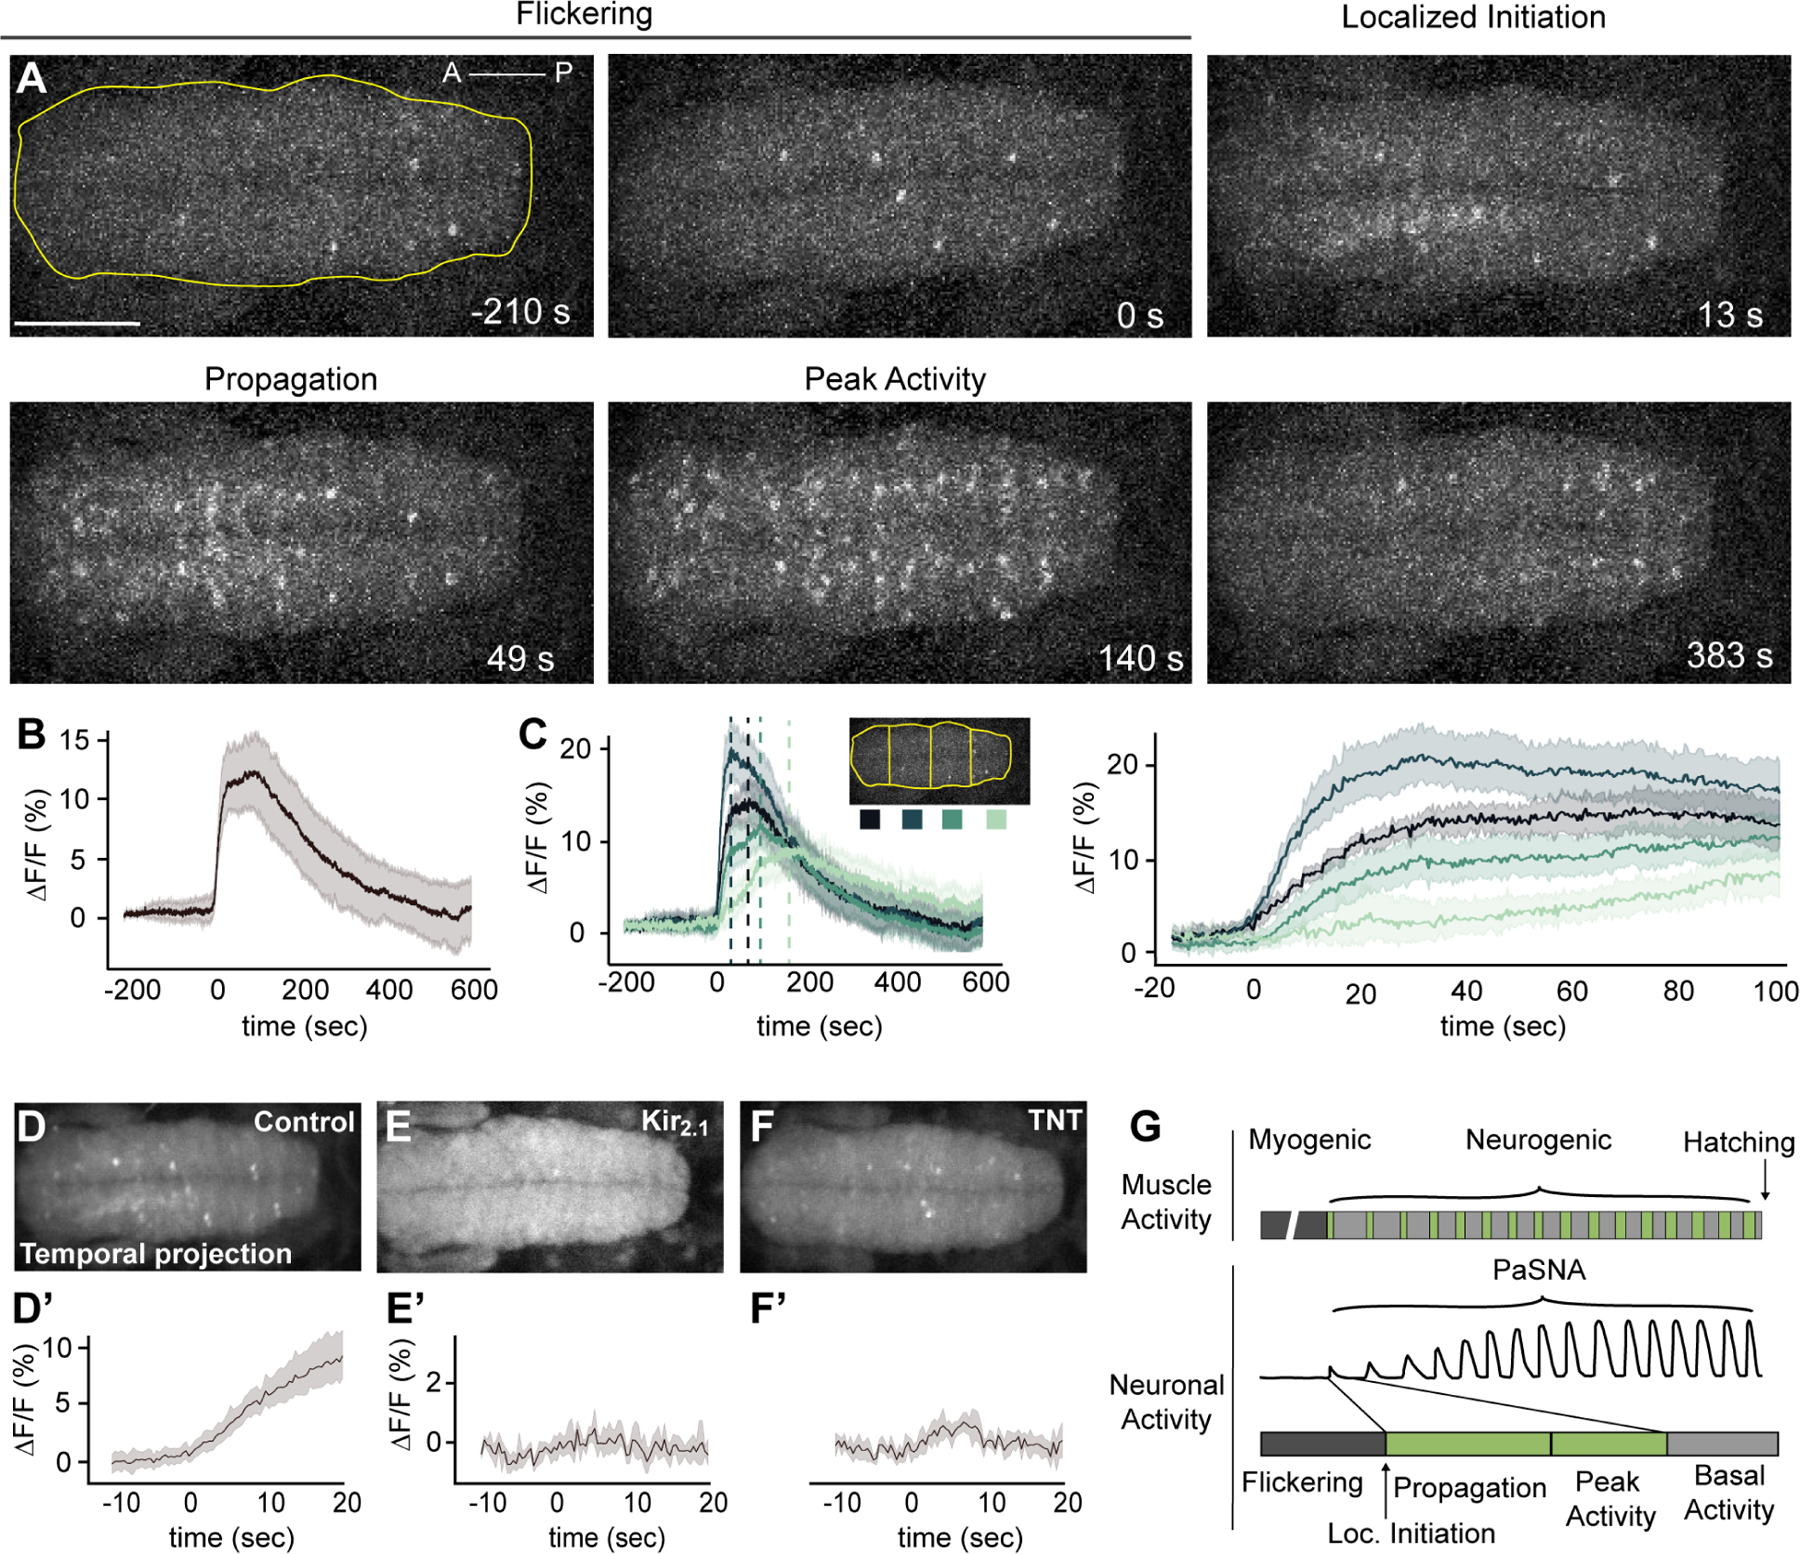
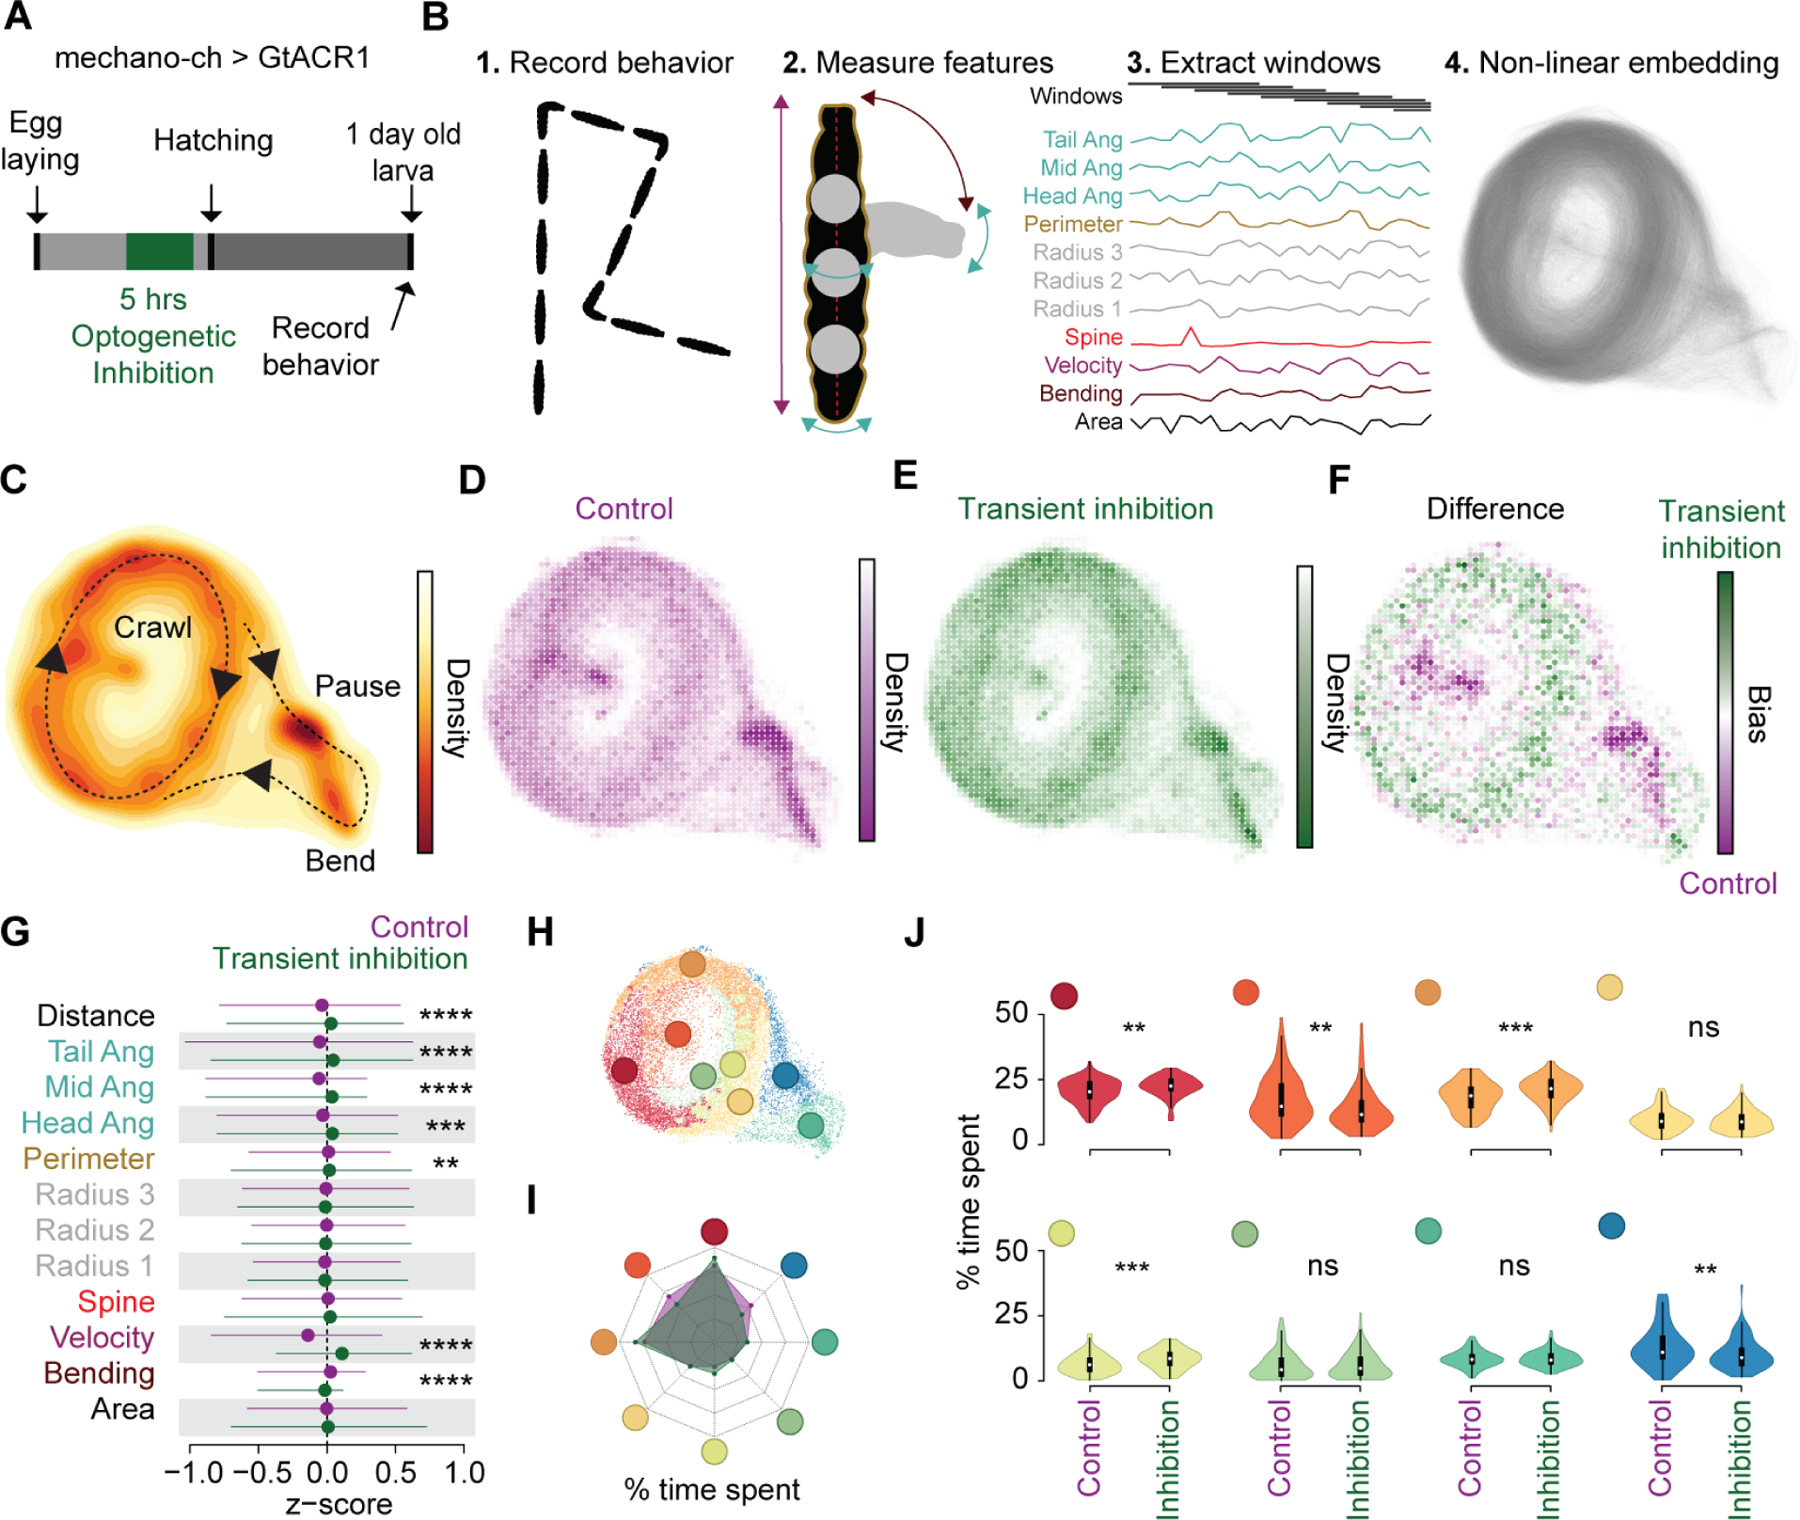
Neural activity sculpts circuit wiring in many animals. In vertebrates, patterned spontaneous network activity (PaSNA) generates sensory maps and establishes local circuits.1-3 However, it remains unclear how PaSNA might shape neuronal circuits and behavior in invertebrates. Previous work in the developing Drosophila embryo discovered intrinsic muscle activity that did not require synaptic transmission, and hence was myogenic, preceding PaSNA.4-6 These studies, however, monitored muscle movement, not neural activity, and were therefore unable to observe how myogenic activity might relate to subsequent neural network engagement. Here we use calcium imaging to directly record neural activity and characterize the emergence of PaSNA. We demonstrate that the spatiotemporal properties of PaSNA are highly stereotyped across embryos, arguing for genetic programming. Neural activity begins well before it becomes patterned, emerging during the myogenic stage. Remarkably, inhibition of mechanosensory input, as well as inhibition of muscle contractions, results in premature and excessive PaSNA, demonstrating that muscle movement serves as a brake on this process. Finally, transient mechanosensory inhibition during PaSNA, followed by quantitative modeling of larval behavior, shows that mechanosensory modulation during development is required for proper larval foraging. This work provides a foundation for using the Drosophila embryo to study the role of PaSNA in circuit formation, provides mechanistic insight into how PaSNA is entrained by motor activity, and demonstrates that spontaneous network activity is essential for locomotor behavior. These studies argue that sensory feedback during the earliest stages of circuit formation can sculpt locomotor behaviors through innate motor learning.

Keywords: Drosophila embryo; behavioral development; development of locomotor behavior; nervous system development; neural circuit wiring; spontaneous network activity.


Conflict of interest statement

Declaration of interests The authors declare no competing interests.

Figures

Figure 1.
Figure 1.. Characterization of patterned spontaneous network activity in Drosophila embryo
(A) Schematic of Drosophila larval locomotor development. Time in hours after egg laying (hrs AEL). (B) Schematic of high-throughput imaging system (left). Images of GCaMP6s and tdTomato signal across the imaging field, color inverted for visualization (right). Scale bar: 200 μm. (C) GCaMP6s:TdTomato ΔF/F traces from three individual embryos. (D) Raster plot for PaSNA trimmed at 200 minutes post-onset, sorted by distance between first and second peak, with each trace corresponding to an individual embryo. Increasingly strong movements prevent accurate measurements at later stages. ΔF/F heat map scale to the right. (E) ΔF/F peaks for episodes 1 through 12 (n = 23). (F) Quantification of the first eleven interbout interval lengths (n = 23). For (E) and (F), points represent mean and lines depict the 95% confidence interval (CI). See also Figure S1 and Video S1. For genotype information see Table S1.
Figure 2.
Figure 2.. Spatiotemporal and network properties of a single PaSNA episode
(A) Image frames during the first episode of PaSNA in an embryo. Phases labeled on top. Images are maximum intensity projections from an embryonic VNC expressing pan-neuronal GCaMP6s. Time stamps are relative to the positive inflection point caused by the activity burst. Yellow line delineates the VNC, with the ROI used for Panel B. Scale bar: 50 μm. (B) ΔF/F trace of the entire VNC during the first episode of PaSNA (n = 8). (C) ΔF/F of the color-coded four ROIs. Left displays −200 seconds to 600 seconds; right displays from −20 to 100 seconds relative to the initiation of PaSNA. (D-F’) Temporal projections (top) and ΔF/F VNC traces (bottom) for 30 seconds near the localized initiation time of the episode for control embryos (n = 8) (D), embryos expressing Kir2.1 pan-neuronally (E) (n = 5) and embryos expressing TNT pan-neuronally (F) (n = 6). (G) Schematic of Drosophila larval locomotor development showing activity at the muscle (top) and neuronal level (bottom). For all time series, dark lines represent the mean, while shading depicts the 95%CI. See also Video S2, S3, S4. For genotype information see Table S1.
Figure 3.
Figure 3.. Mechanosensory neurons modulate the amplitude of PaSNA episodes
(A) Schematic illustration of the experiment using CaLexA to reveal neural activity during the myogenic phase. (B) Schematic of an embryonic anterior body wall hemisegment showing all proprioceptive neurons. There are eight mechanosensory chordotonal neurons (mechano-ch [orange]). Five of these form a laterally located cluster (lch5). A solitary mechano-ch is located dorsal to lch5 (lch1), and a pair of mechano-ch neurons is located ventrally (vchB and vchA). Anatomical coordinates: anterior (A), posterior (P), dorsal (D) and ventral (V). (C) Expression of the mechano-ch driver inactive (iav) along several body wall segments. (D-E) CaLexA driving GFP expression in a 19 hrs AEL embryo expressing pan-neuronal TNT (n= 30 embryos). Note expression in lch5 in every hemisegment as well as expression in lch1 and vchA/B in some segments. Scale bars: 20μm. (F-I) Measurements of the timing and intensity of PaSNA in control embryos (gray) and experimental embryos expressing TNT in mechano-ch neurons (blue). (F) Quantification of PaSNA onset (n = 36 control; n = 33 experimental). (G) Cumulative occurrence of the first twelve episodes plotted as the proportion of total episodes across developmental time (n = 17 control; n = 32 experimental). (H) Area under the peak curve (AUC) quantification for the first twelve episodes plotted against developmental time. Values were binned based on developmental time (n = 17 control; n = 32 experimental). (I) Quantification of GCaMP6s baseline levels normalized against control mean before (14hrs AEL; n = 30 control; n = 37 experimental) and after (10 minutes before PaSNA onset; n = 20 control; n= 32 experimental) the myogenic phase. (J-M) Measurements of the timing and intensity of PaSNA in control embryos (gray) and experimental embryos expressing Kir2.1 in muscles (blue). (J) Quantification of PaSNA onset (n = 36 control; n = 30 experimental). (K) Cumulative occurrence of the first twelve episodes plotted as the proportion of total episodes across developmental time (n = 28 control; n = 28 experimental). (L) AUC quantification for the first twelve episodes plotted against binned developmental time (n = 28, control; n = 28 experimental). (M) Quantification of GCaMP6s baseline levels normalized against control mean before (n = 25 control; n = 25 experimental) and after (n = 26 control; n = 21 experimental) the myogenic phase. For (H) and (L), points represent mean and lines depict the 95% confidence interval. For all bar graphs the mean and 95% CI are displayed. ****p<0.0001, ***p<0.001, **p<0.005, *p<0.05. For (F) and (J) we used two-sample t-tests. For (H) and (L) we used two-sample t-tests with Holm-Bonferroni correction. For (I) and (M) we used two-sample Welch’s t-tests to account for differences in variance. See also Figure S2. For genotype information see Table S1.
Figure 4.
Figure 4.. Temporal embryonic inhibition of mechanosensory input leads to abnormal larval behavior
(A) Schematic of experimental design. (B) Workflow for Time Resolved BehavioraL Embedding (TREBLE) (Methods). (C) Probability density function of larval locomotor space plotted as a heatmap. Behaviors annotated qualitatively. Density scale to the right. (D-E) Bin-wise occurrence distributions for control (n= 84) (D) and transient inhibition (n = 97) (E) groups. (F) Difference map between control (purple) and transiently inhibited (green) animals. Bias scale to the right. (G) Comparison of primary behavioral features between control (purple) and transiently inhibited (green) larvae. (H) Behavioral space colored via Louvain clusters (Methods). (I) Radar chart comparing the percentage of time spent in each of the Louvain clusters for control (purple shade) and transient inhibition (green shade) groups. (J) Differences in occurrence in each behavioral cluster between control and transiently inhibited animals. **** p < 0.0001, *** p< 0.001, ** p < 0.01. For (G) we used trial-wise Kruskal-Wallis test with Bonferroni correction. For (J) we used trial-wise Kruskal-Wallis test. See also Figure S3. For genotype information see Table S1.

Comment in

References

    1. Goodman CS, and Shatz CJ (1993). Developmental mechanisms that generate precise patterns of neuronal connectivity. Cell 72, 77–98. - PubMed
    1. Kirkby LA, Sack GS, Firl A, and Feller MB (2013). A role for correlated spontaneous activity in the assembly of neural circuits. Neuron 80, 1129–1144. - PMC - PubMed
    1. Thompson A, Gribizis A, Chen C, and Crair MC (2017). Activity-dependent development of visual receptive fields. Current Opinion in Neurobiology 42, 136–143. - PMC - PubMed
    1. Pereanu W, Spindler S, Im E, Buu N, and Hartenstein V. (2007). The Emergence of Patterned Movement During Late Embryogenesis of Drosophila. Dev Neurobiology, 1669–1685. - PubMed
    1. Crisp S, Evers JF, Fiala A, and Bate M. (2008). The development of motor coordination in Drosophila embryos. Development 3717, 3707–3717. - PMC - PubMed

Publication types