. 2021 Sep 14;16(9):2159-2168.
doi: 10.1016/j.stemcr.2021.08.003. Epub 2021 Sep 2.

Engineered 3D vessel-on-chip using hiPSC-derived endothelial- and vascular smooth muscle cells

Affiliations

Engineered 3D vessel-on-chip using hiPSC-derived endothelial- and vascular smooth muscle cells

Marc Vila Cuenca et al. Stem Cell Reports. .

Abstract

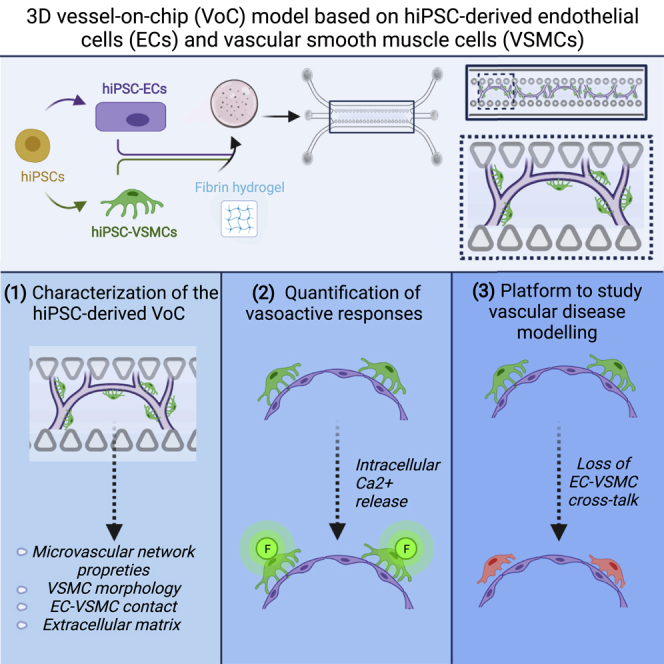
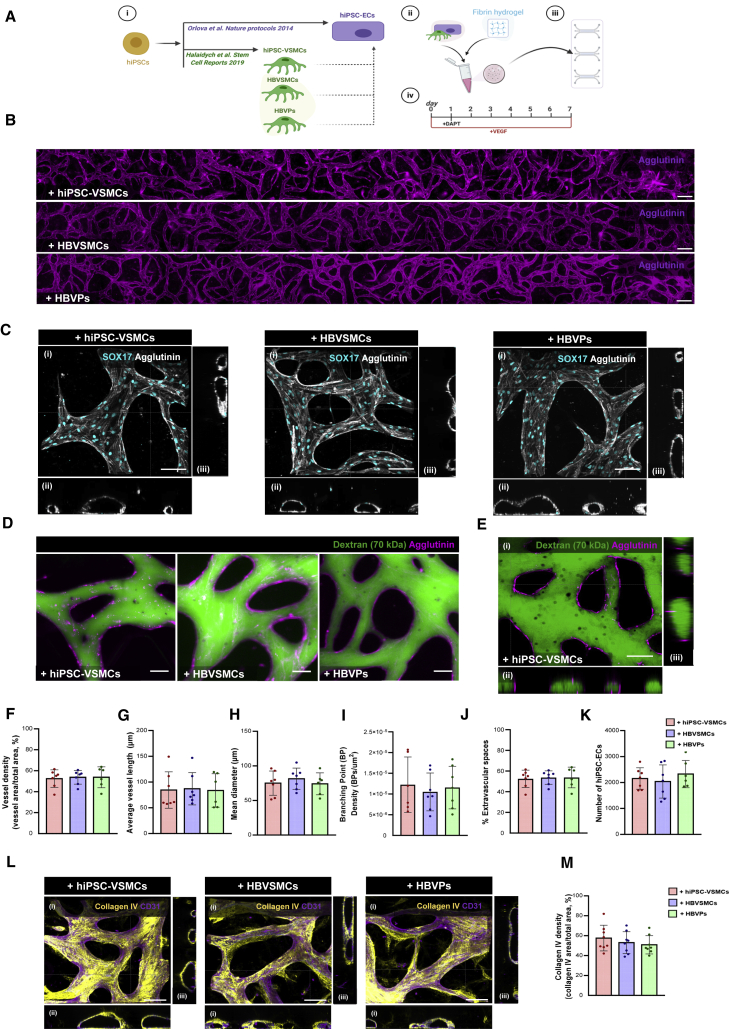
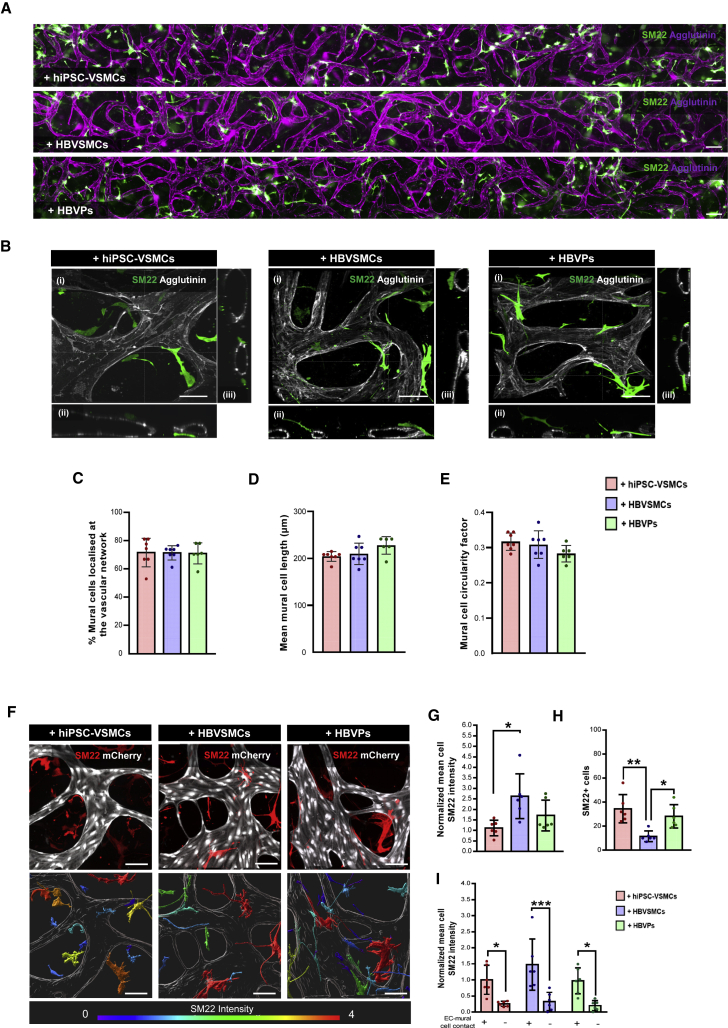
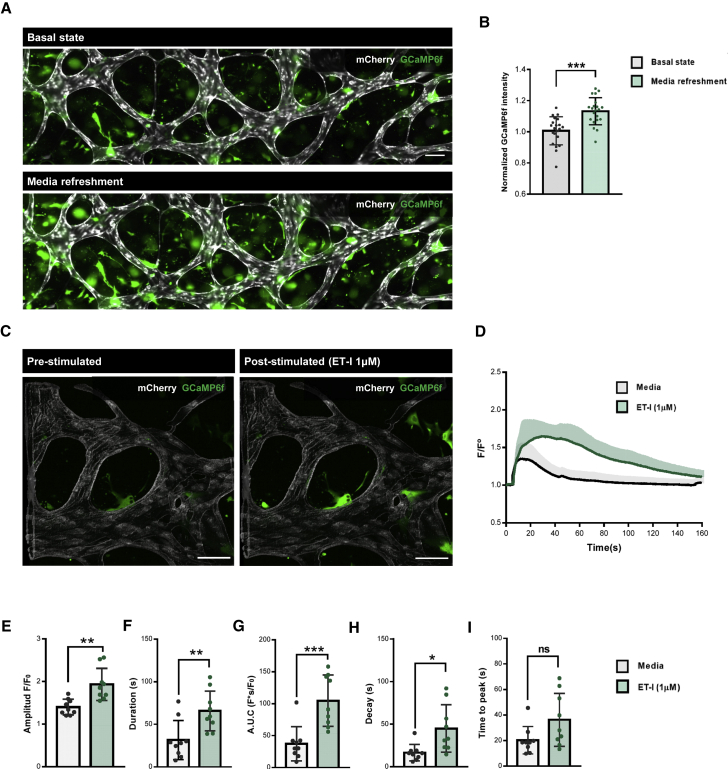
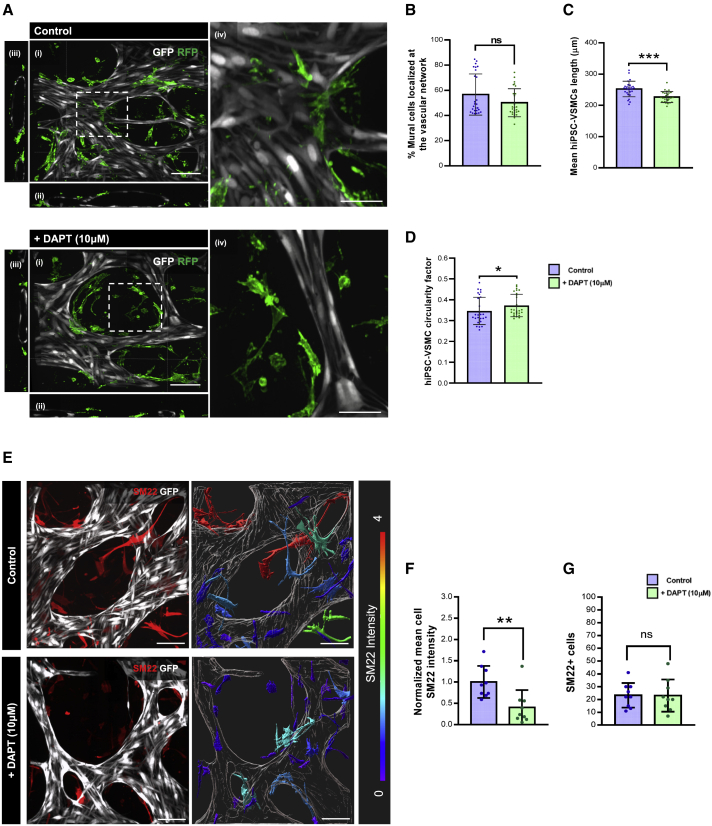
Crosstalk between endothelial cells (ECs) and pericytes or vascular smooth muscle cells (VSMCs) is essential for the proper functioning of blood vessels. This balance is disrupted in several vascular diseases but there are few experimental models which recapitulate this vascular cell dialogue in humans. Here, we developed a robust multi-cell type 3D vessel-on-chip (VoC) model based entirely on human induced pluripotent stem cells (hiPSCs). Within a fibrin hydrogel microenvironment, the hiPSC-derived vascular cells self-organized to form stable microvascular networks reproducibly, in which the vessels were lumenized and functional, responding as expected to vasoactive stimulation. Vascular organization and intracellular Ca2+ release kinetics in VSMCs could be quantified using automated image analysis based on open-source software CellProfiler and ImageJ on widefield or confocal images, setting the stage for use of the platform to study vascular (patho)physiology and therapy.

Keywords: 3D vessel-on-chip; VoC; functional readouts; hiPSC-ECs; hiPSC-VSMCs; hiPSC-derived endothelial cells; hiPSC-derived vascular smooth muscle cells; microfluidics; organ-on-chip; vessels-on-chip.


Figures

None
Graphical abstract
Figure 1
Figure 1
Characterization of VoC (A) Schematic of the VoC protocol. hiPSC-ECs were cultured with hiPSC-VSMCs, HBVSMCs, or HBVPs (i). Cells were mixed in a fibrin hydrogel (ii) and injected into (AIM Biotech) microfluidic chips (iii). EGM-2 was supplemented with VEGF (50 ng/mL), chips were refreshed daily for 7 days. EGM-2 was also supplemented with DAPT (10 μM) on day 1 for 24 h (iv). (B) Representative immunofluorescence images of microvascular network showing hiPSC-EC (magenta; agglutinin) vessels spanning the complete length of the microfluidic channel. Images showing hiPSC-ECs cultured with hiPSC-VSMCs, HBVSMCs, or HBVPs, respectively (10×). Scale bars, 200 μm. (C) Representative confocal images of microvascular network showing hiPSC-ECs (gray; agglutinin) and hiPSC-EC nuclei (cyan; SOX17). Images displaying xyz (i), xy (ii), and yz cross-sectional perspectives (iii). Images showing hiPSC-ECs cultured with hiPSC-VSMCs, HBVSMCs, or HBVPs, respectively (40×). Scale bars, 100 μm. (D) Representative Immunofluorescence images showing hiPSC-ECs (magenta; agglutinin) and perfusion of 70 kDa FITC-Dextran (green). Images showing hiPSC-ECs cultured with hiPSC-VSMCs, HBVSMCs, or HBVPs, respectively (10×). Scale bars, 50 μm. (E) Representative confocal images showing hiPSC-ECs (magenta; agglutinin) and perfusion of 70 kDa FITC-Dextran (green) in hiPSC-VoC. Images displaying xyz (i), xy (ii), and yz cross-sectional perspectives (iii) (40×). Scale bars, 100 μm. (F–K) Quantification of vessel density (%) (F), average vessel length (μm) (G), mean diameter (μm) (H), branching point (BP) density (BPs/μm2) (I) extravascular spaces (%) (J), and number of hiPSC-ECs (K), from hiPSC-ECs cultured with hiPSC-VSMCs, HBVSMCs, or HBVPs, respectively, are shown. Data are shown as ±SD from N = 3, n = 6; three independent experiments with two microfluidic channels per experiment. (L) Representative confocal images of microvascular network showing hiPSC-ECs (magenta; CD31) and ECM (yellow; collagen IV). Images displaying xyz (i), xy (ii), and yz cross-sectional perspectives (iii). Images showing hiPSC-ECs cultured with hiPSC-VSMCs, HBVSMCs, or HBVPs, respectively (40×). Scale bars, 100 μm. (M) Quantification of collagen IV density (%) from hiPSC-ECs cultured with hiPSC-VSMCs, HBVSMCs, or HBVPs, respectively, are shown. Data are shown as ±SD from N = 3, n = 8; three independent biological replicates with two to three microfluidic channels per experiment. One-way ANOVA with Tukey's multiple comparison. See also Figures S1 and S2A–S2D and Video S1.
Figure 2
Figure 2
Quantitative assessment of the structural proprieties of hiPSC-VSMCs and primary mural cells in VoC (A) Representative immunofluorescence images of microvascular network showing the hiPSC-ECs (magenta; agglutinin) and mural cells (green; SM22) derived vasculature unit spanning the complete length of microfluidic channel. Images showing hiPSC-ECs cultured with hiPSC-VSMCs, HBVSMCs, or HBVPs, respectively (10×). Scale bars, 200 μm. (B) Representative confocal images of microvascular network showing hiPSC-ECs (gray; agglutinin) and mural cells (green; SM22). Images displaying xyz (i), xy (ii), and yz cross-sectional perspectives (iii). Images showing hiPSC-ECs cultured with hiPSC-VSMCs, HBVSMCs, or HBVPs, respectively (40×). Scale bars, 100 μm. (C–E) Quantification of the percentage of mural cells associated with the hiPSC-EC lumen (% mural cells localized at the vascular network) (C), mean mural cell length (μm) (D), and mural cell circularity factor (the circle is 1) (E) in hiPSC-VSMCs, HBVPs, and HBVSMCs. Data are shown as ±SD from N = 3, n = 6; three independent experiments with two microfluidic channels per experiment. (F) (Top) Representative confocal images of microvascular network showing hiPSC-ECs (gray; mCherry) and mural cells (red; SM22). (Bottom) Representative surface-rendered objects of confocal images showing microvascular network (gray; mCherry) and mural cells (colour-coded scale representing SM22 intensity). Images showing hiPSC-ECs cultured with hiPSC-VSMCs, HBVSMCs, or HBVPs, respectively (40×). Scale bars, 100 μm. (G–I) Quantification of normalized mean cell SM22 intensity (G), number of SM22 + cells (H), and normalized mean cell SM22 intensity of mural cells in contact with hiPSC-ECs (I) in hiPSC-VSMCs, HBVPs and HBVSMCs. Intensity was normalized to hiPSC-VSMCs. Data are shown as ±SD from N = 3, n = 6; three independent experiments with two microfluidic channels per experiment. One-way ANOVA (C–E and G–H) and two-way ANOVA (I) with Tukey's multiple comparison. p < 0.05, ∗∗p < 0.001, ∗∗∗p < 0.0001. See also Figures S2E and S2F.
Figure 3
Figure 3
Analysis of hiPSC-VSMCs Ca2+ dynamics in VoC (A) Representative immunofluorescent images of intracellular Ca2+ fluorescence showing hiPSC-ECs (gray; mCherry) and hiPSC-VSMCs (green; GCaMP6f) without- (basal state) and after EGM-2 refreshment on day 7 (10×). Scale bar, 100 μm. (B) Normalized GCaMP6f intensity at day 7. GCaMP6f intensity was normalized to the condition prior to EGM-2 refreshment (basal state). Data are shown as ±SD of N = 3, n = 21; three independent experiments with seven microfluidic channels per experiment. (C) Representative confocal images of intracellular Ca2+ fluorescence showing with hiPSC-ECs (gray; mCherry) and hiPSC-VSMCs (green; GCaMP6f) in pre- and post-stimulated (ET-I, 1 μM) states (20×). Scale bar, 100 μm. (D) Normalized average fluorescence intensity F/F0 in hiPSC-VSMCs expressing GCaMP6f. Medium channels were gravity-flow perfused with EGM-2 alone or containing ET-I (1 μM). Stimulation time point is set as t = 5(s). Data are shown as ±SD of N = 3, n = 9; three independent experiments with three microfluidic channels per experiment. (E–I) Ca2+ transient parameters: amplitude F/F0 (E), duration (s) (F), area under the curve (AUC, Fs/F0) (G), time to peak (s) (H), and decay (s) (I) of channels gravity-flow perfused with EGM-2 alone or containing ET-I (1 μM). Data are shown as ±SD of N = 3, n = 9; three independent experiments with three microfluidic channels per experiment. Paired (B) Student's t test. Wilcoxon-Mann-Whitney test (E–I). p < 0.05, ∗∗p < 0.001, ∗∗∗p < 0.0001; ns, not significant. See also Figure S3 and Video S2.
Figure 4
Figure 4
Modeling loss of EC-VSMC crosstalk in VoC (A) Representative confocal images of microvascular network showing in hiPSC-ECs (gray; GFP) and hiPSC-VSMCs (green; RFP) in control and DAPT (10 μM) supplemented conditions. Images displaying xyz (i), xy, (ii), yz cross-sectional perspectives (iii), and enlargements of white framed areas (iv) (40×). Scale bars, 100 μm in (i–iii) and 50 μm in (iv). (B–D) Quantification of the percentage of hiPSC-VSMCs associated with the hiPSC-EC lumen (% mural cells localized at the vascular network) (B), mean hiPSC-VSMCs length (μm) (C), and hiPSC-VSMC circularity factor (the circle is 1) (D) in control and DAPT (10 μM) supplemented conditions at day 7. Data are shown as ±SD from N = 3, n = 27; three independent experiments with nine microfluidic channels per experiment. (E) (Left) Representative confocal images of microvascular network showing hiPSC-ECs (gray; mCherry) and hiPSC-VSMCs cells (red; SM22). (Right) Representative surface-rendered objects of confocal images showing microvascular network (gray; mCherry) and hiPSC-VSMCs (colour-coded scale representing SM22 intensity) in control and DAPT (10 μM) supplemented conditions (40×). Scale bars, 100 μm. (F and G) Quantification of normalized mean cell SM22 intensity (F) and number of SM22 + cells (G). Intensity was normalized to control condition. Data are shown as ±SD from N = 3, n = 9; three independent experiments with three microfluidic channels per experiment. Wilcoxon-Mann-Whitney test. p < 0.05, ∗∗p < 0.001, ∗∗∗p < 0.0001; ns, not significant. See also Figure S4.

References

    1. Belair D.G., Whisler J.A., Valdez J., Velazquez J., Molenda J.A., Vickerman V., Lewis R., Daigh C., Hansen T.D., Mann D.A., et al. Human vascular tissue models formed from human induced pluripotent stem cell derived endothelial cells. Stem Cell Rev. Rep. 2015;11:511–525. - PMC - PubMed
    1. Berry C., Sidik N., Pereira A.C., Ford T.J., Touyz R.M., Kaski J.C., Hainsworth A.H. Small-vessel disease in the heart and brain: current knowledge, unmet therapeutic need, and future directions. J. Am. Heart Assoc. 2019;8:e011104. - PMC - PubMed
    1. Campisi M., Shin Y., Osaki T., Hajal C., Chiono V., Kamm R.D. 3D self-organized microvascular model of the human blood-brain barrier with endothelial cells, pericytes and astrocytes. Biomaterials. 2018;180:117–129. - PMC - PubMed
    1. Chen T.W., Wardill T.J., Sun Y., Pulver S.R., Renninger S.L., Baohan A., Schreiter E.R., Kerr R.A., Orger M.B., Jayaraman V., et al. Ultrasensitive fluorescent proteins for imaging neuronal activity. Nature. 2013;499:295–300. - PMC - PubMed
    1. Cochrane A., Albers H.J., Passier R., Mummery C.L., van den Berg A., Orlova V.V., van der Meer A.D. Advanced in vitro models of vascular biology: human induced pluripotent stem cells and organ-on-chip technology. Adv. Drug Deliv. Rev. 2019;140:68–77. - PubMed

Publication types

MeSH terms