. 2021 Dec 1;1863(12):183757.
doi: 10.1016/j.bbamem.2021.183757. Epub 2021 Aug 31.

TXNIP interaction with GLUT1 depends on PI(4,5)P2

Affiliations

TXNIP interaction with GLUT1 depends on PI(4,5)P2

Holly Dykstra et al. Biochim Biophys Acta Biomembr. .

Abstract

GLUT1 is a major glucose facilitator expressed ubiquitously among tissues. Upregulation of its expression plays an important role in the development of many types of cancer and metabolic diseases. Thioredoxin-interacting protein (TXNIP) is an α-arrestin that acts as an adaptor for GLUT1 in clathrin-mediated endocytosis. It regulates cellular glucose uptake in response to both intracellular and extracellular signals via its control on GLUT1-4. In order to understand the interaction between GLUT1 and TXNIP, we generated GLUT1 lipid nanodiscs and carried out isothermal titration calorimetry and single-particle electron microscopy experiments. We found that GLUT1 lipid nanodiscs and TXNIP interact in a 1:1 ratio and that this interaction requires phosphatidylinositol 4,5-bisphosphate (PI(4,5)P2 or PIP2).

Keywords: Electron microscopy; GLUT1; Glucose metabolism; Nanodiscs; PI(4,5)P(2); TXNIP (thioredoxin-interacting protein).


Conflict of interest statement

Declaration of competing interests

The authors declare that they have no known competing financial interests or personal relationships that could have appeared to influence the work reported in this paper.

Figures

Figure 1.
Figure 1.
Insertion of GLUT1 into lipid nanodiscs (A) Ni-NTA elution of GLUT1 fractions 1 to 6 plus PD10 buffer-exchanged GLUT1. (B) Ni-NTA elution of GLUT1/PIP2/MSP1E3 nanodisc fractions. (C) Superdex 200 elution profile (standard molecular weight markers are indicated by dashed lines) and (D) SDS-PAGE gel (fractions 8-21) of GLUT1/PIP2/MSP1E3 nanodiscs.
Figure 2.
Figure 2.
Electron microscopy characterization of GLUT1 nanodiscs (A) A representative negative-stain EM micrograph of PIP2/MSP1E3 nanodiscs; some particles display the stacked formation. (B) 2D class averages from negative-stain PIP2/MSP1E3 nanodisc images, showing top views (upper row) and side views (lower row). Scale bar represents 10 nm. (C) A representative negative-stain EM micrograph of GLUT1/PIP2/MSP1E3 nanodiscs. With bound GLUT1, the nanodisc stacking is reduced. (D) 2D class averages from negative-stain images of GLUT1/PIP2/MSP1E3 nanodiscs, showing top views (upper row) and side views (lower row). Scale bar represents 10 nm.
Figure 3.
Figure 3.
TXNIP interaction with GLUT1/PIP2/MSP1E3 nanodiscs (A) SDS-PAGE gel of TXNIP elution fractions 8-21 from Superdex 200. (B) SDS-PAGE gel of GLUT1/PIP2/MSP1E3 nanodiscs with TXNIP elution fractions 8-18 from Superdex 200. (C) The elution profile from panel B. Standard molecular weight markers are indicated by dashed lines. (D) Overlay of elution profiles of GLUT1/PIP2/MSP1E3 nanodisc (dashed line) and GLUT1/PIP2/MSP1E3/TXNIP (solid line).
Figure 4.
Figure 4.
Interaction between TXNIP and GLUT1/PIP2/MSP1E3 nanodiscs is 1:1 by electron microscopy (A) 2D class averages from negative-stain GLUT1/PIP2/MSP1E3/TXNIP images. Scale bar represents 10 nm. (B) Side and top views of the GLUT1/PIP2/MSP1E3/TXNIP negative-stain 3D reconstruction. (C) Representative cryo-EM 2D class averages of GLUT1/PIP2/MSP1E3/TXNIP showing secondary structure elements. Scale bar represents 10 nm.
Figure 5.
Figure 5.
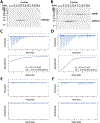
TXNIP interaction with GLUT1 requires PIP2 (A) Fractions 8-21 of PIP2/MSP1E3 nanodiscs. (B) Fractions 8-21 of PIP2/MSP1E3/TXNIP. (C) Representative ITC of PIP2/MSP1E3 nanodisc interaction with TXNIP. Differential power (DP) resulting from the injections is plotted against time, and binding enthalpy (ΔH) is plotted against the molar ratio of the proteins. The equilibrium dissociation constant (KD) = 43.3 ± 2.0 μM. ΔH = −3.97 ± 0.62 kcal/mol. (D) Representative ITC of GLUT1/PIP2/MSP1E3 nanodisc interaction with TXNIP. KD = 3.8 ± 0.7 μM. ΔH = −6.94 ± 0.86 kcal/mol. The molar ratio of GLUT1:TXNIP is set at 1 for graph fitting. (E) Representative ITC of GLUT1/PC/MSP1E3 nanodiscs with TXNIP. (F) Representative ITC of GLUT1/PIP2/MSP1E3 nanodiscs with the TXNIP K233A-R238A mutant.
Figure 6.
Figure 6.
TXNIP does not interact with GLUT5 (A) Fractions 8-21 of rGLUT5/PIP2/MSP1E3 in complex with TXNIP. (B) ITC of rGLUT5/PIP2/MSP1E3 nanodiscs with TXNIP. Differential power (DP) resulting from the injections is plotted against time, and binding enthalpy (ΔH) is plotted against the molar ratio of the proteins.

References

    1. Augustin R, The protein family of glucose transport facilitators: It’s not only about glucose after all. IUBMB Life, 2010. 62(5): p. 315–33. - PubMed
    1. Sano R, Shinozaki Y, and Ohta T, Sodium-glucose cotransporters: Functional properties and pharmaceutical potential. J Diabetes Investig, 2020. 11(4): p. 770–782. - PMC - PubMed
    1. Wright EM, Loo DD, and Hirayama BA, Biology of human sodium glucose transporters. Physiol Rev, 2011. 91(2): p. 733–94. - PubMed
    1. Waldhart AN, et al., Phosphorylation of TXNIP by AKT Mediates Acute Influx of Glucose in Response to Insulin. Cell Rep, 2017. 19(10): p. 2005–2013. - PMC - PubMed
    1. Wu N, et al., AMPK-dependent degradation of TXNIP upon energy stress leads to enhanced glucose uptake via GLUT1. Mol Cell, 2013. 49(6): p. 1167–75. - PMC - PubMed

Publication types

MeSH terms