. 2021 Nov:243:118541.
doi: 10.1016/j.neuroimage.2021.118541. Epub 2021 Aug 31.

An isotropic EPI database and analytical pipelines for rat brain resting-state fMRI

Affiliations

An isotropic EPI database and analytical pipelines for rat brain resting-state fMRI

Sung-Ho Lee et al. Neuroimage. 2021 Nov.

Abstract

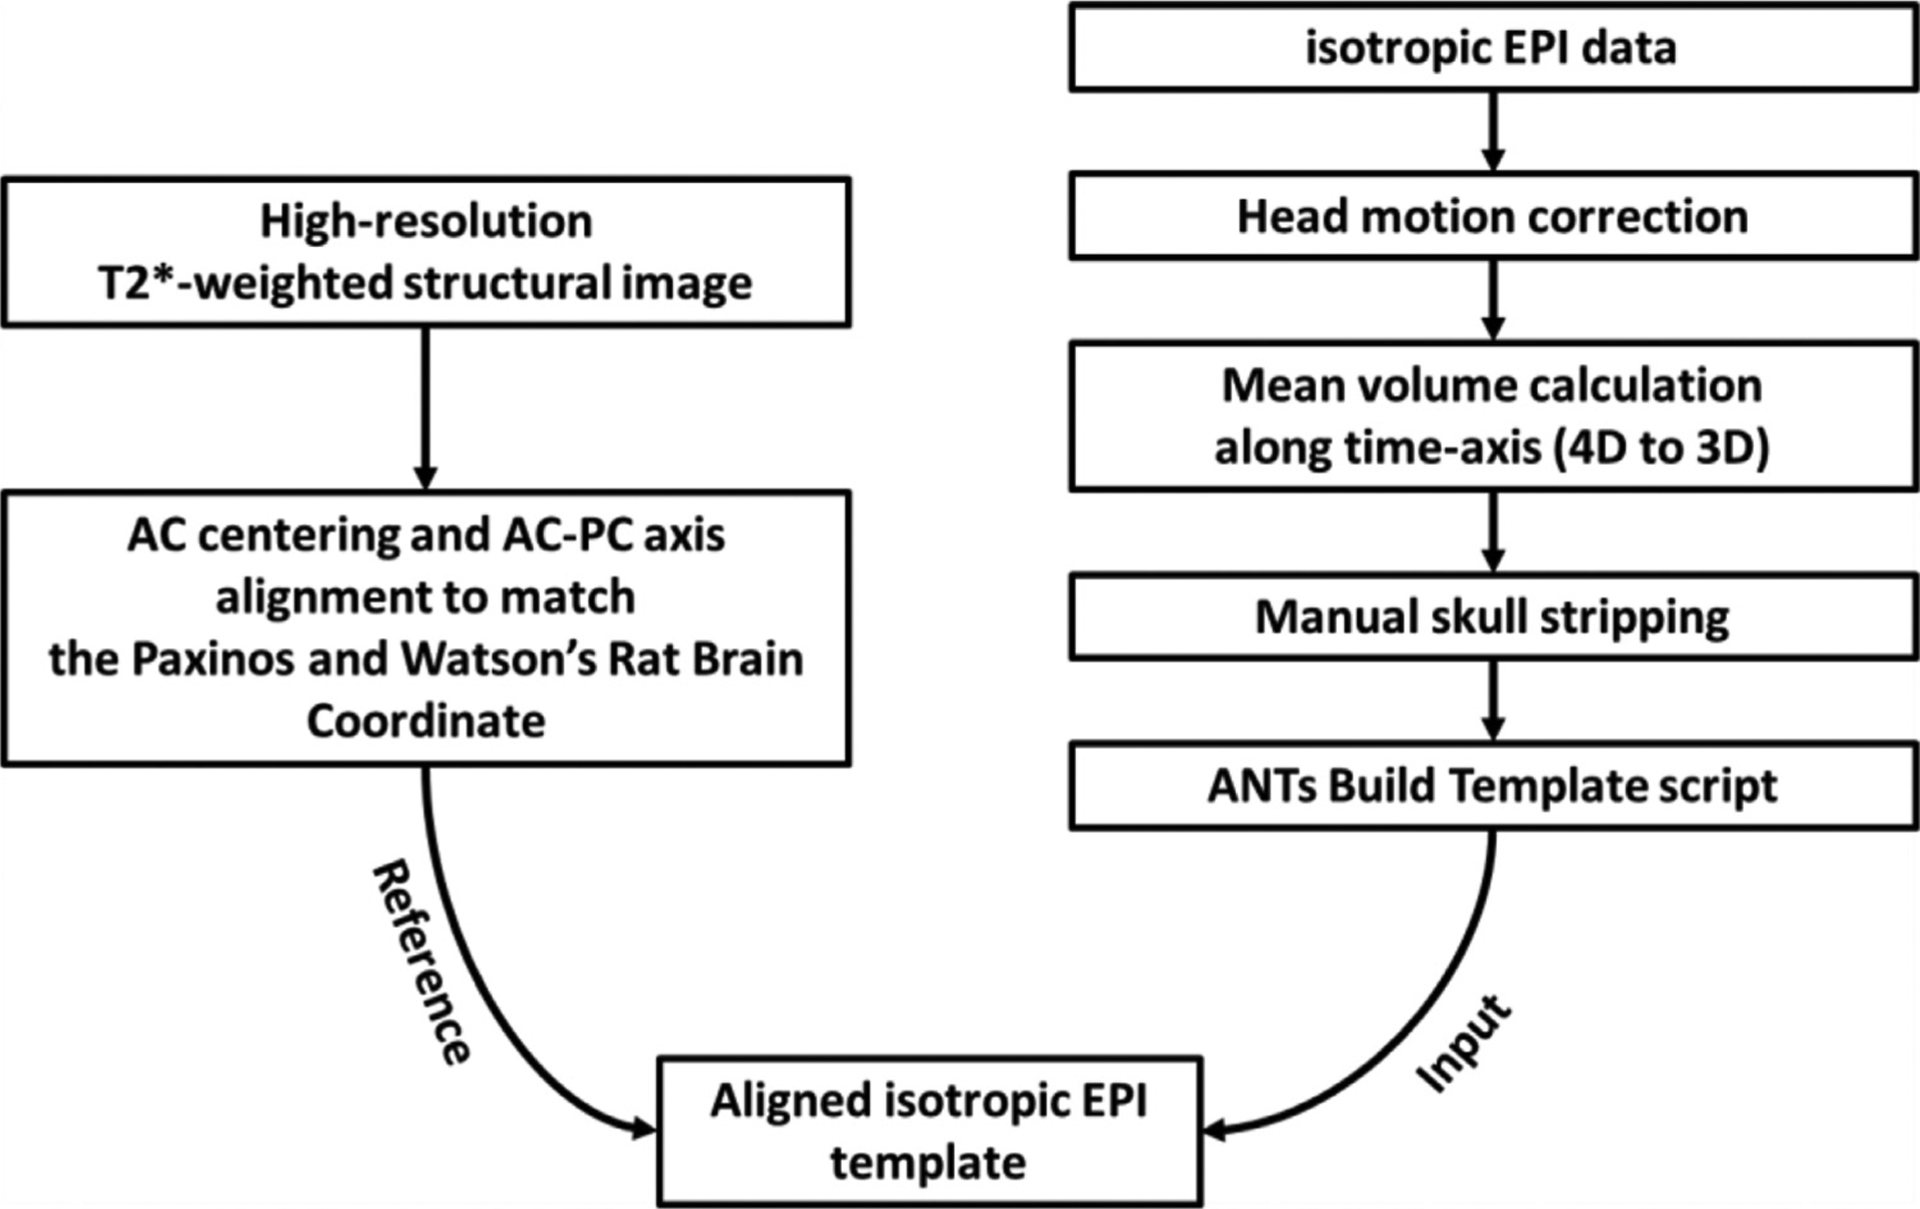
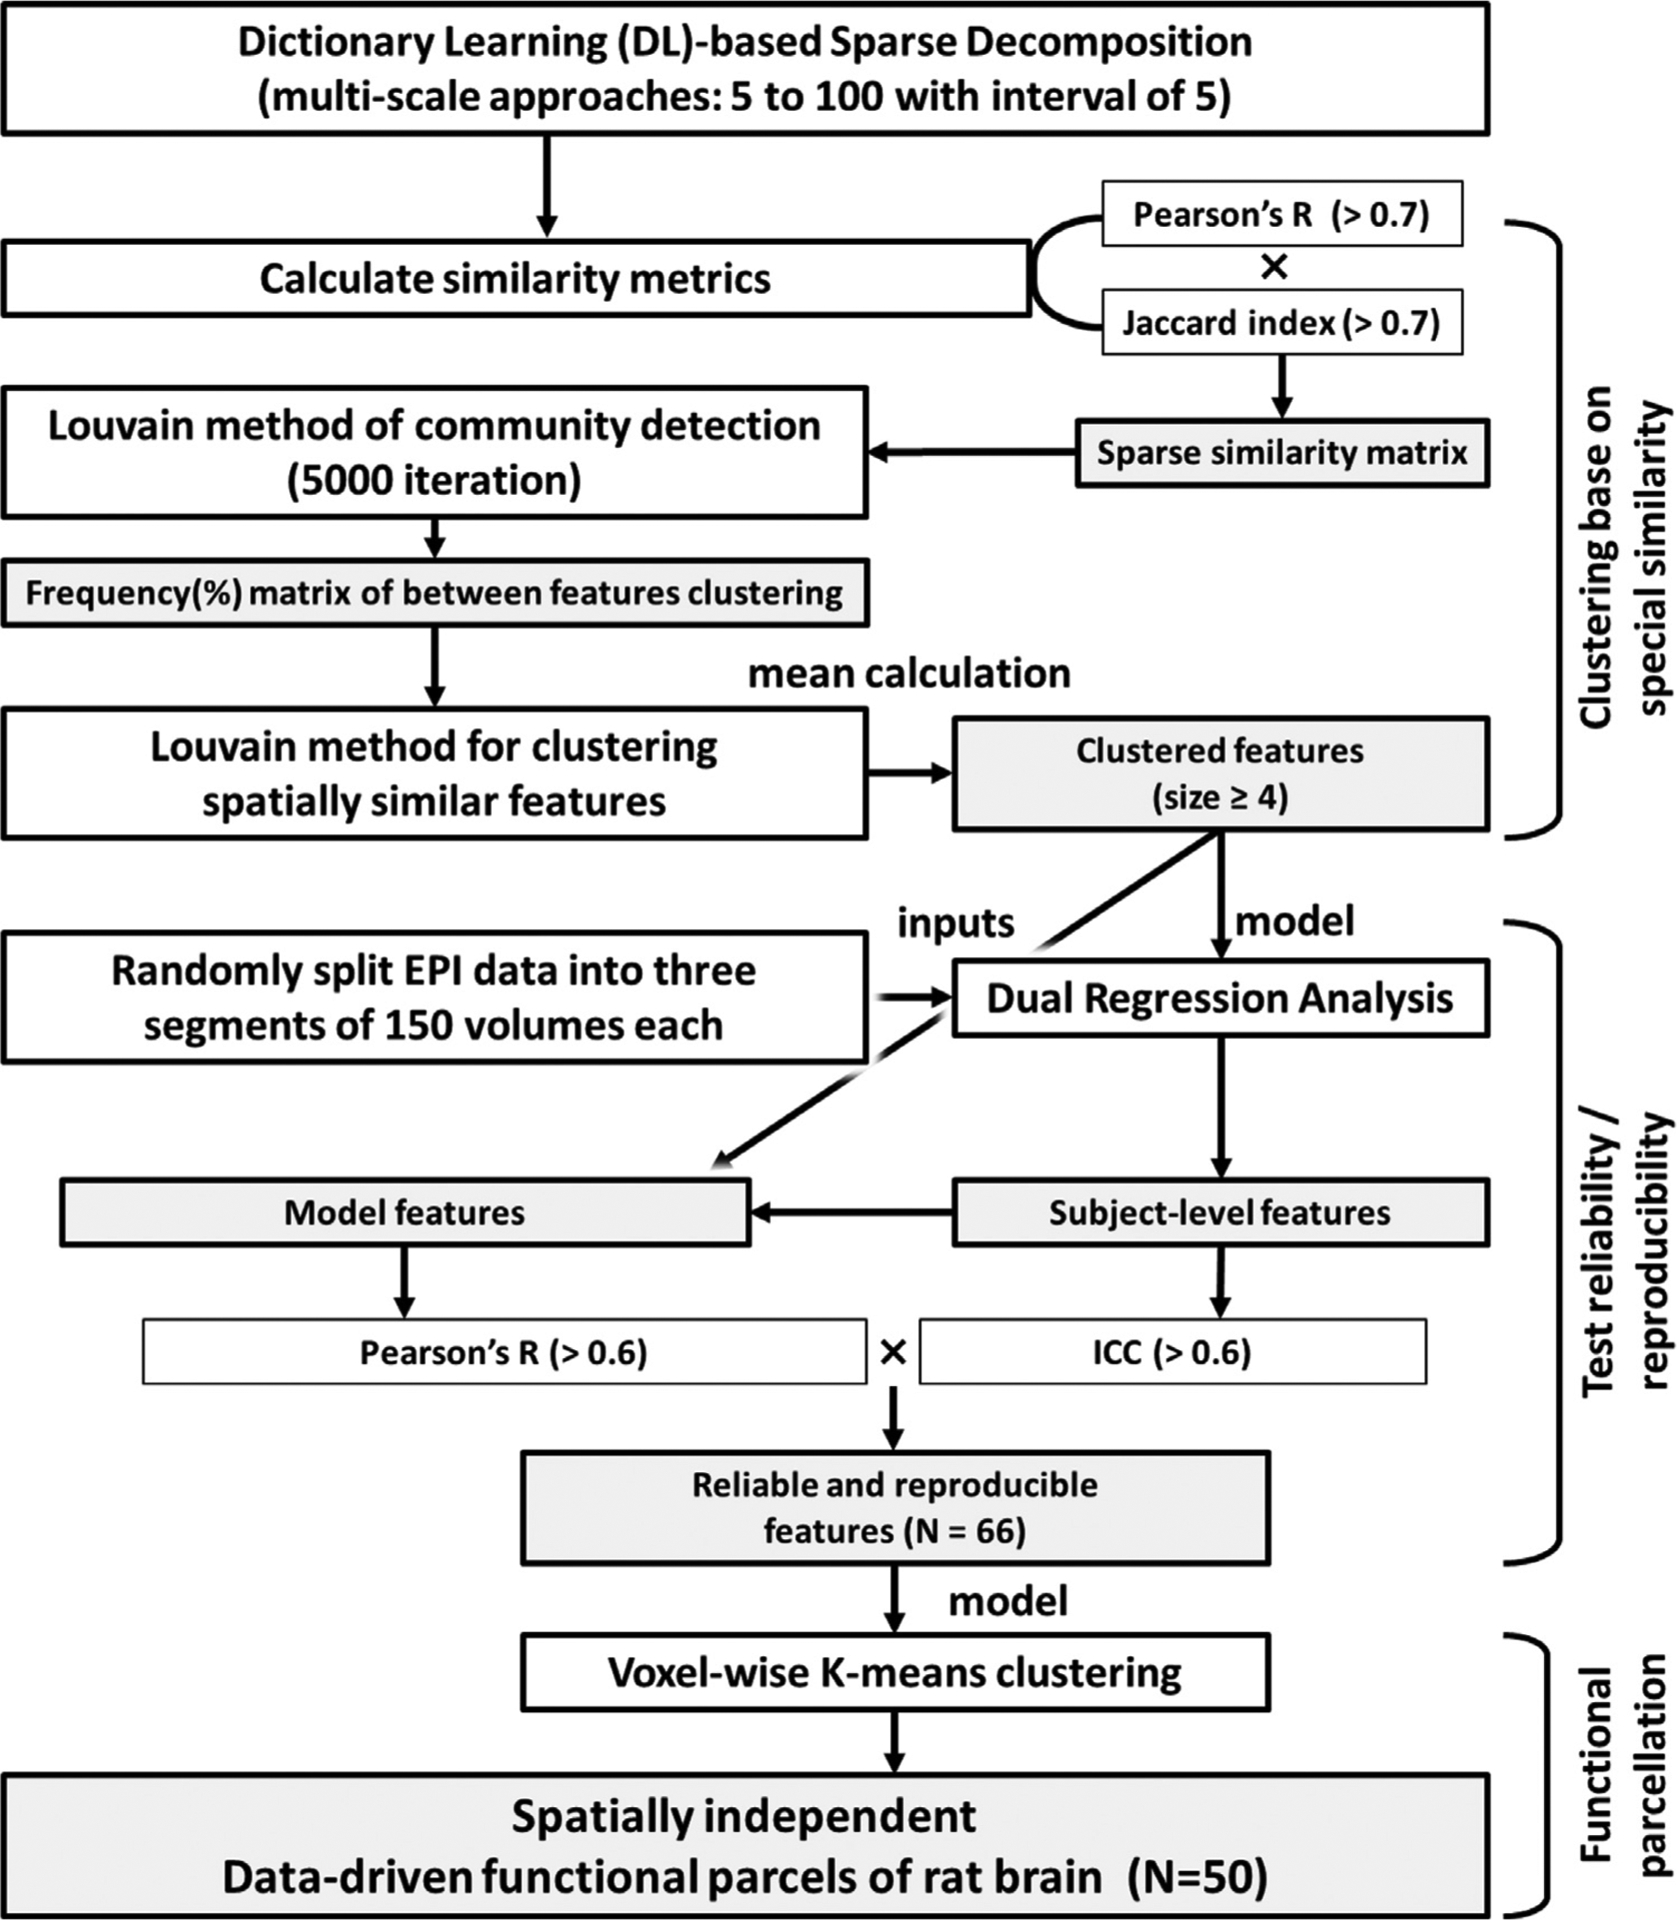
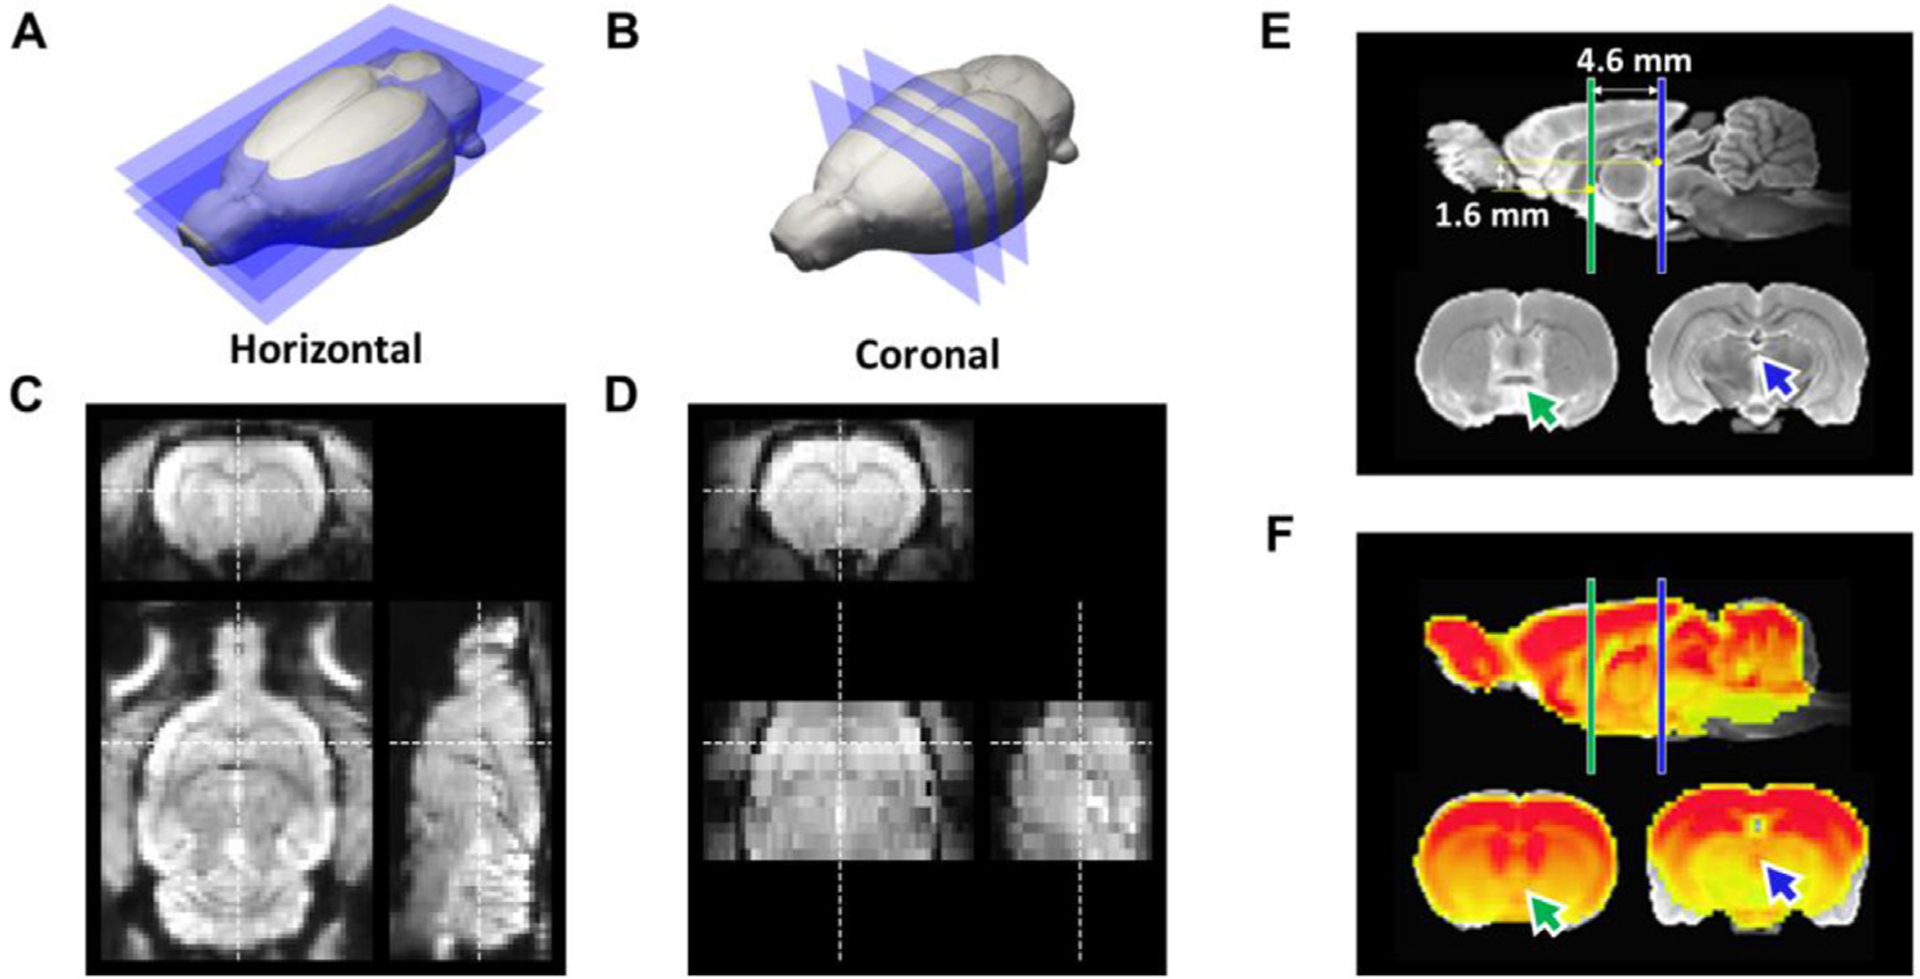
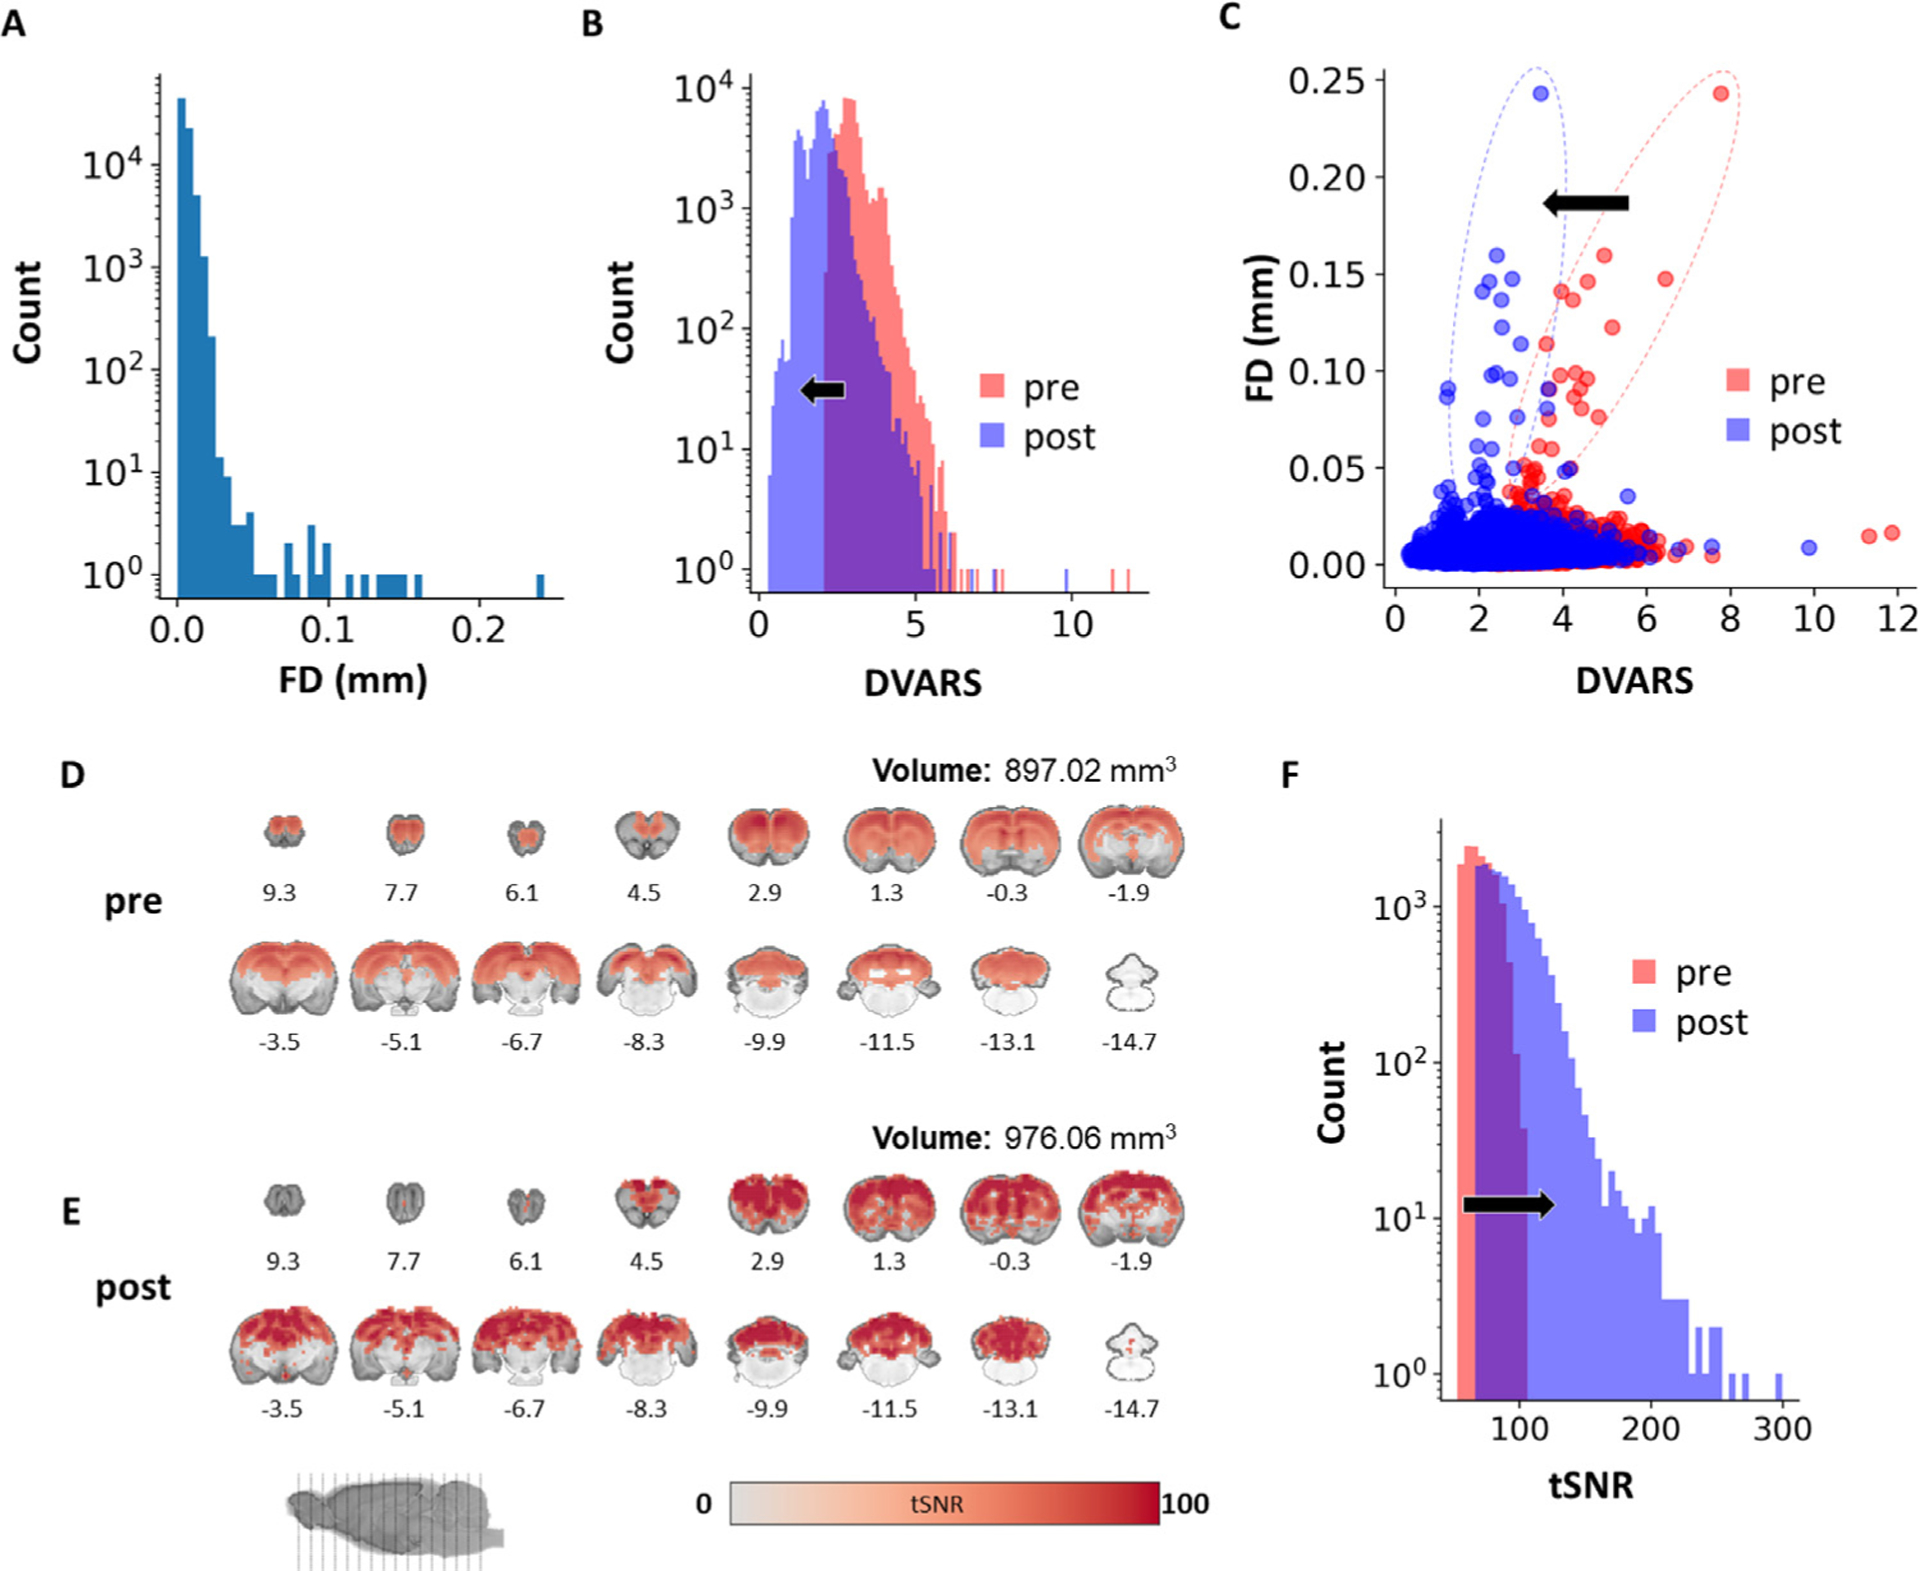
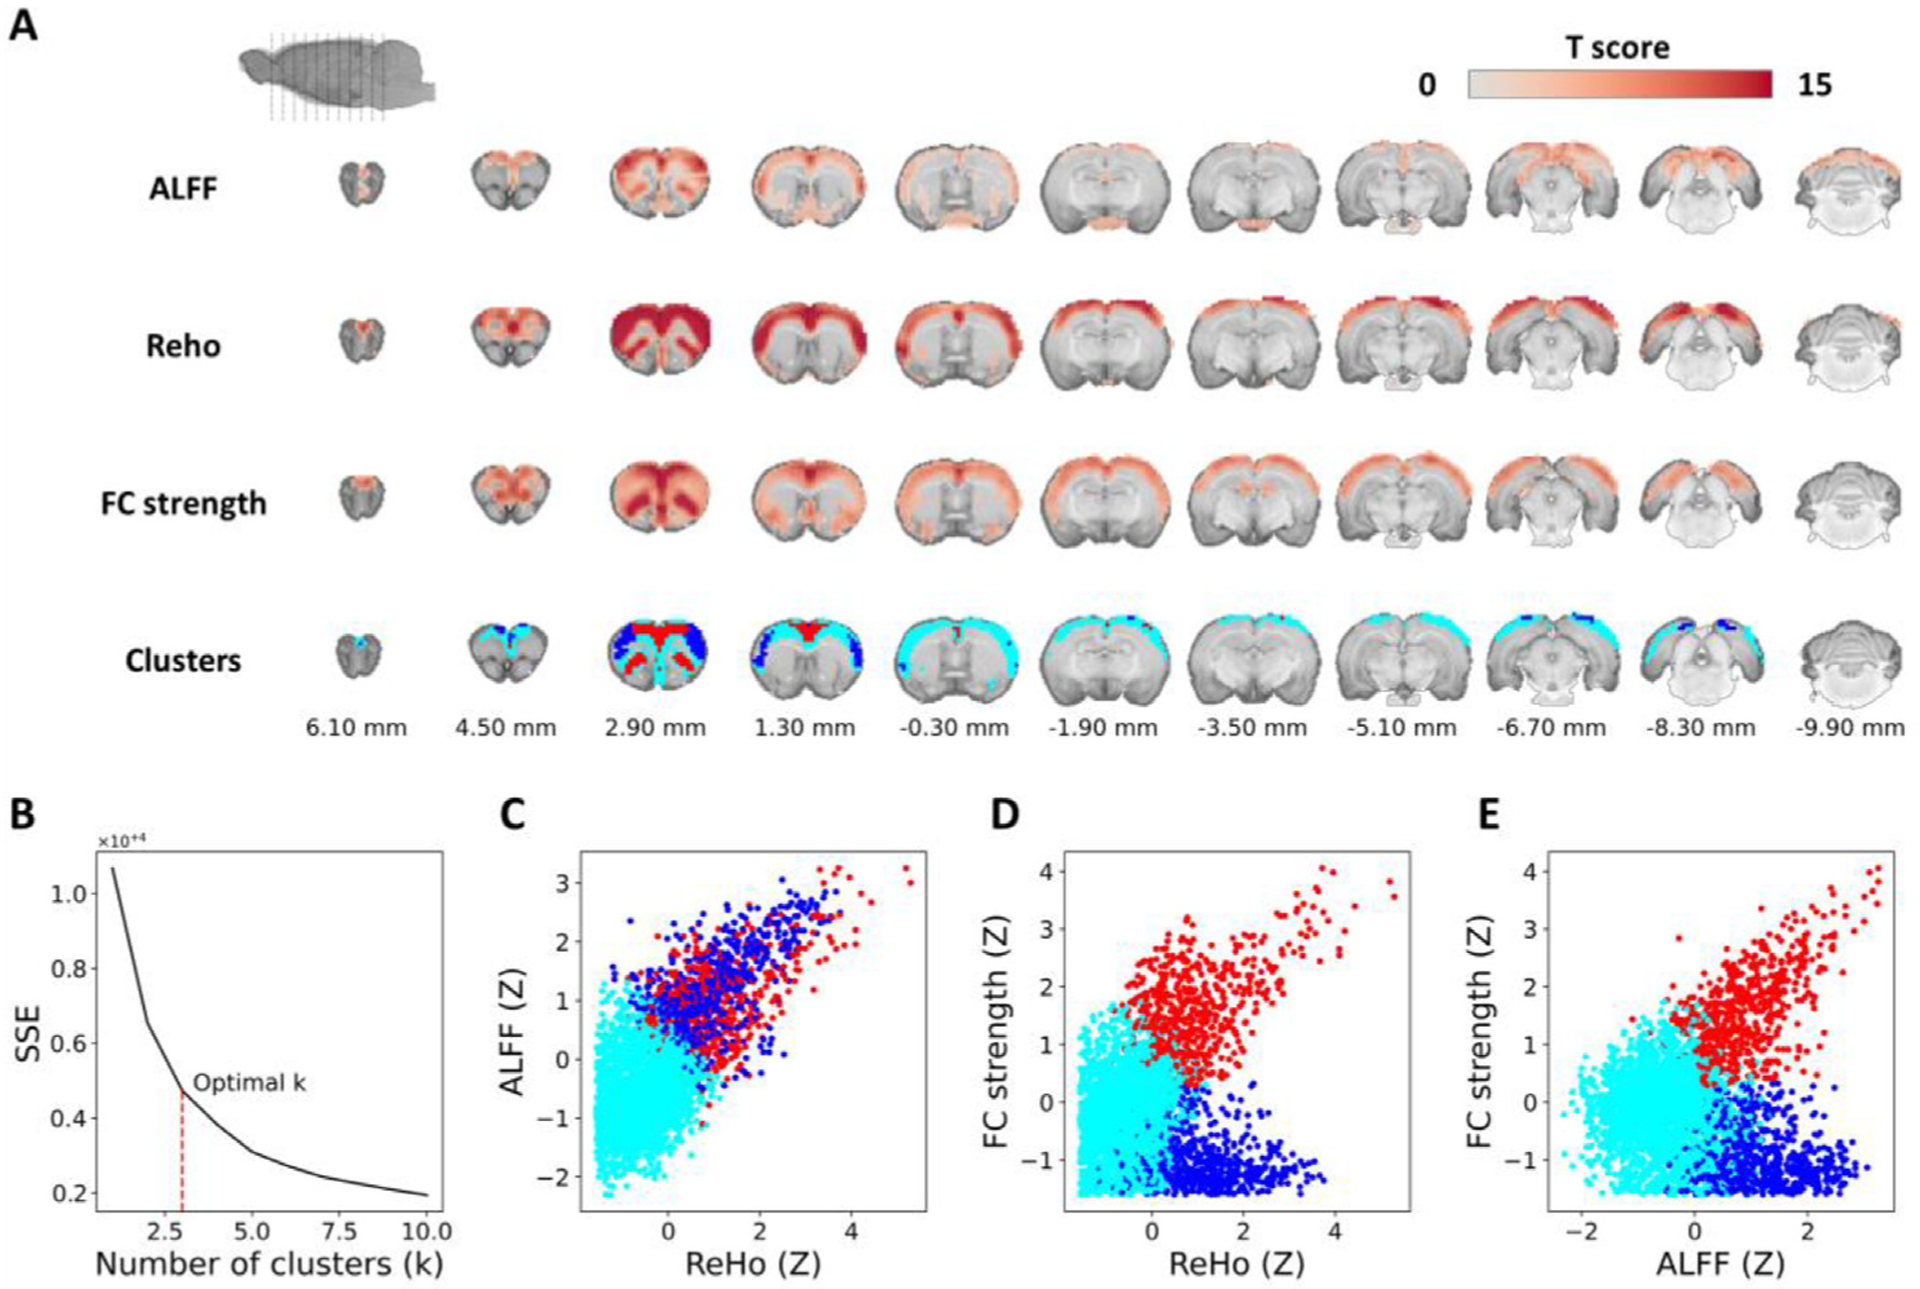
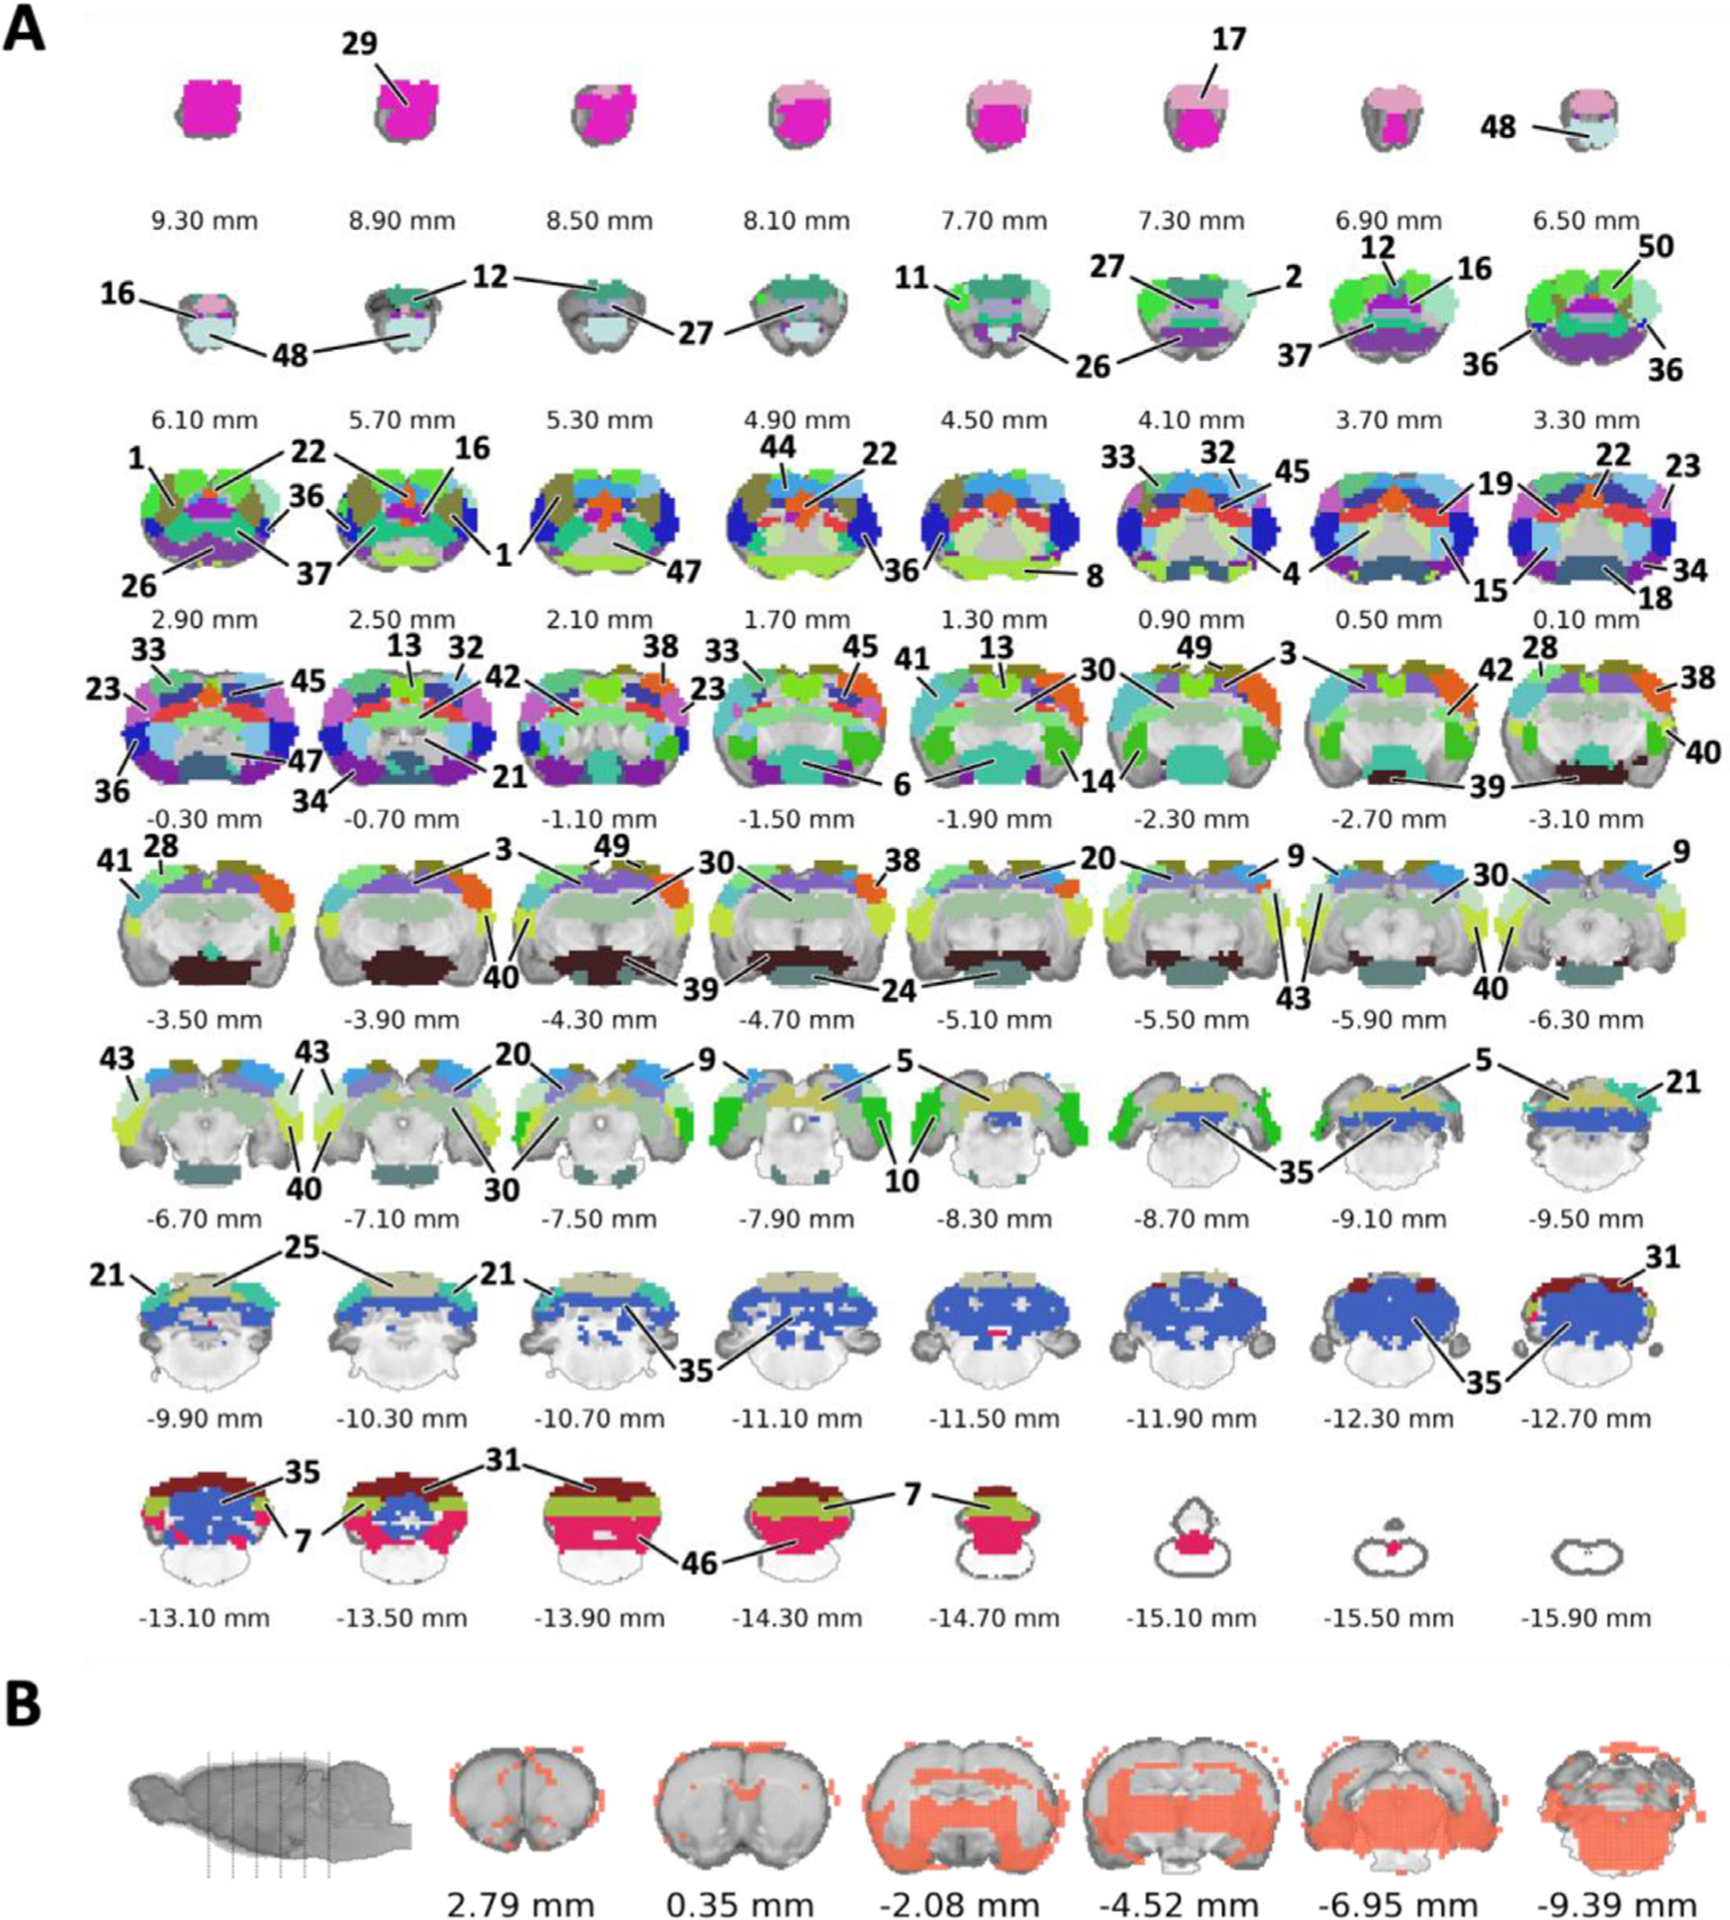
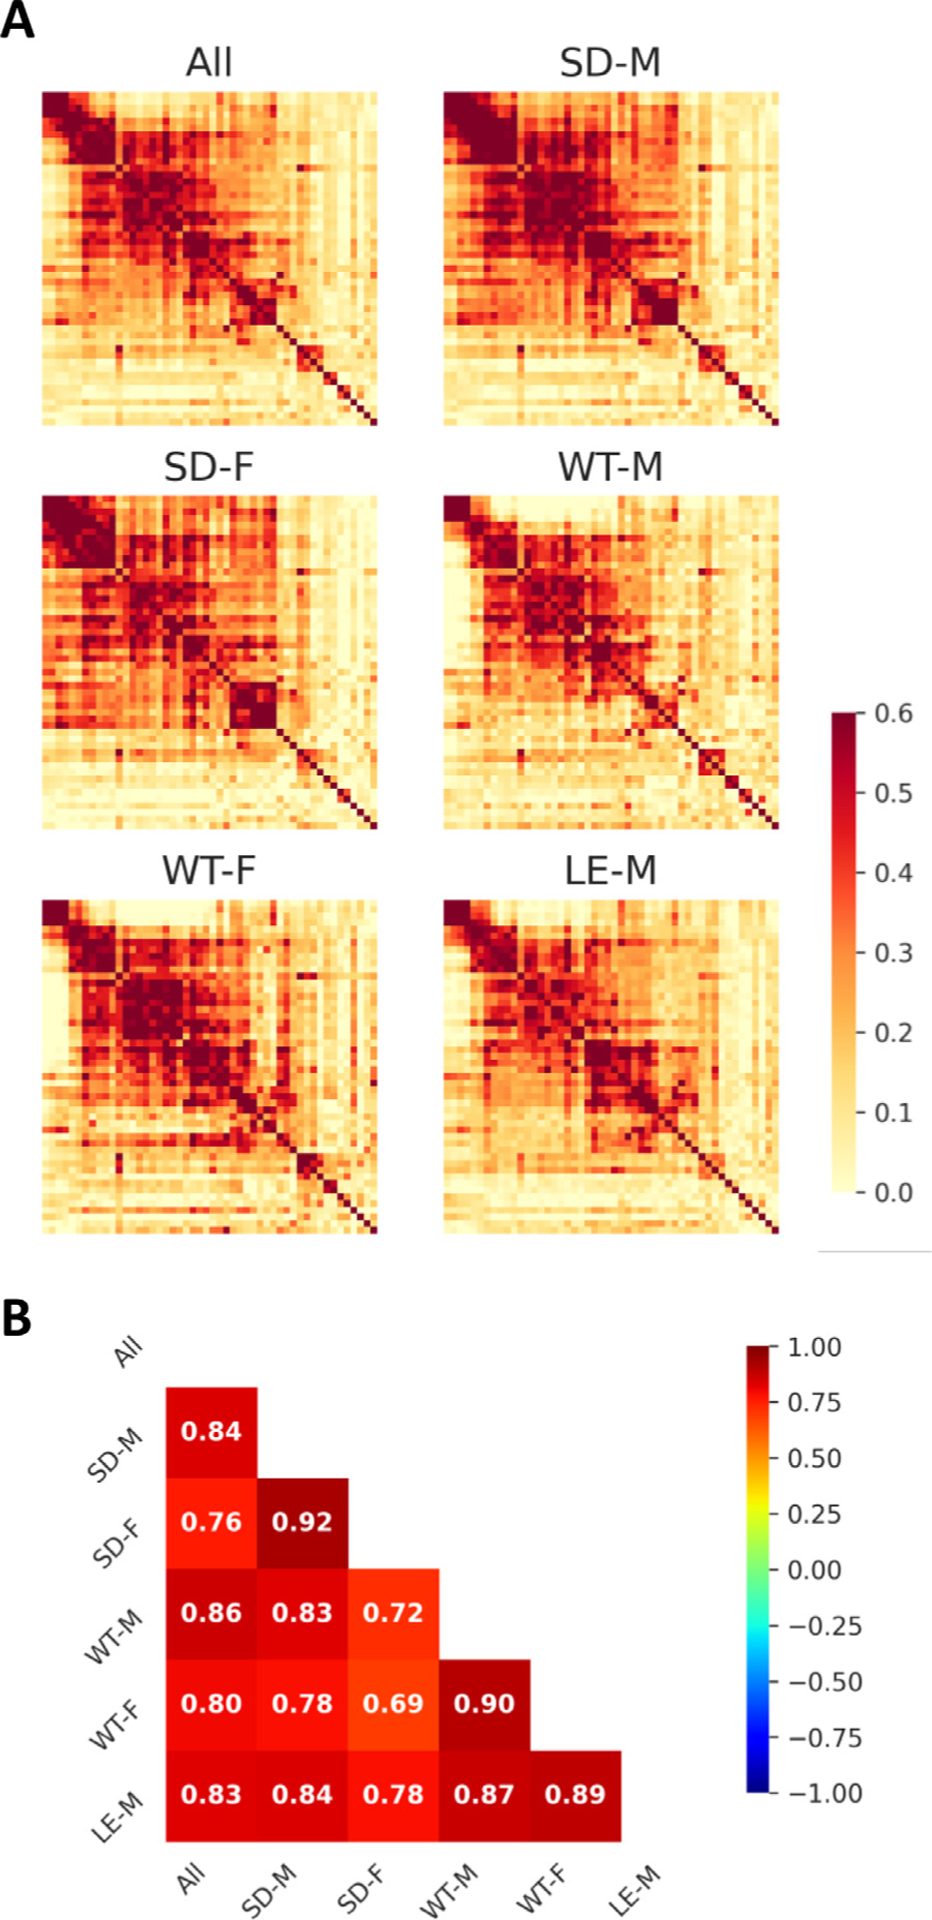
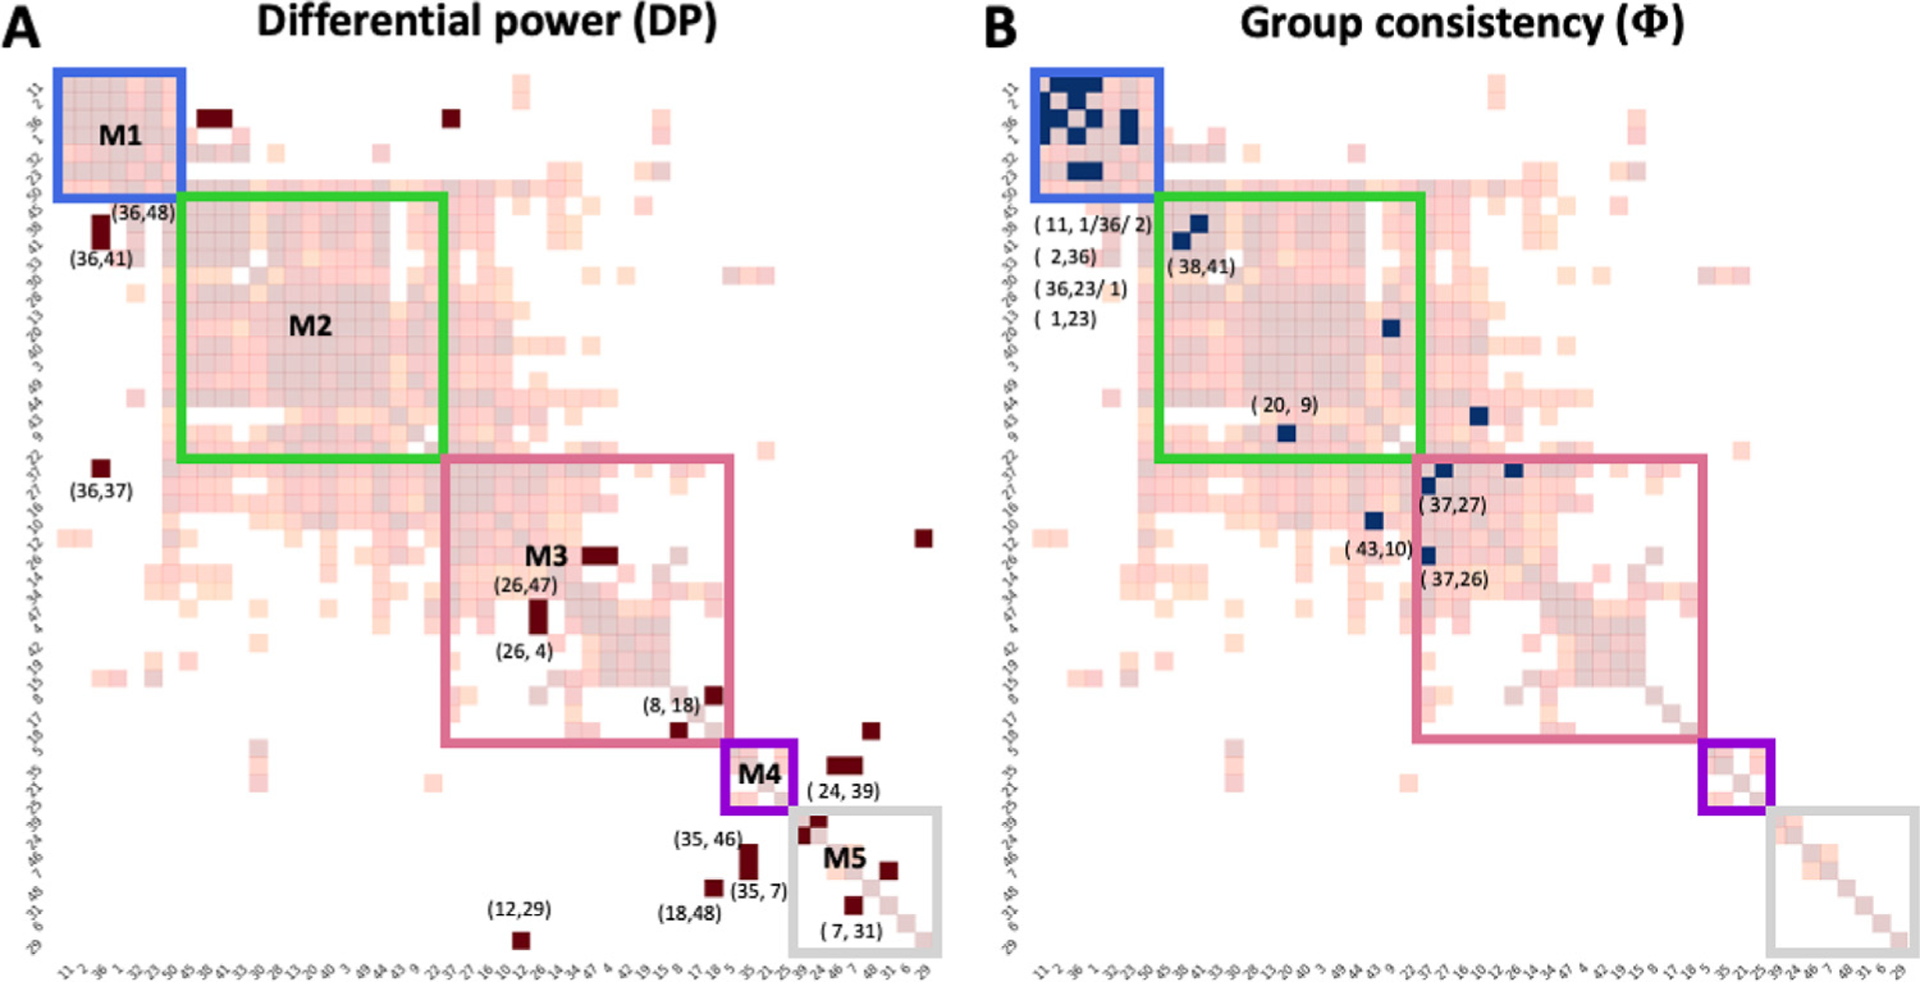
Resting-state functional magnetic resonance imaging (fMRI) has drastically expanded the scope of brain research by advancing our knowledge about the topologies, dynamics, and interspecies translatability of functional brain networks. Several databases have been developed and shared in accordance with recent key initiatives in the rodent fMRI community to enhance the transparency, reproducibility, and interpretability of data acquired at various sites. Despite these pioneering efforts, one notable challenge preventing efficient standardization in the field is the customary choice of anisotropic echo planar imaging (EPI) schemes with limited spatial coverage. Imaging with anisotropic resolution and/or reduced brain coverage has significant shortcomings including reduced registration accuracy and increased deviation in brain feature detection. Here we proposed a high-spatial-resolution (0.4 mm), isotropic, whole-brain EPI protocol for the rat brain using a horizontal slicing scheme that can maintain a functionally relevant repetition time (TR), avoid high gradient duty cycles, and offer unequivocal whole-brain coverage. Using this protocol, we acquired resting-state EPI fMRI data from 87 healthy rats under the widely used dexmedetomidine sedation supplemented with low-dose isoflurane on a 9.4 T MRI system. We developed an EPI template that closely approximates the Paxinos and Watson's rat brain coordinate system and demonstrated its ability to improve the accuracy of group-level approaches and streamline fMRI data pre-processing. Using this database, we employed a multi-scale dictionary-learning approach to identify reliable spatiotemporal features representing rat brain intrinsic activity. Subsequently, we performed k-means clustering on those features to obtain spatially discrete, functional regions of interest (ROIs). Using Euclidean-based hierarchical clustering and modularity-based partitioning, we identified the topological organizations of the rat brain. Additionally, the identified group-level FC network appeared robust across strains and sexes. The "triple-network" commonly adapted in human fMRI were resembled in the rat brain. Through this work, we disseminate raw and pre-processed isotropic EPI data, a rat brain EPI template, as well as identified functional ROIs and networks in standardized rat brain coordinates. We also make our analytical pipelines and scripts publicly available, with the hope of facilitating rat brain resting-state fMRI study standardization.

Keywords: Database; Echo planar imaging; Functional connectivity; Rat; Resting state fMRI.


Figures

Fig. 1.
Fig. 1.
Rat brain EPI template development pipeline which uses an EPI dataset with 0.4 mm isotropic spatial resolution and high-resolution T2*-weighted structural images.
Fig. 2.
Fig. 2.
Schematic diagram of the data-driven functional parcellation pipeline.
Fig. 3.
Fig. 3.
Comparison of two EPI protocols and the proposed coordinate system. (A) The proposed horizontal slicing scheme. (B) Conventional coronal slicing scheme. (C) Representative EPI images at 0.4 mm isotropic resolution acquired from horizontal slicing. (D) Representative EPI images with 0.32 × 0.32 × 1 mm anisotropic resolution acquired from coronal slicing. (E) A coordinate system centering at AC, with AC-PC axis alignment identical to the Paxinos and Watson’s (7th edition) rat brain atlas. (F) Co-registered isotropic EPI template on structural MRI template, showing high concordance except the areas prone to susceptibility artifacts, such as amygdala. Green arrow: AC; Blue arrow: PC.
Fig. 4.
Fig. 4.
Preprocessing pipeline using EPI-based template. (A) Schematic diagram of the pipeline. (B) Representative nonlinear registration results using isotropic EPI data with whole brain coverage. (C) Representative linear and nonlinear registration results using anisotropic EPI data with limited brain coverage. Red outline: outline of EPI-based template; Red arrow: missing data due to registration mismatch; Red rectangle: mis-localization of brain slices.
Fig. 5.
Fig. 5.
Quality profile of whole-brain isotropic EPI data (n = 87). (A) FD histogram of all subject time-courses. (B) DVARS histograms of all subject time-courses. (C) Scatterplot between framewise displacement and DVARS of all subjects. (D) Group-level voxel-wise tSNR map before nuisance removal (p < 0.05). (E) Group-level voxel-wise tSNR map after nuisance removal (p < 0.05), showing an overall increase in tSNR value and brain volume with significant tSNR on the group-level. (F) Histogram of all subject time-courses showing the effect of nuisance removal on tSNR. FD: framewise displacement; DVAR: brain image intensity changes with respect to the previous time point as opposed to the global signal; pre: without nuisance removal; post: with nuisance removal.
Fig. 6.
Fig. 6.
Voxel-level resting-state FC metrics. (A) Group-level significance maps of ALFF, ReHo, and FC strength and the three clusters identified using voxel-level k-means clustering in the Paxinos and Watson’s rat brain coordinates (0 mm indicates bregma location). (B) Elbow method to identify an optimal k-value. (C–E) Scatter plots comparing ReHo, ALFF, and FC strength.
Fig. 7.
Fig. 7.
Functional parcellation. (A) Representation of spatially discrete ROIs in the proposed AC-centered space approximating Paxinos and Watson’s (7th edition) rat brain coordinates. (B) Representation of a single non-specific parcel that excluded from the ROIs.
Fig. 8.
Fig. 8.
Functional connectivity specificity of the dataset. (A) seed-ROIs that was used for specificity analysis. (B) group statistical result of voxel-wise connectivity with the seed at left sensory cortex. (C) the scatter plot presenting the distribution of individual data among the criteria of specific FC (73.6%), unspecific FC (12.6%), spurious FC (10.3%), and no FC (3.4%).
Fig. 9.
Fig. 9.
Robust group-level FC networks group-level FC networks across rat strains and sexes. (A) Group-level FC matrices of all subjects and specific strain and sex sub-groups. (B) Matrix showing spatial correlation between all subjects and each strain and sex sub-groups. Color bars represent Pearson’s correlation coefficient. SD: Sprague Dawley; WT: Wistar; LE: Long-Evans; M: male; F: female.
Fig. 10.
Fig. 10.
Topologically organized FC matrix (permutation-based one-sample t-test, p < 0.05). Lower-left: weighted FC matrix; Upper-right: binary FC matrix. The numbers by the axes represent ROI ID (see Table 1). Colorbar represents Pearson’s correlation coefficient. C1–6: identified subnetworks with Euclidean-based hierarchical clustering; M1–5: identified subnetworks with modularity-based partitioning.
Fig. 11.
Fig. 11.
Matrix representations of unique (A) and consistent (B) edges at the subject-level. M1–5: identified subnetworks with modularity-based partitioning. The light background network presenting group-level significant FC matrix as reference (see Fig. 10). Numbers pointed to individual brain areas represent ROI ID to indicate the high ranked edges (1%) (see Table 1)
Fig. 12.
Fig. 12.
Matrix representations of unique (A) and consistent (B) edges intra- and inter-networks at the subject-level. M1–5: identified subnetworks with modularity-based partitioning.
Fig. 13.
Fig. 13.
Identification of hub and rich club structures. (A) Percent occurrence of centrality metrics for each hub ROI. The ROIs that ranked at a high score of more than 90% on any of the centrality metrics among the thresholds throughout 5th to 25th among 50 ROIs, were determined as hubs. (B) Weighted rich club coefficient was calculated on the identified 50 ROIs. Black and gray curves compare the rich club coefficient at various nodal strengths between empirical and an average of 1,000 simulated random networks, respectively. (C) Normalized rich club coefficient calculated by RC/RC rand. Red vertical lines indicate the significant nodal strength used to identify rich club structures (p < 1.96 × 10−110). (D) Illustration of hub and rich club structures in the Paxinos and Watson’s (7th edition) rat brain coordinates (0 mm indicate bregma location). RC: rich club coefficient.
Fig. 14.
Fig. 14.
Distribution of hub structures among three intrinsic functional networks of the rat brain. (A&B) 3D-rendered CEN, DMN, and SN. (C) Coronal sections showing the contributing regions (light color) and hub structures (solid color) of each network in the Paxinos and Watson’s (7th edition) rat brain coordinates (0 mm indicates bregma location). Numbers pointed to individual brain areas represent ROI ID to indicate hub structure (see Table 1).

References

    1. Abraham A, Pedregosa F, Eickenberg M, Gervais P, Mueller A, Kossaifi J, Gramfort A, Thirion B, Varoquaux G, 2014. Machine learning for neuroimaging with scikit-learn. Front. Neuroinform 8, 14. - PMC - PubMed
    1. Adhikari BM, Jahanshad N, Shukla D, Turner J, Grotegerd D, Dannlowski U, Kugel H, Engelen J, Dietsche B, Krug A, Kircher T, Fieremans E, Veraart J, Novikov DS, Boedhoe PSW, van der Werf YD, van den Heuvel OA, Ipser J, Uhlmann A, Stein DJ, Dickie E, Voineskos AN, Malhotra AK, Pizzagalli F, Calhoun VD, Waller L, Veer IM, Walter H, Buchanan RW, Glahn DC, Hong LE, Thompson PM, Kochunov P, 2019. A resting state fMRI analysis pipeline for pooling inference across diverse cohorts: an ENIGMA rs-fMRI protocol. Brain Imaging Behav. 13, 1453–1467. - PMC - PubMed
    1. Aedo-Jury F, Schwalm M, Hamzehpour L, Stroh A, 2020. Brain states govern the spatio-temporal dynamics of resting-state functional connectivity. Elife 9. - PMC - PubMed
    1. Albaugh DL, Salzwedel A, Van Den Berge N, Gao W, Stuber GD, Shih YY, 2016. Functional magnetic resonance imaging of electrical and optogenetic deep brain stimulation at the rat nucleus accumbens. Sci. Rep 6, 31613. - PMC - PubMed
    1. Alfaro-Almagro F, Jenkinson M, Bangerter NK, Andersson JLR, Griffanti L, Douaud G, Sotiropoulos SN, Jbabdi S, Hernandez-Fernandez M, Vallee E, Vidaurre D, Webster M, McCarthy P, Rorden C, Daducci A, Alexander DC, Zhang H, Dragonu I, Matthews PM, Miller KL, Smith SM, 2018. Image processing and Quality Control for the first 10,000 brain imaging datasets from UK Biobank. Neuroimage 166, 400–424. - PMC - PubMed

Publication types