. 2021:20:100141.
doi: 10.1016/j.mcpro.2021.100141. Epub 2021 Aug 31.

An Integrated Transcriptomics and Proteomics Analysis Implicates lncRNA MALAT1 in the Regulation of Lipid Metabolism

Affiliations

An Integrated Transcriptomics and Proteomics Analysis Implicates lncRNA MALAT1 in the Regulation of Lipid Metabolism

Hao Wang et al. Mol Cell Proteomics. 2021.

Abstract

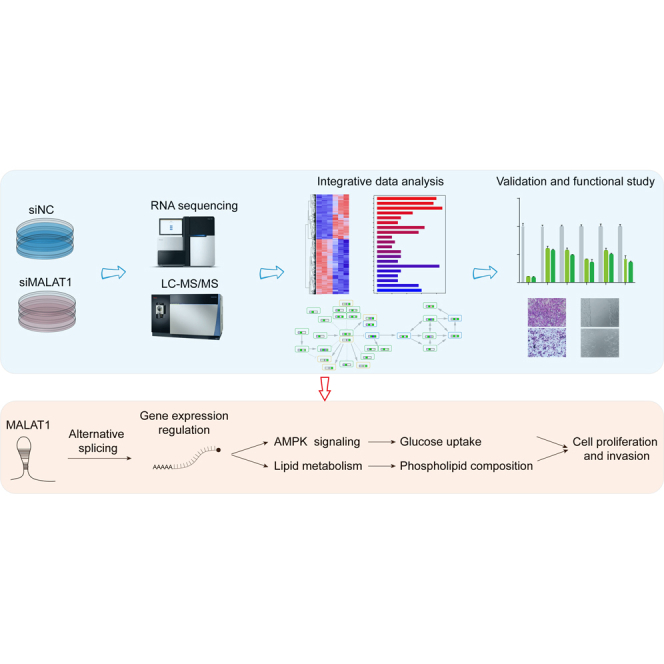
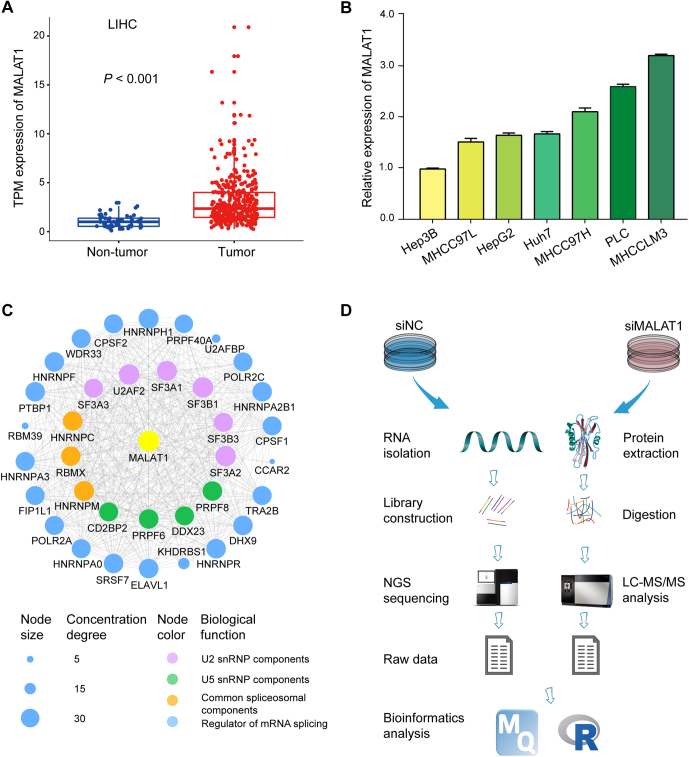
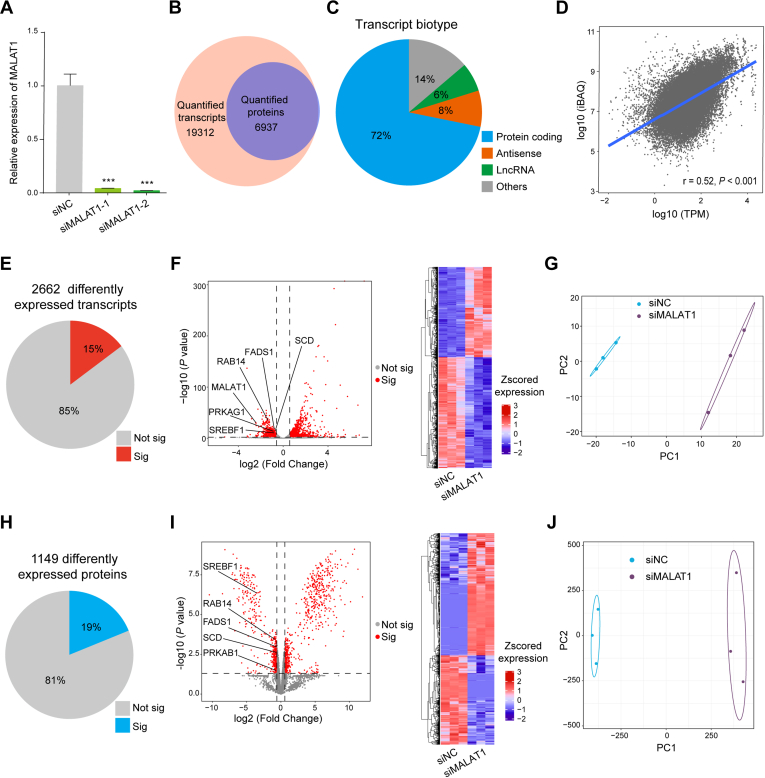
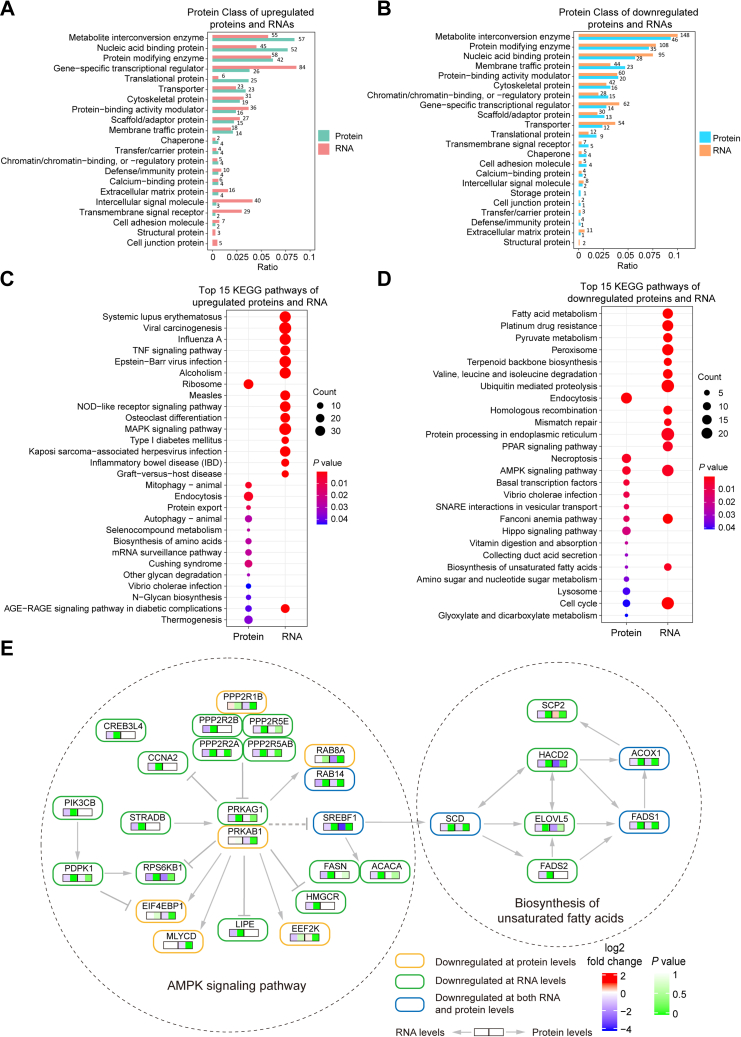
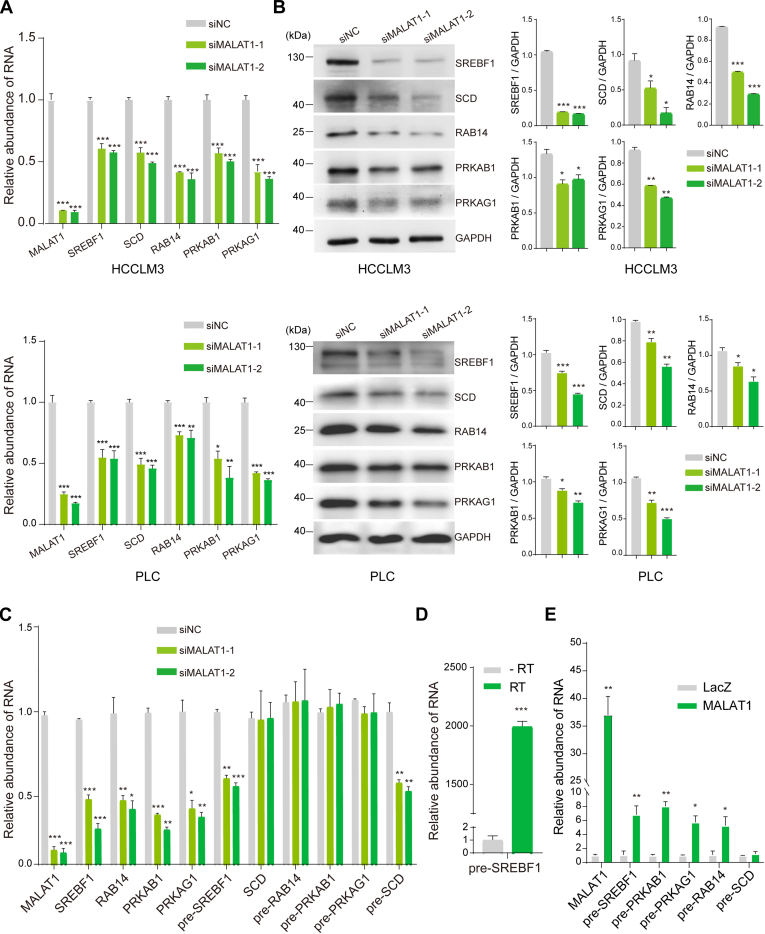
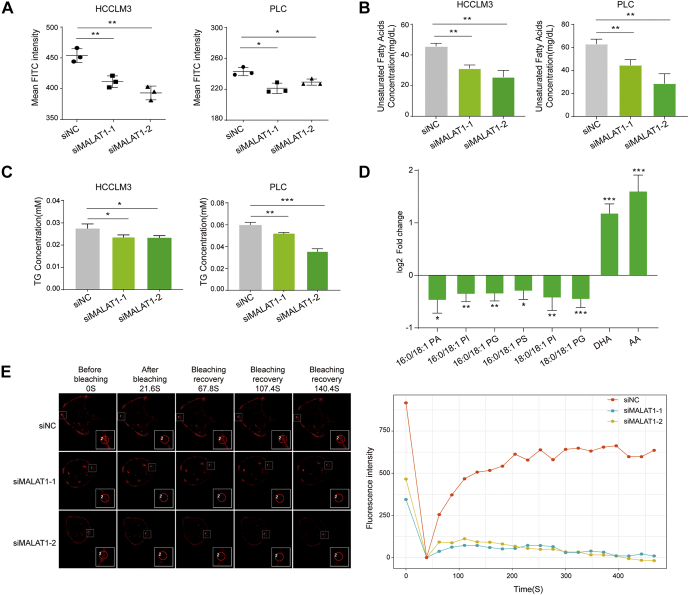
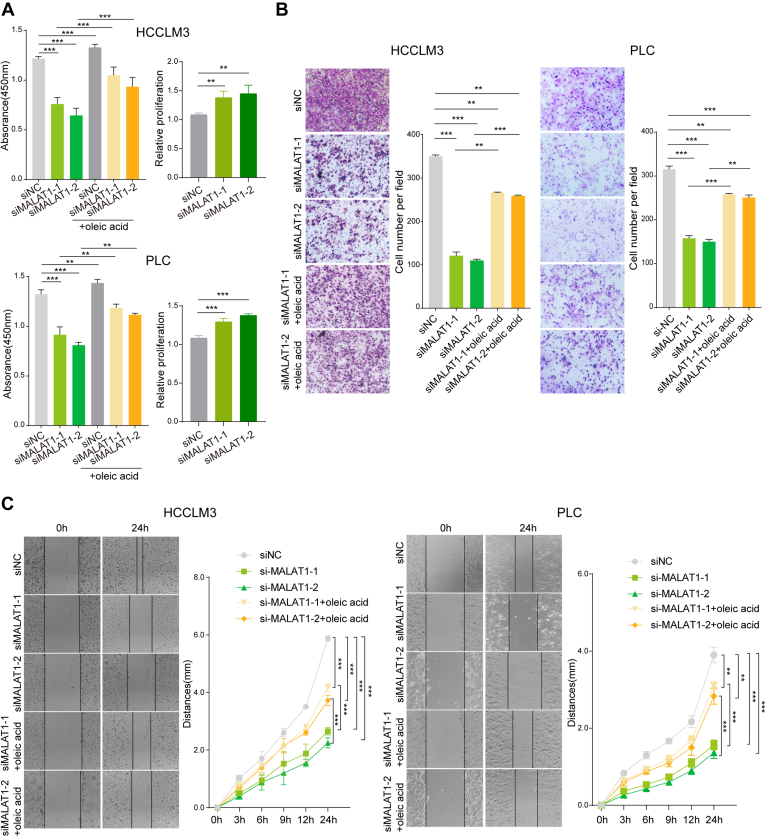
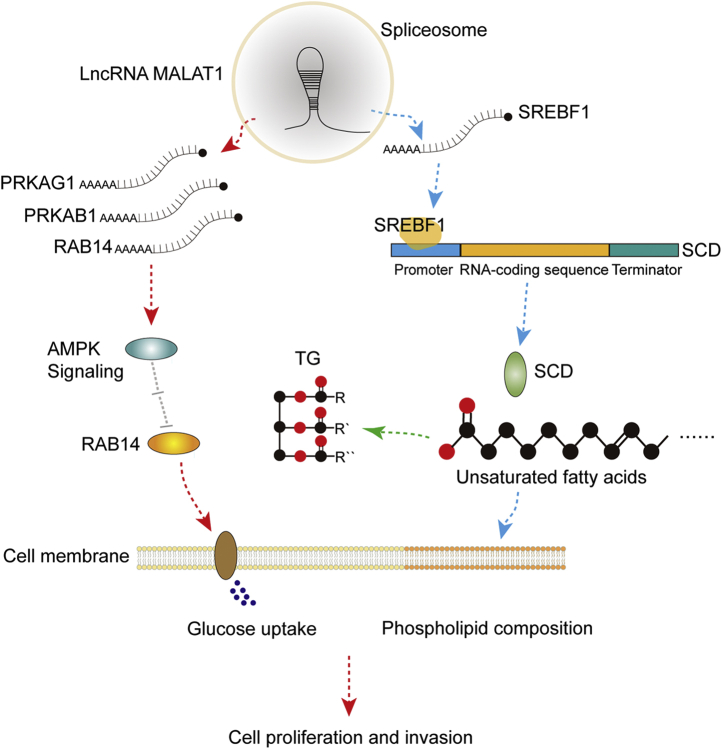
Long noncoding RNA metastasis-associated lung adenocarcinoma transcript 1 (MALAT1) is upregulated in various cancers, and its overexpression is associated with tumor growth and metastasis. MALAT1 has been recognized as a key player in the regulation of RNA splicing and transcription; however, the landscape of gene expression regulated by MALAT1 remains unclear. In this study, we employed an integrated transcriptomics and proteomics strategy to characterize the alterations in gene expression induced by MALAT1 knockdown in hepatocellular carcinoma (HCC) cells and identified 2662 differentially expressed transcripts and 1149 differentially expressed proteins. Interestingly, downregulation of MALAT1 reduced the abundances of multiple genes in the AMP-activated protein kinase (AMPK) signaling and biosynthesis of unsaturated fatty acids pathways. Further investigation showed that MALAT1 knockdown inhibited glucose uptake and lipogenesis by reducing the expression levels of these lipid metabolism related genes, which contributes to the oncogenic role of MALAT1 in tumor cell proliferation and invasion. This study uncovers the function of MALAT1 in the modulation of cancer lipid metabolism, reveals the underlying molecular mechanism, and further supports the potential therapeutic opportunities for targeting MALAT1 in HCC treatment.

Keywords: hepatocellular carcinoma; lipid metabolism; long noncoding RNA; proteomics; transcriptomics.


Conflict of interest statement

Conflict of interest The authors declare that they have no known competing financial interests or personal relationships that could have appeared to influence the work reported in this paper.

Figures

None
Graphical abstract
Fig. 1
Fig. 1
The expression of MALAT1 in HCC tumor tissues and cell lines.A, comparison of the expression of MALAT1 between tumor and nontumor samples from the TCGA-LIHC (Liver Hepatocellular Carcinoma) transcriptomics data. Transcripts Per Million (TPM) values were used for quantification. Boxplot center lines = median, lower bound = 25% quantile, upper bound = 75% quantile, lower whisker = the smallest observation greater than or equal to the lower hinge −1.5 × interquartile range (IQR), upper whisker = the largest observation less than or equal to the upper hinge +1.5 × IQR. Wilcoxon rank-sum test was used for statistical analysis. B, relative levels of MALAT1 across seven HCC cell lines. Data represent mean ± s.d. C, interacting proteome network of MALAT1 involving in RNA splicing. The network was constructed by Cytoscape (version: 3.8.0). D, the workflow of the experimental approach employed in this study.
Fig. 2
Fig. 2
MALAT1 knockdown induced perturbation of gene expression at the transcriptome and proteome level.A, the relative expression of MALAT1 in the negative control (siNC) and siMALAT1-treated HCCLM3 cells as measured by qRT-PCR. Data represent mean ± s. d. of triplicate independent experiments (∗∗∗p < 0.001, by two-sided Student’s t test). B, the overlap of genes quantified at the RNA and protein levels. C, percentages of the indicated biotypes of the quantified transcripts. D, comparison of the protein intensities as in intensity-based absolute quantification (iBAQ) values versus mRNA intensities (TPM). Pearson correlation analysis was conducted. E and H, the percentages of the differently expressed transcripts (E) and proteins (H). F and I, volcano plots and heatmaps showing the differently expressed transcripts (F) and proteins (I). G and J, principal component analysis of all quantified RNAs (G) and proteins (J).
Fig. 3
Fig. 3
Functional analysis of the differently expressed mRNAs and proteins induced by MALAT1 knockdown.A and B, protein class classification of the upregulated (A) and downregulated (B) proteins and mRNAs. Pantherdb was used for the analysis (http://www.pantherdb.org/). C and D, KEGG pathway overrepresentation analysis of the upregulated (C) and downregulated (D) proteins and mRNAs. The analysis was conducted by clusterProfiler (version: 3.16.0) R/Bioconductor package. E, differently expressed genes detected in the AMPK signaling and biosynthesis of unsaturated fatty acids pathways.
Fig. 4
Fig. 4
MALAT1 knockdown inhibited the expression of genes in the AMPK signaling and lipid metabolism pathways through pre-mRNA splicing or transcription.A, the relative RNA levels of MALAT1, SREBF1, SCD, RAB14, PRKAB1, and PRKAG1 were measured by qRT-PCR in HCCLM3 (upper panel) and PLC (lower panel) cell lines. B, the expression of the proteins of interest in HCCLM3 (upper panel) and PLC (lower panel) cells was examined by western blotting. The densities of the corresponding protein bands were measured by Image J and displayed on the right. C, relative quantification of the mRNAs and the corresponding pre-mRNAs by qRT-PCR. D, measurement of the pre-mRNA of SREBF1 by qRT-PCR with or without reverse transcriptase (RT). E, qRT-PCR analysis of the pre-mRNAs copurified with MALAT1 by biotinylated anti-MALAT1 probes. The anti-LacZ probes were used as negative control. Data represent mean ± s.d. of triplicate independent experiments (∗p < 0.05, ∗∗p < 0.01, ∗∗∗p < 0.001, by two-sided Student’s t test).
Fig. 5
Fig. 5
MALAT1 knockdown decreased lipogenesis in HCC cells.A, glucose uptake in HCCLM3 (left panel) and PLC (right panel) cells treated with siMALAT1. Data represent mean ± s.d. of triplicate independent experiments (∗p < 0.05, ∗∗p < 0.01, by two-sided Student’s t test). B, the concentration of unsaturated fatty acids extracted from HCCLM3 (left panel) and PLC (right panel) cells treated with siMALAT1s. Data represent mean ± s.d. of triplicate independent experiments (∗p < 0.05, ∗∗p < 0.01, ∗∗∗p < 0.001, by two-sided Student’s t test). C, the concentration of TG extracted from HCCLM3 (left panel) and PLC (right panel) cells treated with siMALAT1. Data represent mean ± s.d. of triplicate independent experiments (∗p < 0.05, ∗∗p < 0.01, ∗∗∗p < 0.001, by two-sided Student’s t test). D, targeted LC-MS/MS analysis of lipids with altered abundance between siNC and siMALAT1 treated HCCLM3 cells. Data represent mean ± s.d. of five biological replicates (∗p < 0.05, ∗∗p < 0.01, ∗∗∗p < 0.001, by two-sided Student’s t test). E, representative cell membrane images of HCCLM3 cells at the indicated time points after photobleaching. Fluorescence intensities of the photobleached areas at indicated time points were shown on the right.
Fig. 6
Fig. 6
The role of MALAT1 in lipid metabolism contributes to its functions in promoting cell proliferation, migration, and invasion.A, cell proliferation of HCCLM3 (upper panel) and PLC (lower panel) cells with MALAT1 knockdown cultured with or without oleic acid (10 μM). The increase of cell proliferation delivered by oleic acid supplementation (relative proliferation) was calculated by dividing the absorbance of cells treated with oleic acid supplementation with the absorbance of the corresponding untreated cells. Data represent mean ± s.d. of triplicate independent experiments (∗p < 0.05, ∗∗p < 0.01, ∗∗∗p < 0.001, by two-sided Student’s t test). B, matrigel invasion assay using HCCLM3 (left panel) and PLC (right panel) cells with MALAT1 knockdown cultured with or without oleic acid (10 μM). Representative images of the invaded cells are shown on the left in each panel. Data represent mean ± s.d. of triplicate independent experiments (∗p < 0.05, ∗∗p < 0.01, ∗∗∗p < 0.001, by two-sided Student’s t test). C, migration assay using HCCLM3 (left panel) and PLC (right panel) cells with MALAT1 knockdown cultured with or without oleic acid (10 μM). Representative images of the migrated cells are shown on the left in each panel. The plots on the right show the cell migration distances at the indicated time points. Data represent means ± s.d. of triplicate independent experiments (∗p < 0.05, ∗∗p < 0.01, ∗∗∗p < 0.001, by two-tailed student’s t test).
Fig. 7
Fig. 7
The proposed molecular mechanism by which MALAT1 promotes cell proliferation and invasion through regulating lipogenesis. MALAT1 modulates the expression of genes in the AMPK signaling and unsaturated fatty acid biosynthesis pathways, thereby elevates glucose uptake and lipogenesis. The synthesized fatty acids are converted to TG for energy storage and phospholipids for cell membrane construction, which facilitates the cell proliferation and invasion of HCC cells.

References

    1. Robey R.B., Weisz J., Kuemmerle N.B., Salzberg A.C., Berg A., Brown D.G., Kubik L., Palorini R., Al-Mulla F., Al-Temaimi R., Colacci A., Mondello C., Raju J., Woodrick J., Scovassi A.I. Metabolic reprogramming and dysregulated metabolism: Cause, consequence and/or enabler of environmental carcinogenesis? Carcinogenesis. 2015;36:S203–S231. - PMC - PubMed
    1. Ogretmen B. Sphingolipid metabolism in cancer signalling and therapy. Nat. Rev. Cancer. 2018;18:33–50. - PMC - PubMed
    1. Beloribi-Djefaflia S., Vasseur S., Guillaumond F. Lipid metabolic reprogramming in cancer cells. Oncogenesis. 2016;5 - PMC - PubMed
    1. Budhu A., Roessler S., Zhao X., Yu Z., Forgues M., Ji J., Karoly E., Qin L.X., Ye Q.H., Jia H.L., Fan J., Sun H.C., Tang Z.Y., Wang X.W. Integrated metabolite and gene expression profiles identify lipid biomarkers associated with progression of hepatocellular carcinoma and patient outcomes. Gastroenterology. 2013;144:1066–1075.e1. - PMC - PubMed
    1. Nakagawa H., Hayata Y., Kawamura S., Yamada T., Fujiwara N., Koike K. Lipid metabolic reprogramming in hepatocellular carcinoma. Cancers (Basel) 2018;10:447. - PMC - PubMed

Publication types

Substances