

Meta-analysis of single-cell RNA-seq data reveals phenotypic switching of immune cells in severe COVID-19 patients
- PMID: 34478921
- PMCID: PMC8390121
- DOI: 10.1016/j.compbiomed.2021.104792
Meta-analysis of single-cell RNA-seq data reveals phenotypic switching of immune cells in severe COVID-19 patients
Abstract
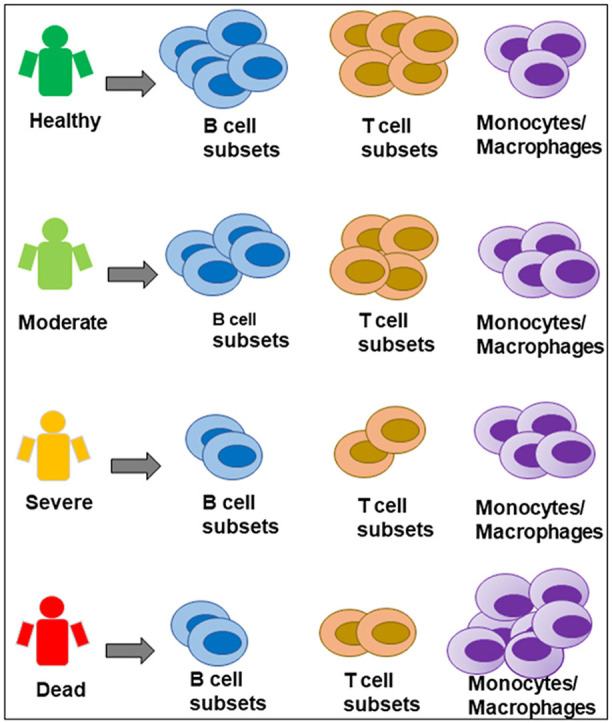
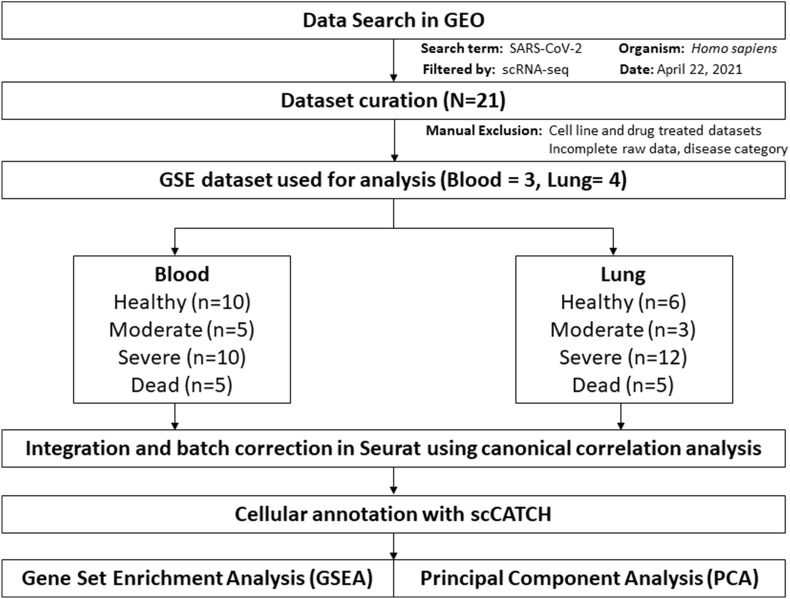
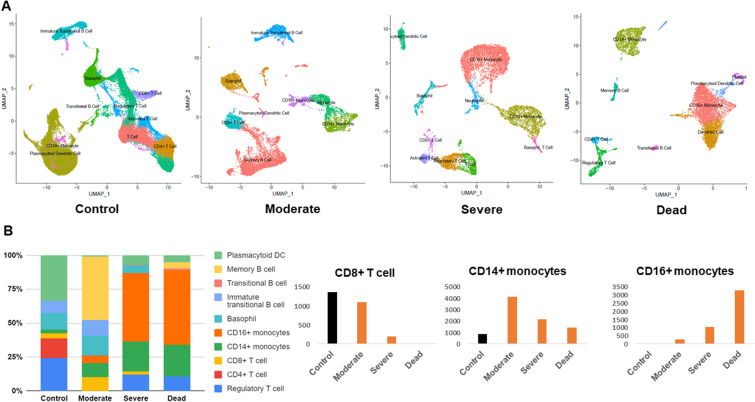
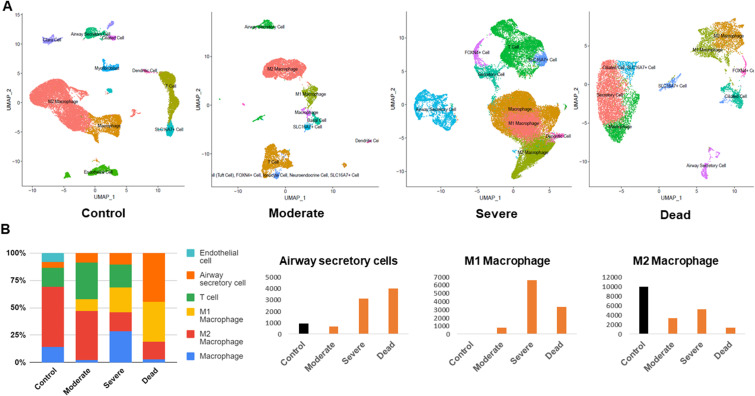
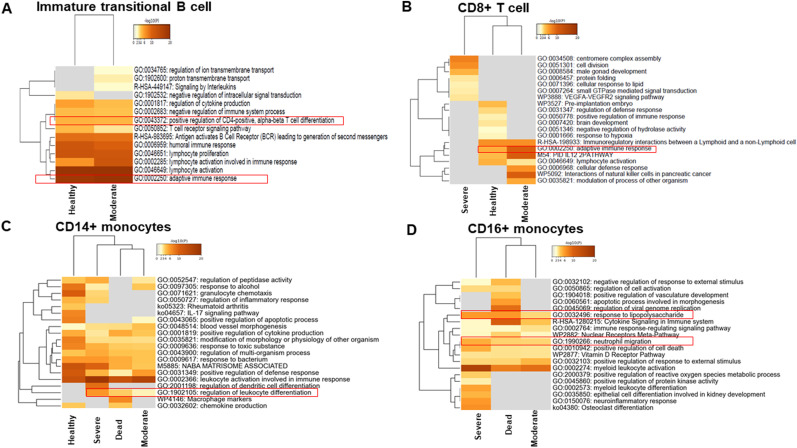
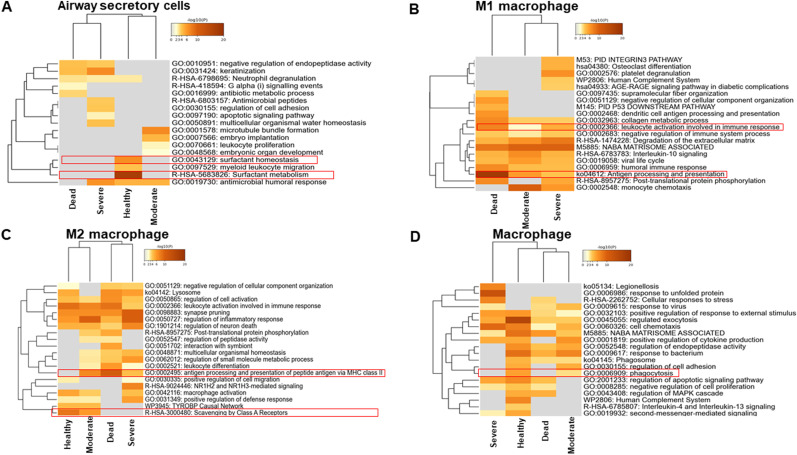
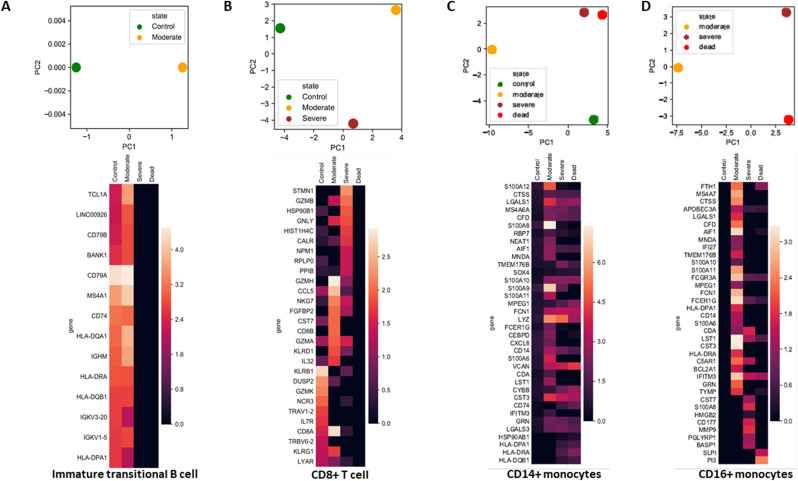
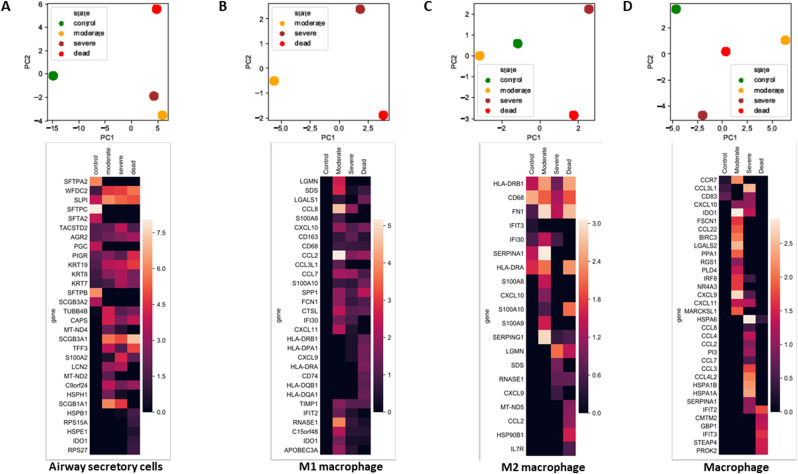
Severe acute respiratory syndrome coronavirus 2 (SARS-CoV-2) infection has resulted in the global coronavirus disease 2019 (COVID-19) pandemic. Despite several single-cell RNA sequencing (RNA-seq) studies, conclusions cannot be reached owing to the small number of available samples and the differences in technology and tissue types used in the studies. To better understand the cellular landscape and disease severity in COVID-19, we performed a meta-analysis of publicly available single-cell RNA-seq data from peripheral blood and lung samples of COVID-19 patients with varying degrees of severity. Patients with severe disease showed increased numbers of M1 macrophages in lung tissue, while the number of M2 macrophages was depleted. Cellular profiling of the peripheral blood showed a marked increase of CD14+, CD16+ monocytes and a concomitant depletion of overall B cells and CD4+, CD8+ T cells in severe patients when compared with moderate patients. Our analysis indicates the presence of faulty innate-to-adaptive switching, marked by a prolonged innate immune response and a dysregulated adaptive immune response in severe COVID-19 patients. Furthermore, we identified cell types with a transcriptome signature that can be used as a prognostic biomarker for disease state prediction and the effective therapeutic management of COVID-19 patients.
Keywords: COVID-19 patients; Immune cell landscape; Meta-analysis; Phenotypic switching; Single-cell RNA-Seq.
Copyright © 2021 The Author(s). Published by Elsevier Ltd.. All rights reserved.
Conflict of interest statement
The authors declare that no conflicts of interest exist.
Figures
Similar articles
-
Single-cell analysis reveals cell communication triggered by macrophages associated with the reduction and exhaustion of CD8+ T cells in COVID-19.Cell Commun Signal. 2021 Jul 8;19(1):73. doi: 10.1186/s12964-021-00754-7. Cell Commun Signal. 2021. PMID: 34238338 Free PMC article.
-
Integrating single-cell sequencing data with GWAS summary statistics reveals CD16+monocytes and memory CD8+T cells involved in severe COVID-19.Genome Med. 2022 Feb 17;14(1):16. doi: 10.1186/s13073-022-01021-1. Genome Med. 2022. PMID: 35172892 Free PMC article.
-
Immune Cells Profiles In The Peripheral Blood Of Patients With Moderate To Severe COVID-19 And Healthy Subjects With and Without Vaccination With The Pfizer-BioNTech mRNA Vaccine.Front Immunol. 2022 Jul 11;13:851765. doi: 10.3389/fimmu.2022.851765. eCollection 2022. Front Immunol. 2022. PMID: 35898494 Free PMC article.
-
Innate and adaptive immune response in SARS-CoV-2 infection-Current perspectives.Front Immunol. 2022 Nov 22;13:1053437. doi: 10.3389/fimmu.2022.1053437. eCollection 2022. Front Immunol. 2022. PMID: 36505489 Free PMC article. Review.
-
Natural Killer Cells in SARS-CoV-2 Infection: Pathophysiology and Therapeutic Implications.Front Immunol. 2022 Jun 30;13:888248. doi: 10.3389/fimmu.2022.888248. eCollection 2022. Front Immunol. 2022. PMID: 35844604 Free PMC article. Review.
Cited by
-
Evidence of SARS-CoV-2 infection in postmortem lung, kidney, and liver samples, revealing cellular targets involved in COVID-19 pathogenesis.Arch Virol. 2023 Feb 26;168(3):96. doi: 10.1007/s00705-023-05711-y. Arch Virol. 2023. PMID: 36842152 Free PMC article.
-
A contemporary review on the important role of in silico approaches for managing different aspects of COVID-19 crisis.Inform Med Unlocked. 2022;28:100862. doi: 10.1016/j.imu.2022.100862. Epub 2022 Jan 21. Inform Med Unlocked. 2022. PMID: 35079621 Free PMC article. Review.
-
A mid‑pandemic night's dream: Melatonin, from harbinger of anti‑inflammation to mitochondrial savior in acute and long COVID‑19 (Review).Int J Mol Med. 2024 Mar;53(3):28. doi: 10.3892/ijmm.2024.5352. Epub 2024 Feb 1. Int J Mol Med. 2024. PMID: 38299237 Free PMC article. Review.
-
Delineating COVID-19 immunological features using single-cell RNA sequencing.Innovation (Camb). 2022 Sep 13;3(5):100289. doi: 10.1016/j.xinn.2022.100289. Epub 2022 Jul 21. Innovation (Camb). 2022. PMID: 35879967 Free PMC article. Review.
-
Single-nuclei characterization of pervasive transcriptional signatures across organs in response to COVID-19.Elife. 2023 Oct 13;12:e81090. doi: 10.7554/eLife.81090. Elife. 2023. PMID: 37830426 Free PMC article.
References
-
- Wu Z., McGoogan J.M. Characteristics of and important lessons from the coronavirus disease 2019 (COVID-19) outbreak in China: summary of a report of 72314 cases from the Chinese center for disease control and prevention. J. Am. Med. Assoc. 2020 Apr 7;323(13):1239–1242. doi: 10.1001/jama.2020.2648. PMID: 32091533. - DOI - PubMed
Publication types
MeSH terms
Substances
LinkOut - more resources
Full Text Sources
Medical
Research Materials
Miscellaneous
