Improved estimates of strength and stiffness in pathologic vertebrae with bone metastases using CT-derived bone density compared with radiographic bone lesion quality classification
- PMID: 34479191
- PMCID: PMC9210826
- DOI: 10.3171/2021.2.SPINE202027
Improved estimates of strength and stiffness in pathologic vertebrae with bone metastases using CT-derived bone density compared with radiographic bone lesion quality classification
Abstract
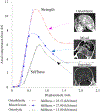
Objective: The aim of this study was to compare the ability of 1) CT-derived bone lesion quality (classification of vertebral bone metastases [BM]) and 2) computed CT-measured volumetric bone mineral density (vBMD) for evaluating the strength and stiffness of cadaver vertebrae from donors with metastatic spinal disease.
Methods: Forty-five thoracic and lumbar vertebrae were obtained from cadaver spines of 11 donors with breast, esophageal, kidney, lung, or prostate cancer. Each vertebra was imaged using microCT (21.4 μm), vBMD, and bone volume to total volume were computed, and compressive strength and stiffness experimentally measured. The microCT images were reconstructed at 1-mm voxel size to simulate axial and sagittal clinical CT images. Five expert clinicians blindly classified the images according to bone lesion quality (osteolytic, osteoblastic, mixed, or healthy). Fleiss' kappa test was used to test agreement among 5 clinical raters for classifying bone lesion quality. Kruskal-Wallis ANOVA was used to test the difference in vertebral strength and stiffness based on bone lesion quality. Multivariable regression analysis was used to test the independent contribution of bone lesion quality, computed vBMD, age, gender, and race for predicting vertebral strength and stiffness.
Results: A low interrater agreement was found for bone lesion quality (κ = 0.19). Although the osteoblastic vertebrae showed significantly higher strength than osteolytic vertebrae (p = 0.0148), the multivariable analysis showed that bone lesion quality explained 19% of the variability in vertebral strength and 13% in vertebral stiffness. The computed vBMD explained 75% of vertebral strength (p < 0.0001) and 48% of stiffness (p < 0.0001) variability. The type of BM affected vBMD-based estimates of vertebral strength, explaining 75% of strength variability in osteoblastic vertebrae (R2 = 0.75, p < 0.0001) but only 41% in vertebrae with mixed bone metastasis (R2 = 0.41, p = 0.0168), and 39% in osteolytic vertebrae (R2 = 0.39, p = 0.0381). For vertebral stiffness, vBMD was only associated with that of osteoblastic vertebrae (R2 = 0.44, p = 0.0024). Age and race inconsistently affected the model's strength and stiffness predictions.
Conclusions: Pathologic vertebral fracture occurs when the metastatic lesion degrades vertebral strength, rendering it unable to carry daily loads. This study demonstrated the limitation of qualitative clinical classification of bone lesion quality for predicting pathologic vertebral strength and stiffness. Computed CT-derived vBMD more reliably estimated vertebral strength and stiffness. Replacing the qualitative clinical classification with computed vBMD estimates may improve the prediction of vertebral fracture risk.
Keywords: bone mineral density; mechanical testing; oncology; prediction of pathologic vertebral mechanics; radiographic classification; vertebral bone metastases.
Figures


Similar articles
-
Conventional finite element models estimate the strength of metastatic human vertebrae despite alterations of the bone's tissue and structure.Bone. 2020 Dec;141:115598. doi: 10.1016/j.bone.2020.115598. Epub 2020 Aug 20. Bone. 2020. PMID: 32829037 Free PMC article.
-
Accuracy of iodine density thresholds for the separation of vertebral bone metastases from healthy-appearing trabecular bone in spectral detector computed tomography.Eur Radiol. 2019 Jun;29(6):3253-3261. doi: 10.1007/s00330-018-5843-y. Epub 2018 Dec 6. Eur Radiol. 2019. PMID: 30523450
-
Correlation of vertebral strength topography with 3-dimensional computed tomographic structure.Spine (Phila Pa 1976). 2013 Feb 15;38(4):339-49. doi: 10.1097/BRS.0b013e31826c670d. Spine (Phila Pa 1976). 2013. PMID: 22869060
-
Solitary bone plasmacytoma of spine with involvement of intervertebral disk: a case report and literature review.Skeletal Radiol. 2024 Aug;53(8):1651-1656. doi: 10.1007/s00256-024-04566-x. Epub 2024 Jan 17. Skeletal Radiol. 2024. PMID: 38231261 Review.
-
[Imaging Findings of Spinal Metastases with Differential Diagnosis: Focusing on Solitary Spinal Lesion in Older Patients].J Korean Soc Radiol. 2024 Jan;85(1):77-94. doi: 10.3348/jksr.2023.0156. Epub 2024 Jan 26. J Korean Soc Radiol. 2024. PMID: 38362381 Free PMC article. Review. Korean.
Cited by
-
Investigation of the Role of Osteoporotic Vertebra Degeneration on the Stability of the Lumbar Spine: In Silico Modelling under Compressive Loading.Bioengineering (Basel). 2024 May 17;11(5):507. doi: 10.3390/bioengineering11050507. Bioengineering (Basel). 2024. PMID: 38790372 Free PMC article.
-
Evaluation of Load-To-Strength Ratios in Metastatic Vertebrae and Comparison With Age- and Sex-Matched Healthy Individuals.Front Bioeng Biotechnol. 2022 Aug 5;10:866970. doi: 10.3389/fbioe.2022.866970. eCollection 2022. Front Bioeng Biotechnol. 2022. PMID: 35992350 Free PMC article.
-
Metastatic spine disease alters spinal load-to-strength ratios in patients compared to healthy individuals.medRxiv [Preprint]. 2025 Jan 7:2025.01.06.25320075. doi: 10.1101/2025.01.06.25320075. medRxiv. 2025. PMID: 39830276 Free PMC article. Preprint.
-
CT-based finite element simulating spatial bone damage accumulation predicts metastatic human vertebrae strength and stiffness.Front Bioeng Biotechnol. 2024 Jul 23;12:1424553. doi: 10.3389/fbioe.2024.1424553. eCollection 2024. Front Bioeng Biotechnol. 2024. PMID: 39108596 Free PMC article.
-
Finite Element Analysis of Osteoporotic and Osteoblastic Vertebrae and Its Association With the Proton Density Fat Fraction From Chemical Shift Encoding-Based Water-Fat MRI - A Preliminary Study.Front Endocrinol (Lausanne). 2022 Jul 11;13:900356. doi: 10.3389/fendo.2022.900356. eCollection 2022. Front Endocrinol (Lausanne). 2022. PMID: 35898459 Free PMC article.
References
-
- Avrahami E, Tadmor R, Dally O, et al. 1989. Early MR demonstration of spinal metastases in patients with normal radiographs and CT and radionuclide bone scans. J Comput Assist Tomogr 13:598–602. - PubMed
-
- Saip P, Tenekeci N, Aydiner A, et al. 1999. Response evaluation of bone metastases in breast cancer: value of magnetic resonance imaging. Cancer Invest 17:575–580. - PubMed
-
- Boehling NS, Grosshans DR, Allen PK, et al. 2012. Vertebral compression fracture risk after stereotactic body radiotherapy for spinal metastases. J Neurosurg Spine 16:379–386. - PubMed
-
- Fourney DR, Frangou EM, Ryken TC, et al. 2011. Spinal instability neoplastic score: an analysis of reliability and validity from the spine oncology study group. J Clin Oncol 29:3072–3077. - PubMed

