. 2021 Sep 3;14(1):216.
doi: 10.1186/s12920-021-01062-2.

RNA sequencing of blood in coronary artery disease: involvement of regulatory T cell imbalance

Affiliations

RNA sequencing of blood in coronary artery disease: involvement of regulatory T cell imbalance

Timothy A McCaffrey et al. BMC Med Genomics. .

Abstract

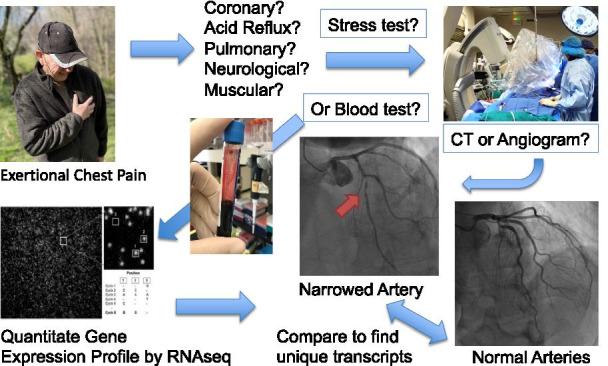
Background: Cardiovascular disease had a global prevalence of 523 million cases and 18.6 million deaths in 2019. The current standard for diagnosing coronary artery disease (CAD) is coronary angiography. Surprisingly, despite well-established clinical indications, up to 40% of the one million invasive cardiac catheterizations return a result of 'no blockage'. The present studies employed RNA sequencing of whole blood to identify an RNA signature in patients with angiographically confirmed CAD.

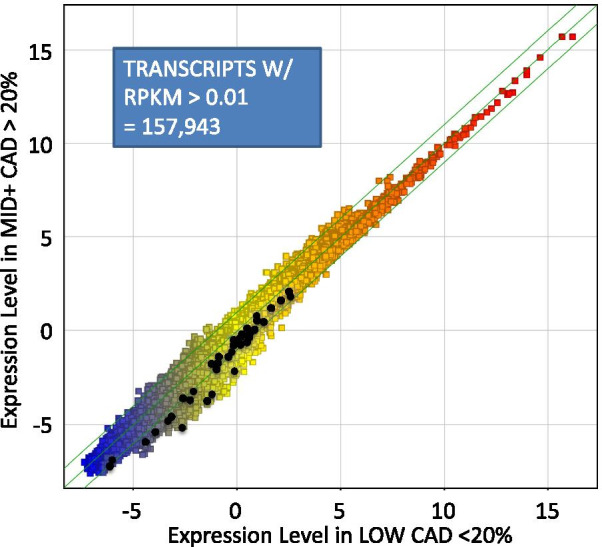
Methods: Whole blood RNA was depleted of ribosomal RNA (rRNA) and analyzed by single-molecule sequencing of RNA (RNAseq) to identify transcripts associated with CAD (TRACs) in a discovery group of 96 patients presenting for elective coronary catheterization. The resulting transcript counts were compared between groups to identify differentially expressed genes (DEGs).

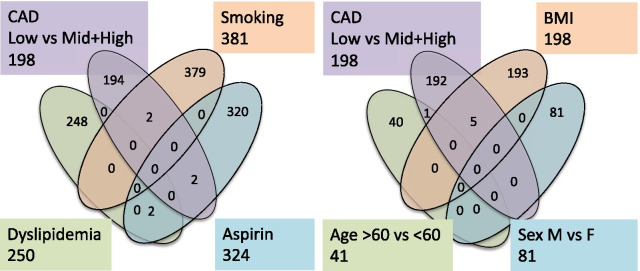
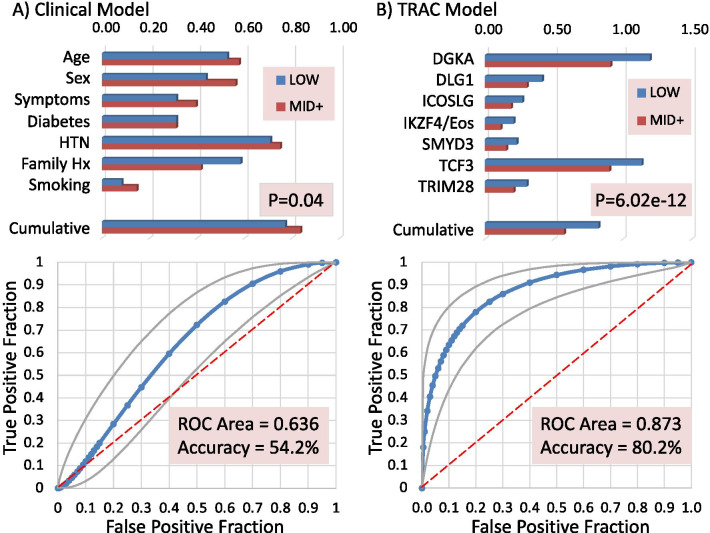
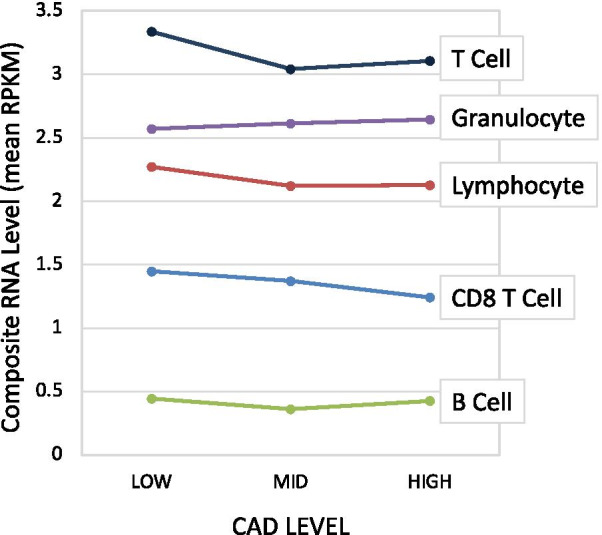
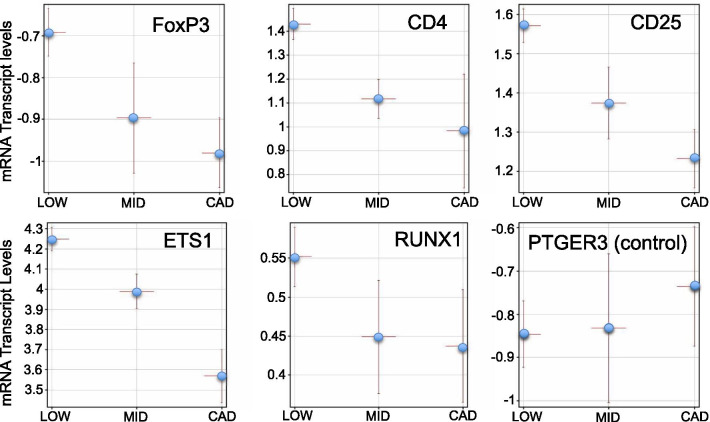
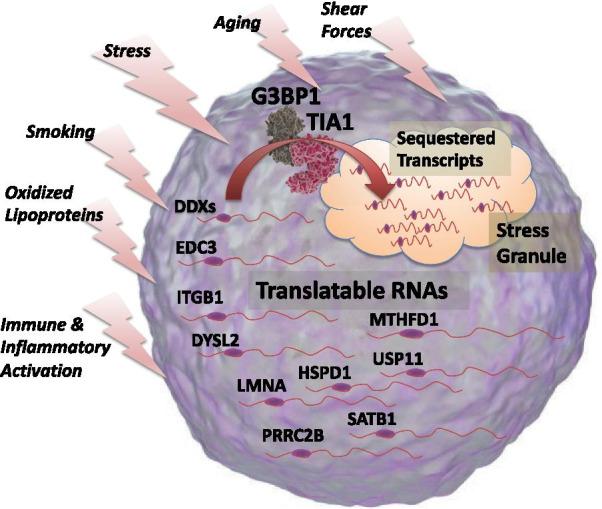
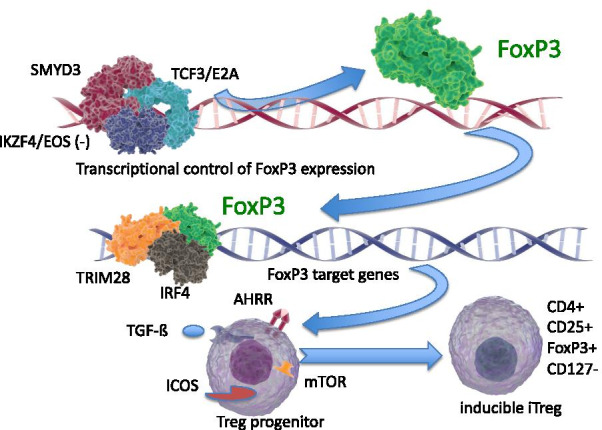
Results: Surprisingly, 98% of DEGs/TRACs were down-regulated ~ 1.7-fold in patients with mild to severe CAD (> 20% stenosis). The TRACs were independent of comorbid risk factors for CAD, such as sex, hypertension, and smoking. Bioinformatic analysis identified an enrichment in transcripts such as FoxP1, ICOSLG, IKZF4/Eos, SMYD3, TRIM28, and TCF3/E2A that are likely markers of regulatory T cells (Treg), consistent with known reductions in Tregs in CAD. A validation cohort of 80 patients confirmed the overall pattern (92% down-regulation) and supported many of the Treg-related changes. TRACs were enriched for transcripts associated with stress granules, which sequester RNAs, and ciliary and synaptic transcripts, possibly consistent with changes in the immune synapse of developing T cells.

Conclusions: These studies identify a novel mRNA signature of a Treg-like defect in CAD patients and provides a blueprint for a diagnostic test for CAD. The pattern of changes is consistent with stress-related changes in the maturation of T and Treg cells, possibly due to changes in the immune synapse.

Keywords: Atherosclerosis; Biomarker; Cilia; Coronary artery disease; FoxP1; FoxP3; Immune synapse; RNA sequencing; Regulatory T cells; Stress granules; Transcriptome; Treg.


Conflict of interest statement

TM, TJ, and IT have an equity interest in True Bearing Diagnostics, Inc., a diagnostics company developing RNA biomarkers for various diseases, including coronary artery disease. IT, GSL3, RK, and TM are seeking patent protection for a commercial diagnostic test, without restriction for research uses.

Figures

Fig. 1
Fig. 1
Schematic of study design. Patients presenting for elective invasive coronary angiography (ICA) due to suspicion of CAD were consented to determine whether RNA transcripts in blood could serve as biomarkers for CAD. Typically, patients reported chest pain or shortness of breath upon exertion. The results of the angiogram divided the patients into groups with little to no coronary blockage (< 20%, LOW CAD), or patients in which coronary blockage was detected (> 20%, MID+ CAD). The blood from the patients was frozen in Tempus blood RNA preservative, thawed, extracted for RNA, depleted of residual genomic DNA and ribosomal RNA, and genome-wide RNA transcript counting was performed by RNAseq. The two groups were compared to identify transcripts unique to the CAD patients. Images were created by the authors
Fig. 2
Fig. 2
Genome-wide transcript profiling by RNAseq. A total of 96 patients with angiographic results were analyzed by RNAseq of whole blood RNA depleted of ribosomal sequences. The short reads were aligned to the human transcriptome (hg19) and counted per transcript. The raw read counts (R) were normalized only by (Per) the length of the transcript (K) and the total number of reads obtained per patient in millions (M) to yield RPKM. The RPKM is expressed on a log2 scale and averaged across all patients in the LOW CAD group (n = 48, X axis) versus patients in the MID+ CAD group (n = 48, Y axis). Each point represents one transcript where the RPKM was > 0.01 RPKM in 70% of samples in at least one group (157,943 transcripts). Black points represent a set of transcripts identified as differentially expressed between the 2 groups by a statistical analysis of fold-change and t-test probability (p < 0.001 uncorrected, and fold change > 1.5) resulting in 59 transcripts (49 unique, non-redundant)
Fig. 3
Fig. 3
Relationship between TRACs and transcripts identified for clinical risk factors. To determine whether the TRACs (CAD, LOW vs MID+ High, 198 transcripts) were sensitive to known risk factors for CAD, the 96 patients were separated into new groups based on their current smoking (yielding 381 transcripts), aspirin use (324), dyslipidemia (250), age (41), sex (81), and BMI (198). In the case of age, sex, and BMI (right cluster), only the LOW CAD patients were analyzed (n = 48) to prevent confounding with CAD
Fig. 4
Fig. 4
Clinical versus RNA predictors of CAD. a Conventional clinical predictors of CAD plotted for each group in the upper panel, showing Age (decades/10), Sex (%Male), Symptom type (typical/atypical), Diabetes (%), Hypertension (HTN, %), Family History of CAD (%), and current Smoking (%). A cumulative CAD risk score is calculated for each patient based on the method of Min et al. and divided by 10 for graphic purposes. The relationship between the cumulative risk score and CAD was calculated by the Receiver Operator Characteristic (ROC) and a confusion matrix to identify the accuracy of the method (lower left). b The performance of 7 RNA transcripts as their gene symbols (i.e. DGKA, DLG1) expressed as the RPKM by CAD group. A cumulative score was computed expressing each transcript as a ratio to the mean of its expression in the entire group, to prevent highly expressed transcripts from being over-represented. For graphic purposes, the TRIM28 and Cumulative scores are /10. In the lower panel, the relationship between the cumulative TRAC score (constant-TRAC, to create positive ROC) and angiographically-confirmed CAD is analyzed by ROC similar to the clinical model for the 48 patients in each group
Fig. 5
Fig. 5
Expression of cell-type specific transcripts as a function of CAD status. Transcripts with relative specificity toward particular blood cell subsets was curated from published studies. The expression level (RPKM) of those transcripts (10–15 per cell type) in the RNAseq data was calculated and averaged for each cell type. The average expression was calculated for patients in 3 groups of CAD severity, LOW (n = 48), MID (n = 28), or HIGH (n = 20)
Fig. 6
Fig. 6
RNA levels of markers for Treg cells as a function of CAD level. The expression levels (log2 RPKM) of 5 known Treg markers (FoxP3, CD4, CD25, ETS1, Runx1) and 1 control (PTGER3) is plotted for 3 groups of patients with LOW (≤ 20% stenosis, n = 48), MID (21–69% stenosis, n = 28), or high CAD (≥ 70% stenosis, n = 20). Points are mean per group with bars ± s.e.m
Fig. 7
Fig. 7
Schematic representation of stress granule-regulated transcripts. Analysis of the transcripts associated with CAD (TRACs) indicated an apparent enrichment for transcripts previously known to be associated with stress granules, which are membrane-less aggregates of proteins and RNA formed when cells are exposed to a variety of stressors, listed on the left. Under stress, these TRACs, of which 10 are shown here (DDX, EDC3, etc.), translocate from active, translatable forms in the cytosolic machinery, to sequestered, inactive forms in the stress granule. Molecular images courtesy of www.somersault1824.com under a Creative Commons license
Fig. 8
Fig. 8
Schematic representation of Treg-related TRACs identified by RNAseq. The control of FoxP3 mRNA and protein expression is known to be controlled by many factors, including promoter methylation, as well as transcriptional regulation by SMYD3, TCF3/E2A, and IKZF4/Eos. FoxP3, in turn, is itself a transcriptional regulator, in association with cofactors such as TRIM28, IRF4, and others. The FoxP3-sensitive target genes, and other regulators such as AHRR, ICOS, TGF-ß, and mTOR, are then intrinsic components of the transition of Treg progenitor cells to functional Tregs. Molecular images courtesy of www.somersault1824.com under a Creative Commons license

References

    1. Benjamin EJ, Blaha MJ, Chiuve SE, Cushman M, Das SR, Deo R, de Ferranti SD, Floyd J, Fornage M, Gillespie C, et al. Heart disease and stroke statistics-2017 update: A report from the American Heart Association. Circulation. 2017;135(10):e146–e603. - PMC - PubMed
    1. Kohn MA, Kwan E, Gupta M, Tabas JA. Prevalence of acute myocardial infarction and other serious diagnoses in patients presenting to an urban emergency department with chest pain. J Emerg Med. 2005;29(4):383–390. - PubMed
    1. Klinkman MS, Stevens D, Gorenflo DW. Episodes of care for chest pain: a preliminary report from MIRNET. Michigan Research Network. J Fam Pract. 1994;38(4):345–352. - PubMed
    1. Pencina MJ, D'Agostino RB, Sr, Larson MG, Massaro JM, Vasan RS. Predicting the 30-year risk of cardiovascular disease: the framingham heart study. Circulation. 2009;119(24):3078–3084. - PMC - PubMed
    1. Patel MR, Peterson ED, Dai D, Brennan JM, Redberg RF, Anderson HV, Brindis RG, Douglas PS. Low diagnostic yield of elective coronary angiography. N Engl J Med. 2010;362(10):886–895. - PMC - PubMed