. 2021 Oct 15;81(20):5202-5216.
doi: 10.1158/0008-5472.CAN-21-2734. Epub 2021 Sep 3.

Oncogenic HSP90 Facilitates Metabolic Alterations in Aggressive B-cell Lymphomas

Affiliations

Oncogenic HSP90 Facilitates Metabolic Alterations in Aggressive B-cell Lymphomas

M Nieves Calvo-Vidal et al. Cancer Res. .

Abstract

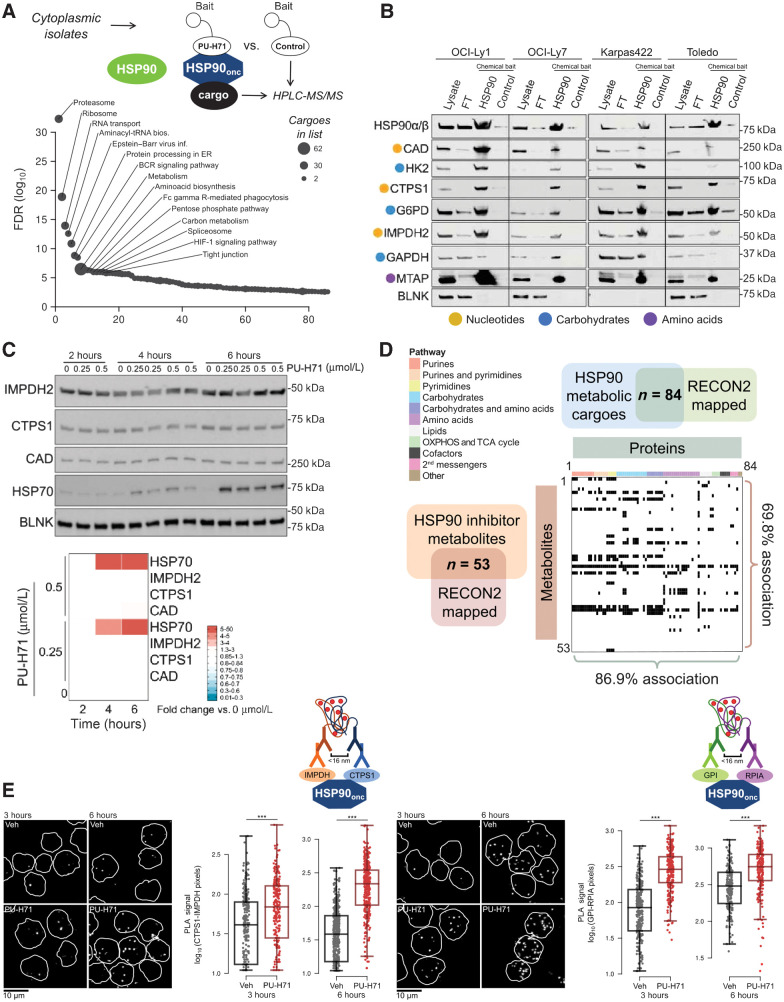
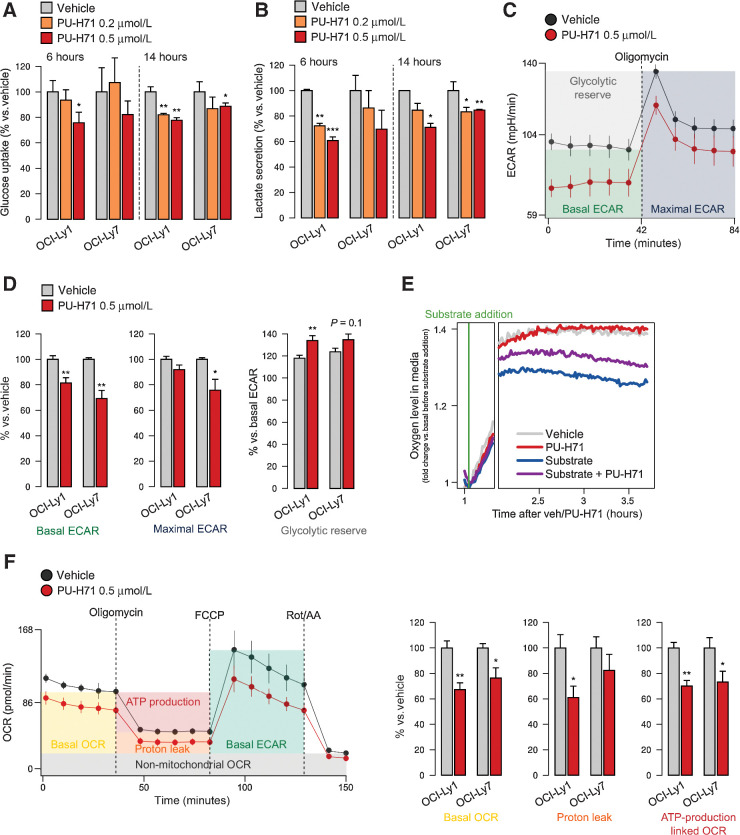
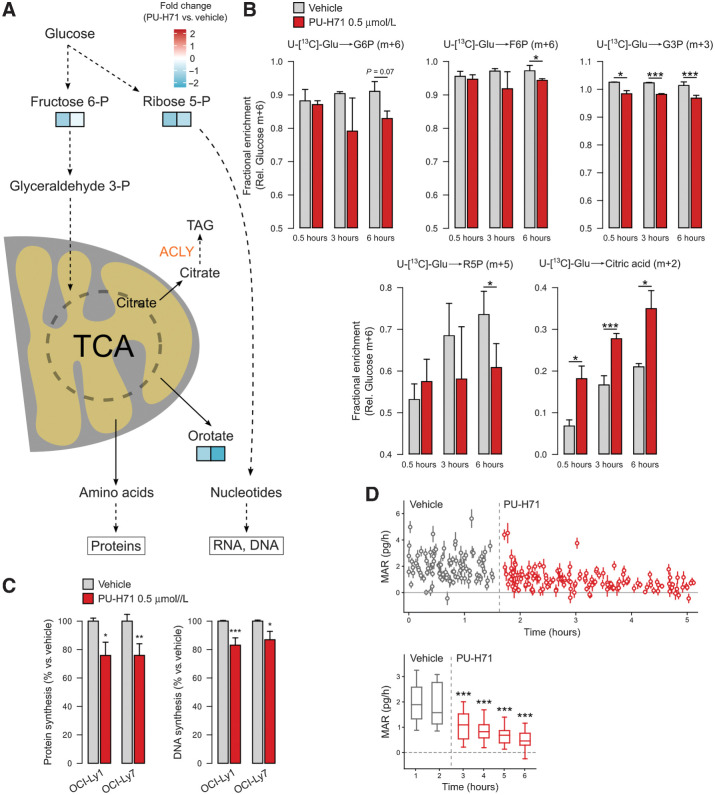
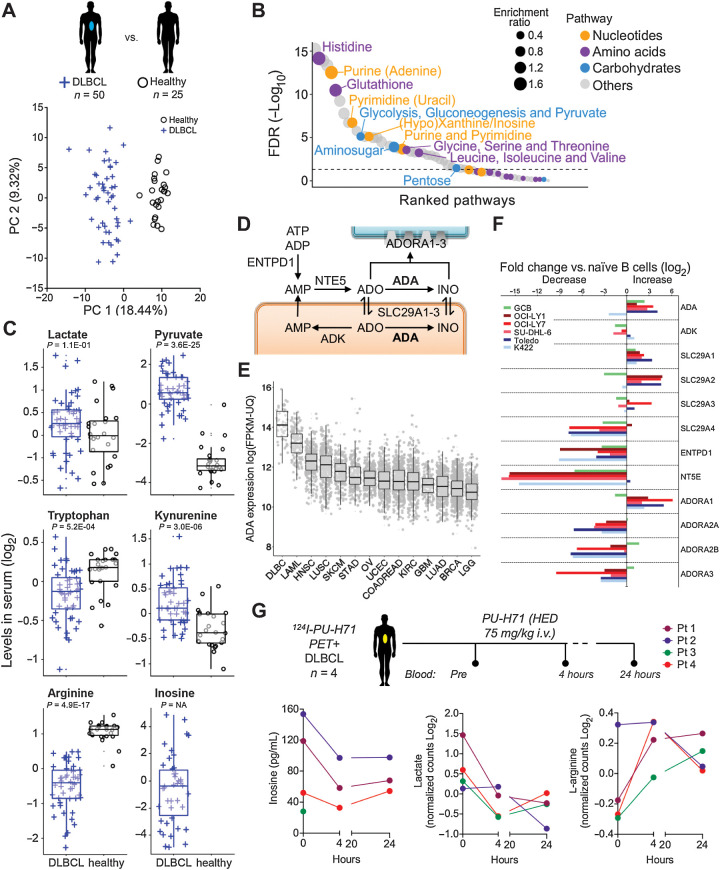
HSP90 is critical for maintenance of the cellular proteostasis. In cancer cells, HSP90 also becomes a nucleating site for the stabilization of multiprotein complexes including signaling pathways and transcription complexes. Here we described the role of this HSP90 form, referred to as oncogenic HSP90, in the regulation of cytosolic metabolic pathways in proliferating B-cell lymphoma cells. Oncogenic HSP90 assisted in the organization of metabolic enzymes into non-membrane-bound functional compartments. Under experimental conditions that conserved cellular proteostasis, oncogenic HSP90 coordinated and sustained multiple metabolic pathways required for energy production and maintenance of cellular biomass as well as for secretion of extracellular metabolites. Conversely, inhibition of oncogenic HSP90, in absence of apparent client protein degradation, decreased the efficiency of MYC-driven metabolic reprogramming. This study reveals that oncogenic HSP90 supports metabolism in B-cell lymphoma cells and patients with diffuse large B-cell lymphoma, providing a novel mechanism of activity for HSP90 inhibitors. SIGNIFICANCE: The oncogenic form of HSP90 organizes and maintains functional multienzymatic metabolic hubs in cancer cells, suggesting the potential of repurposing oncogenic HSP90 selective inhibitors to disrupt metabolism in lymphoma cells.


Figures

Figure 1. Functional association of the oncogenic HSP90 metabolic interactome and the metabolome in DLBCL. A, Pathways enriched in the oncogenic HSP90 (HSP90onc) interactome from the cytoplasmic fraction of OCI-Ly1 and OCI-Ly7 DLBCL cells. Proteins were identified by HPLC-MS/MS. Pathway enrichment as number of cargoes is indicated by dot size and their relative significance by the adjusted P value as FDR. B, Validation of representative enzymes from the oncogenic HSP90 interactome belonging to the three enriched metabolic pathways (indicated by colored dots) in the DLBCL cell lines OCI-Ly1, OCI-Ly7, Karpas 422, and Toledo. The lanes represent original cytosolic lysates, proteins remaining after oncogenic HSP90 chemical affinity purification (flow-through, FT), oncogenic HSP90 chemical affinity purification (HSP90), and inert chemical affinity purification (control). HSP90 was used as positive control and BLNK was used as non-HSP90-cargo negative control. C, Time course of the abundance of oncogenic HSP90 metabolic interactome components IMPDH2, CTPS1, and CAD upon oncogenic HSP90 inhibition with increasing concentrations of PU-H71 (0.25 and 0.5 μmol/L) or vehicle (0) in OCI-Ly1 cells. HSP70 was used as molecular readout of effective HSP90 inhibition and BLNK as a non-HSP90-cargo negative control. Densitometry of blots are shown at the bottom as color-coded fold changes over vehicle control. D, Association of the oncogenic HSP90 metabolic interactome mapped to RECON (n = 84) with the differentially expressed metabolites upon PU-H71 treatment mapped to RECON (n = 53). Proteins are ordered and color-coded by pathways. Matched protein-metabolite pairs are shown as black rectangles in the association plot. E, Representative images of IMPDH2-CTPS1 and GPI-RPIA endogenous complexes in OCI-Ly1 DLBCL cells exposed to vehicle (Veh) or PU-H71 for 3 and 6 hours. Bar, 10 μm. Quantifications of the PLA signal are shown next to images, with each dot belonging to a single-cell measurement. P values were calculated by t test. ***, P < 0.001.
Figure 1.
Functional association of the oncogenic HSP90 metabolic interactome and the metabolome in DLBCL. A, Pathways enriched in the oncogenic HSP90 (HSP90onc) interactome from the cytoplasmic fraction of OCI-Ly1 and OCI-Ly7 DLBCL cells. Proteins were identified by HPLC-MS/MS. Pathway enrichment as number of cargoes is indicated by dot size and their relative significance by the adjusted P value as FDR. B, Validation of representative enzymes from the oncogenic HSP90 interactome belonging to the three enriched metabolic pathways (indicated by colored dots) in the DLBCL cell lines OCI-Ly1, OCI-Ly7, Karpas 422, and Toledo. The lanes represent original cytosolic lysates, proteins remaining after oncogenic HSP90 chemical affinity purification (flow-through, FT), oncogenic HSP90 chemical affinity purification (HSP90), and inert chemical affinity purification (control). HSP90 was used as positive control and BLNK was used as non-HSP90-cargo negative control. C, Time course of the abundance of oncogenic HSP90 metabolic interactome components IMPDH2, CTPS1, and CAD upon oncogenic HSP90 inhibition with increasing concentrations of PU-H71 (0.25 and 0.5 μmol/L) or vehicle (0) in OCI-Ly1 cells. HSP70 was used as molecular readout of effective HSP90 inhibition and BLNK as a non-HSP90-cargo negative control. Densitometry of blots are shown at the bottom as color-coded fold changes over vehicle control. D, Association of the oncogenic HSP90 metabolic interactome mapped to RECON (n = 84) with the differentially expressed metabolites upon PU-H71 treatment mapped to RECON (n = 53). Proteins are ordered and color-coded by pathways. Matched protein-metabolite pairs are shown as black rectangles in the association plot. E, Representative images of IMPDH2-CTPS1 and GPI-RPIA endogenous complexes in OCI-Ly1 DLBCL cells exposed to vehicle (Veh) or PU-H71 for 3 and 6 hours. Bar, 10 μm. Quantifications of the PLA signal are shown next to images, with each dot belonging to a single-cell measurement. P values were calculated by t test. ***, P < 0.001.
Figure 2. Oncogenic HSP90 inhibition decreases nutrient utilization. A and B, Glucose uptake (A) and lactate excretion (B) in OCI-Ly1 and OCI-Ly7 cells treated with vehicle, PU-H71 (0.2 μmol/L), and PU-H71 (0.5 μmol/L) for 6 and 14 hours. Data are normalized to vehicle-treated cells. C, ECAR of OCI-Ly1 cells treated with vehicle or PU-H71 at baseline and upon oligomycin treatment to estimate the maximal ECAR. Error bars, SD of 10 replicate wells. Representative experiment of triplicates is shown. D, Mean basal ECAR, maximal ECAR, and glycolytic reserve capacity in OCI-Ly1 and OCI-Ly7 cells treated with vehicle or PU-H71, normalized to vehicle. E, Mitochondrial respiration as determined by real-time measurement of oxygen levels in the tissue culture medium of OCI-Ly1 cells in absence of glutamine (substrate) with vehicle or PU-H71, and presence of glutamine with vehicle or PU-H71. Representative experiment of triplicates is shown. F, OCR of OCI-Ly1 cells treated with vehicle or PU-H71 at baseline upon oligomycin treatment to determine proton leak and OCR-linked ATP production, upon FCCP to estimate maximal OCR, and upon rotenone/antimycin-A (Rot/AA) to estimate non-mitochondrial OCR. Right, mean basal OCR, proton leak, and ATP production linked to OCR in OCI-Ly1 and OCI-Ly7 cells treated with vehicle or PU-H71. In all panels, unless stated differently, error bars are SEM of three independent experiments. P values were calculated by t test. n.s., not significant; *, P < 0.05; **, P < 0.01.
Figure 2.
Oncogenic HSP90 inhibition decreases nutrient utilization. A and B, Glucose uptake (A) and lactate excretion (B) in OCI-Ly1 and OCI-Ly7 cells treated with vehicle, PU-H71 (0.2 μmol/L), and PU-H71 (0.5 μmol/L) for 6 and 14 hours. Data are normalized to vehicle-treated cells. C, ECAR of OCI-Ly1 cells treated with vehicle or PU-H71 at baseline and upon oligomycin treatment to estimate the maximal ECAR. Error bars, SD of 10 replicate wells. Representative experiment of triplicates is shown. D, Mean basal ECAR, maximal ECAR, and glycolytic reserve capacity in OCI-Ly1 and OCI-Ly7 cells treated with vehicle or PU-H71, normalized to vehicle. E, Mitochondrial respiration as determined by real-time measurement of oxygen levels in the tissue culture medium of OCI-Ly1 cells in absence of glutamine (substrate) with vehicle or PU-H71, and presence of glutamine with vehicle or PU-H71. Representative experiment of triplicates is shown. F, OCR of OCI-Ly1 cells treated with vehicle or PU-H71 at baseline upon oligomycin treatment to determine proton leak and OCR-linked ATP production, upon FCCP to estimate maximal OCR, and upon rotenone/antimycin-A (Rot/AA) to estimate non-mitochondrial OCR. Right, mean basal OCR, proton leak, and ATP production linked to OCR in OCI-Ly1 and OCI-Ly7 cells treated with vehicle or PU-H71. In all panels, unless stated differently, error bars are SEM of three independent experiments. P values were calculated by t test. n.s., not significant; *, P < 0.05; **, P < 0.01.
Figure 3. Oncogenic HSP90 inhibition decreases the synthesis of DNA, proteins, and biomass gain. A, Cartoon showing changes in selected metabolites from anabolic mitochondrial and pentose phosphate pathways and their metabolic fate in OCI-Ly1 and OCI-Ly7 cells. B, Glucose carbon tracing in OCI-Ly1 cells treated with vehicle or the oncogenic HSP90 inhibitor PU-H71 for 30 minutes, 3 hours, and 6 hours. The primary glucose-derived isotope for each metabolite is shown as relative to glucose m+6. The metabolite is indicated on top as glucose 6-phosphate (G6P), fructose 6-phosphate (F6P), glyceraldehyde 3-phosphate (G3P), ribose 5-phosphate (R5P), and citrate. C, Left, detection of newly synthesized protein by the incorporation rate of the amino acid analogue L-homoproparglyglycine in OCI-Ly1 and OCI-Ly7 cells treated with vehicle or PU-H71 0.5 μmol/L for 6 hours. Right, detection of newly synthesized DNA by the incorporation rate of thymidine analogue 5-ethynyl-2′-deoxyuridine in OCI-Ly1 and OCI-Ly7 cells treated with vehicle or PU-H71 0.5 μmol/L for 6 hours. In all panels, error bars are SEM of three independent experiments. D, Real-time assessment at single-cell resolution of cellular MAR in OCI-Ly1 cells treated with vehicle and upon administration of PU-H71 to the same culture. Bottom, mean MAR comparing binned datasets. P values were calculated by t test. *, P < 0.05; **, P < 0.01; ***, P < 0.001.
Figure 3.
Oncogenic HSP90 inhibition decreases the synthesis of DNA, proteins, and biomass gain. A, Cartoon showing changes in selected metabolites from anabolic mitochondrial and pentose phosphate pathways and their metabolic fate in OCI-Ly1 and OCI-Ly7 cells. B, Glucose carbon tracing in OCI-Ly1 cells treated with vehicle or the oncogenic HSP90 inhibitor PU-H71 for 30 minutes, 3 hours, and 6 hours. The primary glucose-derived isotope for each metabolite is shown as relative to glucose m+6. The metabolite is indicated on top as glucose 6-phosphate (G6P), fructose 6-phosphate (F6P), glyceraldehyde 3-phosphate (G3P), ribose 5-phosphate (R5P), and citrate. C, Left, detection of newly synthesized protein by the incorporation rate of the amino acid analogue L-homoproparglyglycine in OCI-Ly1 and OCI-Ly7 cells treated with vehicle or PU-H71 0.5 μmol/L for 6 hours. Right, detection of newly synthesized DNA by the incorporation rate of thymidine analogue 5-ethynyl-2′-deoxyuridine in OCI-Ly1 and OCI-Ly7 cells treated with vehicle or PU-H71 0.5 μmol/L for 6 hours. In all panels, error bars are SEM of three independent experiments. D, Real-time assessment at single-cell resolution of cellular MAR in OCI-Ly1 cells treated with vehicle and upon administration of PU-H71 to the same culture. Bottom, mean MAR comparing binned datasets. P values were calculated by t test. *, P < 0.05; **, P < 0.01; ***, P < 0.001.
Figure 4. The serum metabolomics of patients with DLBCL reflects a macro- and microenvironment characterized by the presence of purines. A, Principal component analysis of serum exometabolomics of patients with DLBCL (n = 50, blue cross) and age- and gender-matched healthy individuals (n = 25, black circles). B, Metabolic pathways significantly different between patients with DLBLC and healthy individuals. The relative size of the circles indicates enrichment ratio versus healthy. The color coding indicates super-pathway categorization into “amino acids,” “carbohydrates,” “nucleotides,” and “others.” C, Boxplots of immune-related metabolites from the serum exometabolomics analysis from A. Levels are shown normalized as log2. Adjusted P values for the comparison are shown below each metabolite. Inosine was not detected in healthy individuals. D, Inosine pathway indicating metabolites and intra- and extracellular enzymes. E, Expression of ADA in DLBCL versus other tumors included in the TCGA cohort. F, Expression of enzymes and solute transporters involved in the metabolism of inosine in OCI-Ly1, OCI-Ly7, SU-DHL-6, Karpas422, and Toledo DLBCL cell lines and normal GCB normalized to levels in naïve B-cells. Representative experiment shown. G, Levels of inosine, lactate, and arginine in four patients with DLBCL expressing the oncogenic form of HSP90 (as determined by 124I-PU-H71 PET-CT), before and 4 and 24 hours after the administration of one dose of PU-H71 at human-equivalent dose of 75 mg/kg in mice.
Figure 4.
The serum metabolomics of patients with DLBCL reflects a macro- and microenvironment characterized by the presence of purines. A, Principal component analysis of serum exometabolomics of patients with DLBCL (n = 50, blue cross) and age- and gender-matched healthy individuals (n = 25, black circles). B, Metabolic pathways significantly different between patients with DLBLC and healthy individuals. The relative size of the circles indicates enrichment ratio versus healthy. The color coding indicates super-pathway categorization into “amino acids,” “carbohydrates,” “nucleotides,” and “others.” C, Boxplots of immune-related metabolites from the serum exometabolomics analysis from A. Levels are shown normalized as log2. Adjusted P values for the comparison are shown below each metabolite. Inosine was not detected in healthy individuals. D, Inosine pathway indicating metabolites and intra- and extracellular enzymes. E, Expression of ADA in DLBCL versus other tumors included in the TCGA cohort. F, Expression of enzymes and solute transporters involved in the metabolism of inosine in OCI-Ly1, OCI-Ly7, SU-DHL-6, Karpas422, and Toledo DLBCL cell lines and normal GCB normalized to levels in naïve B-cells. Representative experiment shown. G, Levels of inosine, lactate, and arginine in four patients with DLBCL expressing the oncogenic form of HSP90 (as determined by 124I-PU-H71 PET-CT), before and 4 and 24 hours after the administration of one dose of PU-H71 at human-equivalent dose of 75 mg/kg in mice.
Figure 5. The oncogenic HSP90 metabolic interactome supports the MYC metabolic program in DLBCL. A, Ranking of transcription factors regulating the oncogenic HSP90 metabolic interactome in DLBCL according to the presence of canonical binding sites on their promoter regions. Statistical significance was established by FDR. B, Oncogenic HSP90 metabolic interactome components presenting MYC binding sites in promoters compared with the universe of metabolic genes from the KEGG database containing MYC binding sites. Statistical enrichment was established by Fisher exact test. C, Spearman rank correlation (ρ) plots comparing the expression of MYC versus the expression of genes from the oncogenic HSP90 metabolic interactome. Correlations were conducted in two independent DLBCL patients’ cohorts composed of 48 TCGA cases (y-axis) and 75 WCM cases (x-axis). Canonical MYC target genes are depicted with triangles. Genes from the nucleotide's pathway are shown in yellow. Darker shading indicates significant (P < 0.05) correlations found in both cohorts. D, Whole tissue levels of inosine 5′-monophosphate (by HPLC-MS) in 54 DLBCL biopsies classified as high (n = 27) vs. low (n = 27) expression of the MYC metabolic program supported by oncogenic HSP90 determined by gene expression (RNA sequencing) correlation as in C.
Figure 5.
The oncogenic HSP90 metabolic interactome supports the MYC metabolic program in DLBCL. A, Ranking of transcription factors regulating the oncogenic HSP90 metabolic interactome in DLBCL according to the presence of canonical binding sites on their promoter regions. Statistical significance was established by FDR. B, Oncogenic HSP90 metabolic interactome components presenting MYC binding sites in promoters compared with the universe of metabolic genes from the KEGG database containing MYC binding sites. Statistical enrichment was established by Fisher exact test. C, Spearman rank correlation (ρ) plots comparing the expression of MYC versus the expression of genes from the oncogenic HSP90 metabolic interactome. Correlations were conducted in two independent DLBCL patients’ cohorts composed of 48 TCGA cases (y-axis) and 75 WCM cases (x-axis). Canonical MYC target genes are depicted with triangles. Genes from the nucleotide's pathway are shown in yellow. Darker shading indicates significant (P < 0.05) correlations found in both cohorts. D, Whole tissue levels of inosine 5′-monophosphate (by HPLC-MS) in 54 DLBCL biopsies classified as high (n = 27) vs. low (n = 27) expression of the MYC metabolic program supported by oncogenic HSP90 determined by gene expression (RNA sequencing) correlation as in C.
Figure 6. MYC activation in lymphoma cells induces the oncogenic HSP90 conformation to sustain metabolic complexes. A, Transcript expression heatmap of MYC, HSP90 (HSP90AB1), and HSP90 metabolic interactome components in MYC-dependent BLs and MYC-independent PMBLs. Canonical MYC target genes are marked with black rectangles and genes from the nucleotide's pathway with yellow rectangles. B, Majority of oncogenic HSP90 metabolic interactome components IMPDH2, CTPS1, and CAD are bound to oncogenic HSP90 in a BL patient sample presenting MYC translocation. HSP90 was used as positive control and CLPP as negative control. Chemically inert beads were used as control beads. C, Abundance of the oncogenic HSP90 conformation (higher-order interaction of HSP90 and HSP70 through HOP) in P493–6 BL cells according to MYC induction. Total protein abundance in cells (lysate) and the fraction corresponding to the oncogenic HSP90 conformation purified with PU-H71-beads in P493–6 cells in low MYC and upon its induction by doxycycline (Dc) withdrawal (6 hours). The quantification at the bottom indicates the abundance of the HSP70- and HOP-containing epichaperome complexes (denoted by a green square) normalized to the MYC-low (Dc+) state. D, Representative imaging of IMPDH2-CTPS1 (top) and GPI-RPIA (bottom) endogenous complexes in P493–6 BL cells in lower MYC (0 hours, Dc+) and higher MYC conditions (1, 3, and 6 hours after Dc withdrawal). Bar, 10 μm. Quantification of the IMPDH2-CTPS1 and GPI-RPIA endogenous complexes in P493–6 BL cells in the conditions described. n.s., not significant; ***, P < 0.001.
Figure 6.
MYC activation in lymphoma cells induces the oncogenic HSP90 conformation to sustain metabolic complexes. A, Transcript expression heatmap of MYC, HSP90 (HSP90AB1), and HSP90 metabolic interactome components in MYC-dependent BLs and MYC-independent PMBLs. Canonical MYC target genes are marked with black rectangles and genes from the nucleotide's pathway with yellow rectangles. B, Majority of oncogenic HSP90 metabolic interactome components IMPDH2, CTPS1, and CAD are bound to oncogenic HSP90 in a BL patient sample presenting MYC translocation. HSP90 was used as positive control and CLPP as negative control. Chemically inert beads were used as control beads. C, Abundance of the oncogenic HSP90 conformation (higher-order interaction of HSP90 and HSP70 through HOP) in P493–6 BL cells according to MYC induction. Total protein abundance in cells (lysate) and the fraction corresponding to the oncogenic HSP90 conformation purified with PU-H71-beads in P493–6 cells in low MYC and upon its induction by doxycycline (Dc) withdrawal (6 hours). The quantification at the bottom indicates the abundance of the HSP70- and HOP-containing epichaperome complexes (denoted by a green square) normalized to the MYC-low (Dc+) state. D, Representative imaging of IMPDH2-CTPS1 (top) and GPI-RPIA (bottom) endogenous complexes in P493–6 BL cells in lower MYC (0 hours, Dc+) and higher MYC conditions (1, 3, and 6 hours after Dc withdrawal). Bar, 10 μm. Quantification of the IMPDH2-CTPS1 and GPI-RPIA endogenous complexes in P493–6 BL cells in the conditions described. n.s., not significant; ***, P < 0.001.

References

    1. Calvo-Vidal MN, Cerchietti L. The metabolism of lymphomas. Curr Opin Hematol 2013;20:345–54. - PubMed
    1. Caro P, Kishan AU, Norberg E, Stanley IA, Chapuy B, Ficarro SB, et al. . Metabolic signatures uncover distinct targets in molecular subsets of diffuse large B cell lymphoma. Cancer Cell 2012;22:547–60. - PMC - PubMed
    1. Vajpayee N, Thakral C, Gopaluni S, Newman N, Gajra A. Activation of mammalian target of rapamycin in diffuse large B-cell lymphoma: a clinicopathological study. Leuk Res 2012;36:1403–9. - PubMed
    1. Dang CV, Lewis BC. Role of oncogenic transcription factor c-Myc in cell cycle regulation, apoptosis and metabolism. J Biomed Sci 1997;4:269–78. - PubMed
    1. Sander S, Calado DP, Srinivasan L, Kochert K, Zhang B, Rosolowski M, et al. . Synergy between PI3K signaling and MYC in Burkitt lymphomagenesis. Cancer Cell 2012;22:167–79. - PMC - PubMed

Publication types

MeSH terms

Substances