. 2021 Sep 21;118(38):e2101071118.
doi: 10.1073/pnas.2101071118.

Coronavirus induces diabetic macrophage-mediated inflammation via SETDB2

Affiliations

Coronavirus induces diabetic macrophage-mediated inflammation via SETDB2

William J Melvin et al. Proc Natl Acad Sci U S A. .

Abstract

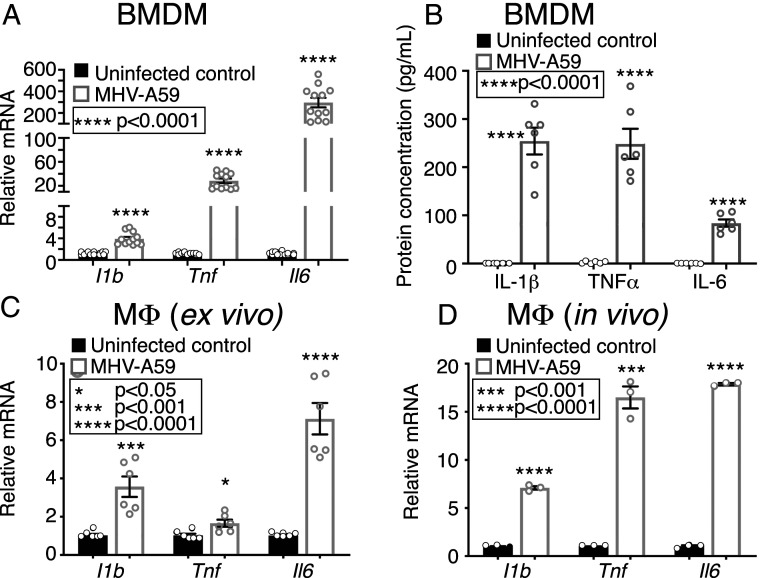
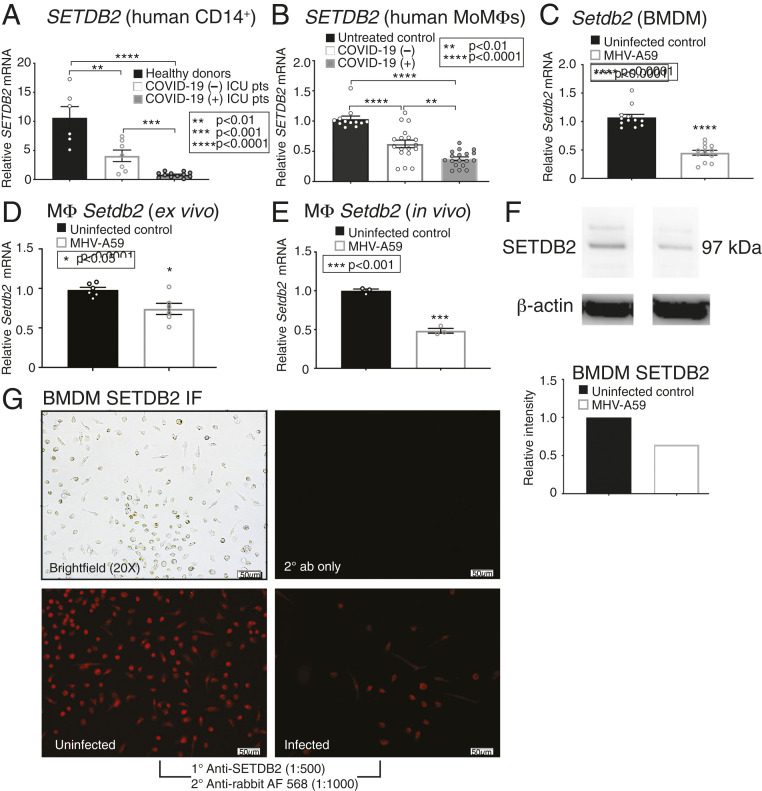
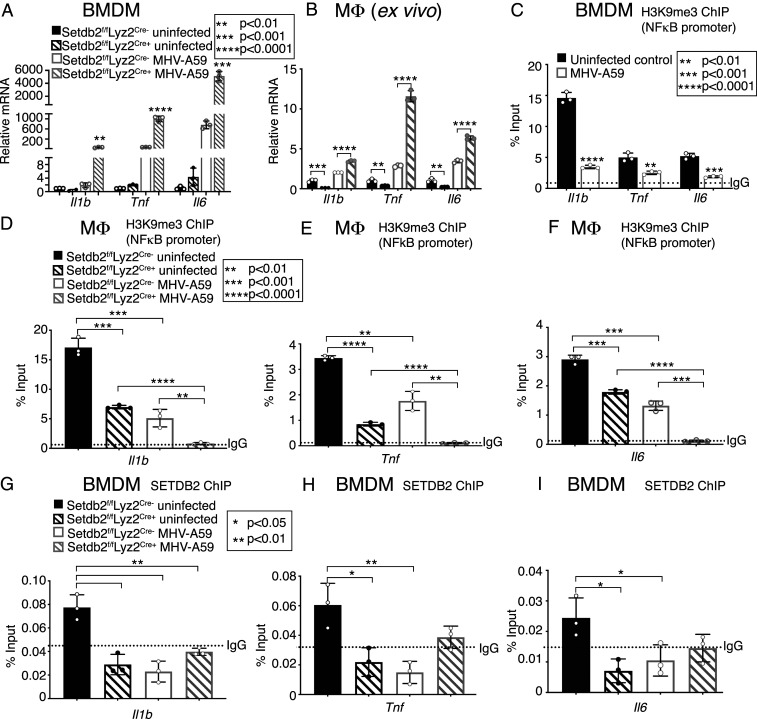
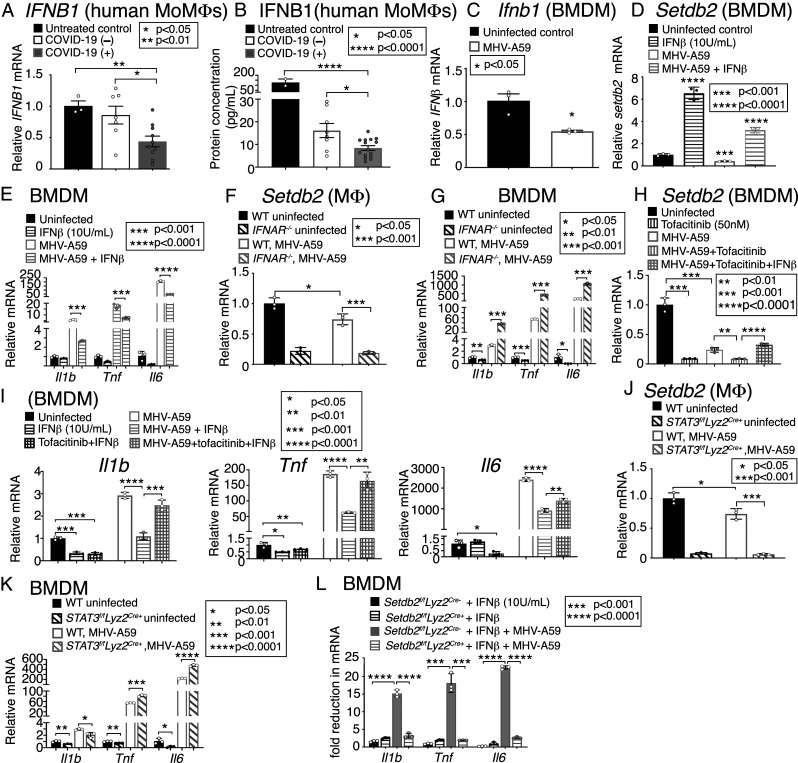
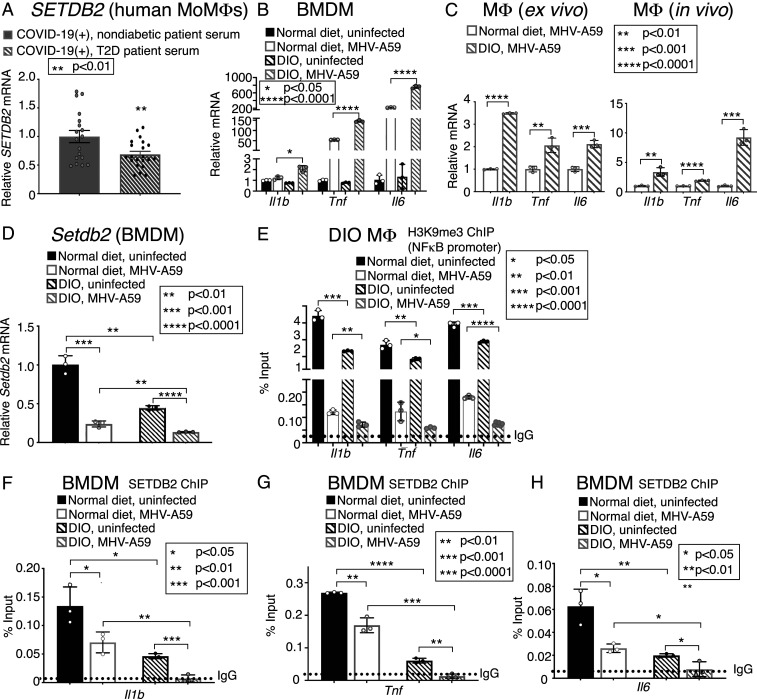
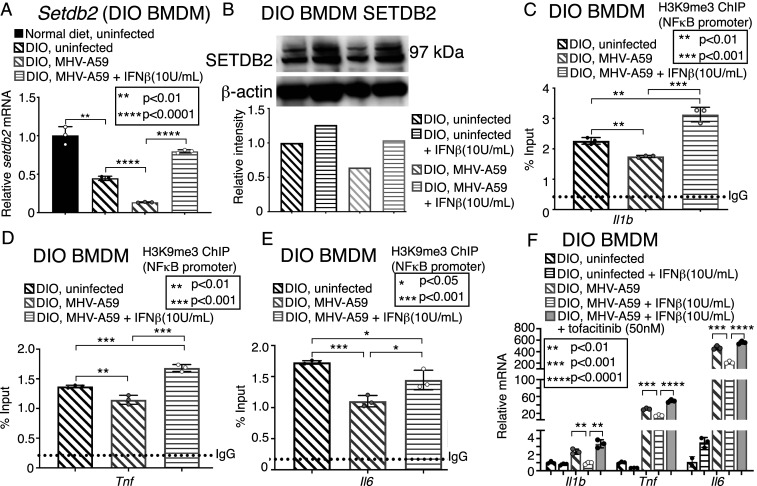
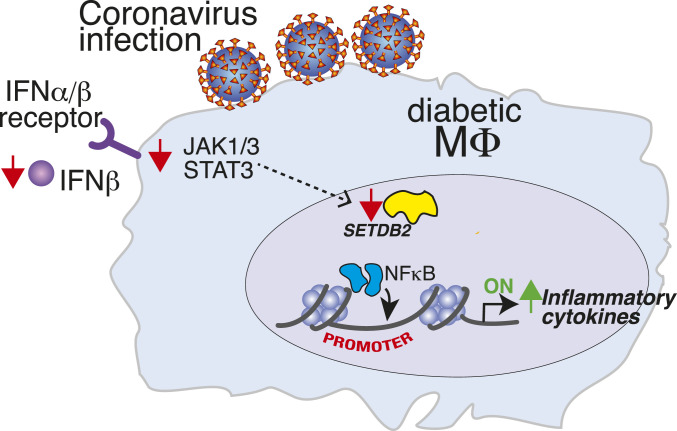
COVID-19 induces a robust, extended inflammatory "cytokine storm" that contributes to an increased morbidity and mortality, particularly in patients with type 2 diabetes (T2D). Macrophages are a key innate immune cell population responsible for the cytokine storm that has been shown, in T2D, to promote excess inflammation in response to infection. Using peripheral monocytes and sera from human patients with severe acute respiratory syndrome coronavirus 2 (SARS-CoV-2), and a murine hepatitis coronavirus (MHV-A59) (an established murine model of SARS), we identified that coronavirus induces an increased Mφ-mediated inflammatory response due to a coronavirus-induced decrease in the histone methyltransferase, SETDB2. This decrease in SETDB2 upon coronavirus infection results in a decrease of the repressive trimethylation of histone 3 lysine 9 (H3K9me3) at NFkB binding sites on inflammatory gene promoters, effectively increasing inflammation. Mφs isolated from mice with a myeloid-specific deletion of SETDB2 displayed increased pathologic inflammation following coronavirus infection. Further, IFNβ directly regulates SETDB2 in Mφs via JaK1/STAT3 signaling, as blockade of this pathway altered SETDB2 and the inflammatory response to coronavirus infection. Importantly, we also found that loss of SETDB2 mediates an increased inflammatory response in diabetic Mϕs in response to coronavirus infection. Treatment of coronavirus-infected diabetic Mφs with IFNβ reversed the inflammatory cytokine production via up-regulation of SETDB2/H3K9me3 on inflammatory gene promoters. Together, these results describe a potential mechanism for the increased Mφ-mediated cytokine storm in patients with T2D in response to COVID-19 and suggest that therapeutic targeting of the IFNβ/SETDB2 axis in T2D patients may decrease pathologic inflammation associated with COVID-19.

Keywords: coronavirus; diabetes; epigenetics; inflammation; monocyte/macrophage.


Conflict of interest statement

The authors declare no competing interest.

Figures

Fig. 1.
Fig. 1.
The murine coronavirus MHV-A59 induces Mφ-mediated inflammation. (A) Il1b, Tnf, and Il6 expression measured in BMDMs from C57BL/6 mice 24 h following in vitro infection with MHV-A59 (MOI 0.5) and compared to uninfected BMDMs (n = 12 mice per group, run in triplicate). (B) Supernatant protein levels of IL-1β, TNFα, and IL-6 from BMDMs from C57BL/6 mice 24 h following in vitro infection with MHV-A59 (MOI 0.5) and compared to uninfected BMDMs (n = 6 mice per group, run in triplicate). (C) Il1b, Tnf, and Il6 expression measured in splenic Mφs (CD3/CD19/NK1.1/Ly6G/CD11b+) from C57BL/6 mice 24 h following ex vivo infection with MHV-A59 (MOI 0.5) and compared to uninfected Mφs (n = 5 mice per group, pooled and run in triplicate). (D) Il1b, Tnf, and Il6 expression measured in splenic Mφs (CD3/CD19/NK1.1/Ly6G/CD11b+) isolated from C57BL/6 mice 3 d after intranasal infection with MHV-A59 (2 × 10⁵ pfu) compared to uninfected Mφs (n = 5 mice per group, run in triplicate). *P < 0.05, ***P < 0.001, ****P < 0.0001. Data are presented as the mean ± SEM. All data are representative of two to four independent experiments. Data were first analyzed for normal distribution, and, if data passed the normality test, two-tailed Student’s t test was used.
Fig. 2.
Fig. 2.
The histone methyltransferase SETDB2 is decreased in human and murine Mφs following infection with SARS-CoV-2 or MHV-A59. (A) SETDB2 expression measured in human CD14+ cells sorted from peripheral blood from healthy donors (n = 6) and COVID-19 (+) (n = 12) and COVID-19 (−) (n = 7) critically ill patients, run in triplicate. (B) SETDB2 expression measured in MoMs from healthy donors (n = 4) 24 h following exposure to serum (1:1 diluted in RPMI) from COVID-19 (+) (n = 18) and COVID-19 (−) (n = 18) critically ill patients, or untreated (n = 12), run in triplicate). (C) Setdb2 expression measured in BMDMs from C57BL/6 mice 5 h following in vitro infection with MHV-A59 (MOI 0.5) and compared to uninfected BMDMs (n = 12 mice per group, run in triplicate). (D) Setdb2 expression measured in splenic Mφs (CD3/CD19/NK1.1/Ly6G/CD11b+) from C57BL/6 mice 5 h following ex vivo infection with MHV-A59 (MOI 0.5) and compared to uninfected Mφs (n = 5 mice per group, pooled and run in triplicate, repeated twice). (E) Setdb2 expression measured in splenic Mφs (CD3/CD19/NK1.1/Ly6G/CD11b+) isolated from C57BL/6 mice 5 d after intranasal infection with MHV-A59 (2 × 10⁵ pfu) compared to uninfected Mφs (n = 5 mice per group, pooled and run in triplicate). (F) SETDB2 protein measured in BMDMs from C57BL/6 mice 12 h following in vitro infection with MHV-A59 (MOI 0.5) via Western blot (n = 5 mice per group, pooled). Representative blots are shown. (G) SETDB2 protein immunofluorescent microscopy in BMDMs from C57BL/6 mice 12 h following in vitro infection with MHV-A59 (MOI 0.5) (n = 5 mice/group, pooled). Representative images are shown. *P < 0.05, **P < 0.01, ***P < 0.001, ****P < 0.0001. Data are presented as the mean ± SEM. All data are representative of two to four independent experiments. Data were first analyzed for normal distribution, and, if data passed the normality test, two-tailed Student’s t test was used.
Fig. 3.
Fig. 3.
SETDB2 regulates inflammatory cytokines IL-1β, TNFα, and IL-6 via H3K9me3 at NFκB binding sites on gene promoters in response to infection with coronavirus MHV-A59. (A) Il1b, Tnf, and IL6 expression measured in BMDMs from Setdb2f/fLyz2Cre+ mice 24 h following in vitro infection with MHV-A59 (MOI 0.5) and compared to infected Setdb2f/fLyz2Cre- BMDMs (n = 5 mice per group, pooled and run in triplicate). (B) Il1b, Tnf, and IL6 expression measured in splenic Mφs (CD3/CD19/NK1.1/Ly6G/CD11b+) from Setdb2f/fLyz2Cre+ mice 12 h following ex vivo infection with MHV-A59 (MOI 0.5) and compared to Setdb2f/fLyz2Cre- Mφs (n = 5 mice per group, pooled and run in triplicate). (C) ChIP analysis of H3K9me3 on the Il1b, Tnf, and IL6 promoters in BMDMs from C57BL/6 mice 24 h following in vitro infection with MHV-A59 (MOI 0.5) and compared to uninfected BMDMs (n = 5 mice per group, pooled and run in triplicate). (DF) ChIP analysis of H3K9me3 on the Il1b (D), Tnf (E), and Il6 (F) promoters splenic Mφs (CD3/CD19/NK1.1/Ly6G/CD11b+) from Setdb2f/fLyz2Cre+ mice and Setdb2f/fLyz2Cre- littermate controls 12 h following ex vivo infection with MHV-A59 (MOI 0.5) (n = 5 mice per group, pooled and run in triplicate). (GI) ChIP analysis of SETDB2 on the Il1b (G), Tnf (H), and Il6 (I) promoters in BMDMs from Setdb2f/fLyz2Cre+ mice and Setdb2f/fLyz2Cre- littermate controls mice 5 h following in vitro infection with MHV-A59 (MOI 0.5) (n = 5 mice per group, pooled and run in triplicate). *P < 0.05, **P < 0.01, ***P < 0.001, ****P < 0.0001. Data are presented as the mean ± SD. All data are representative of two to four independent experiments. Data were first analyzed for normal distribution, and, if data passed the normality test, two-tailed Student’s t test was used.
Fig. 4.
Fig. 4.
IFNβ/JaK1/STAT-3 signaling regulates Setdb2 expression in Mφs in response to infection with coronavirus MHV-A59. (A) IFNB1 expression measured in MoMs from healthy donors (n = 3) 24 h following exposure to serum (1:1 diluted in RPMI) from COVID-19 (+) (n = 10) and COVID-19 (−) (n = 8) critically ill patients, or untreated (n = 3, run in triplicate). (B) Supernatant IFNβ protein measured in MoMs from healthy donors (n = 3) 24 h following exposure to serum (1:1 diluted in RPMI) from COVID-19 (+) (n = 15) and COVID-19 (−) (n = 8) critically ill patients, or untreated (activated with 100 ng/mL LPS) (n = 2, run in triplicate). (C) Ifnb1 expression measured in BMDMs from C57BL/6 mice 5 h following in vitro infection with MHV-A59 (MOI 0.5) (n = 5 mice per group, pooled and run in triplicate). (D) Setdb2 expression measured in BMDMs from C57BL/6 mice 5 h following in vitro infection with MHV-A59 (MOI 0.5), with and without coadministration with IFNβ (10 U/mL), compared to uninfected BMDMs (n = 5 mice per group, pooled and run in triplicate). (E) Il1b, Tnf, and IL6 expression measured in BMDMs from C57BL/6 mice 24 h following in vitro infection with MHV-A59 (MOI 0.5), with and without coadministration with IFNβ (10 U/mL), compared to uninfected BMDMs (n = 5 mice per group, pooled and run in triplicate). (F) Setdb2 expression measured in splenic Mφs (CD3/CD19/NK1.1/Ly6G/CD11b+) from Ifnar−/− mice 5 h following ex vivo infection with MHV-A59 (MOI 0.5), compared to Mφs from Ifnar+/+ littermate controls (n = 5 mice per group, pooled and run in triplicate). (G) Il1b, Tnf, and IL6 expression measured in BMDMs from Ifnar−/− mice 24 h following in vitro infection with MHV-A59 (MOI 0.5), compared to BMDMs from Ifnar+/+ littermate controls (n = 5 mice per group, pooled and run in triplicate). (H) Setdb2 expression measured in BMDMs from C57BL/6 mice 5 h following in vitro infection with MHV-A59 (MOI 0.5), with and without coadministration with tofacitinib (50 nM) and IFNβ (10 U/mL) with tofacitinib (n = 5 mice per group, pooled and run in triplicate). (I) Il1b, Tnf, and IL6 expression in BMDMs from C57BL/6 mice 24 h following in vitro infection with MHV-A59 (MOI 0.5), with and without coadministration with tofacitinib (50 nM) and IFNβ (10 U/mL) with tofacitinib (n = 5 mice per group, pooled and run in triplicate). (J) Setdb2 expression measured in splenic Mφs (CD3/CD19/NK1.1/Ly6G/CD11b+) from Stat3f/fLyz2Cre+ mice 5 h following ex vivo infection with MHV-A59 (MOI 0.5), compared to infected Mφs from Stat3f/fLyz2Cre- littermate controls (n = 5 mice per group, pooled and run in triplicate). (K) Il1b, Tnf, and IL6 expression measured in BMDMs from Stat3f/fLyz2Cre+ mice 24 h following in vitro infection with MHV-A59 (MOI 0.5), compared to BMDMs from Stat3f/fLyz2Cre- littermate controls (n = 5 mice per group, pooled and run in triplicate). (L) Il1b, Tnf, and IL6 expression measured in BMDMs from Setdb2f/fLyz2Cre+ mice 24 h following in vitro infection with MHV-A59 (MOI 0.5), coadministered IFNβ (10 U/mL) and compared to infected Setdb2f/fLyz2Cre- BMDMs coadministered IFNβ (n = 5 mice per group, pooled and run in triplicate). *P < 0.05, **P < 0.01, ***P < 0.001, ****P < 0.0001. Data are presented as the mean ± SEM (in A and B) and mean ± SD (in CL). All data are representative of two to four independent experiments. Data were first analyzed for normal distribution, and, if data passed the normality test, two-tailed Student’s t test was used.
Fig. 5.
Fig. 5.
Reduced expression of SETDB2 mediates an increased inflammatory cytokine response in human and murine diabetic Mφs in response to infection with coronavirus SARS-CoV-2 and MHV-A59. (A) SETDB2 expression measured in MoMs from healthy donors (n = 3) 24 h following exposure to serum (1:1 diluted in RPMI) from critically ill COVID-19 (+) diabetic (n = 21) and nondiabetic (n = 18) patients, run in triplicate. (B) Il1b, Tnf, and IL6 expression measured in BMDMs from DIO C57BL/6 mice 24 h following in vitro infection with MHV-A59 (MOI 0.5) and compared to WT C57BL/6 BMDMs (n = 10 mice per group, pooled and run in triplicate). (C) Il1b, Tnf, and IL6 expression of splenic Mφs (CD3/CD19/NK1.1/Ly6G/CD11b+) from DIO C57BL/6 mice and WT controls 24 h following infection ex vivo with MHV-A59 (MOI 0.5) and after 5 d of in vivo infection with MHV-A59 (2 × 10⁵ pfu) (n = 5 mice per group, pooled and run in triplicate). (D) Setdb2 expression measured in measured in BMDMs from WT and DIO C57BL/6 mice 5 h after infection with MHV-A59 (MOI 0.5) (n = 5 mice per group, pooled and run in triplicate). (E) ChIP analysis of H3K9me3 on the Il1b, Tnf, and IL6 promoters in splenic Mφs (CD3/CD19/NK1.1/Ly6G/CD11b+) isolated from DIO C57BL/6 mice 5 d after intranasal infection with MHV-A59 (2 × 10⁵ pfu) compared to uninfected DIO Mφs (n = 5 mice per group, pooled and run in triplicate). (FH) ChIP analysis of SETDB2 on the Il1b (F), Tnf (G), and Il6 (H) promoters in BMDMs from WT and DIO C57BL/6 mice 24 h following in vitro infection with MHV-A59 (MOI 0.5) and compared to uninfected controls (n = 5 mice per group, pooled and run in triplicate). *P < 0.05, **P < 0.01, ***P < 0.001, ****P < 0.0001. Data are presented as the mean ± SEM (in A) and mean ± SD (in BH). All data are representative of two to four independent experiments. Data were first analyzed for normal distribution, and, if data passed the normality test, two-tailed Student’s t test was used.
Fig. 6.
Fig. 6.
IFNβ decreases diabetic Mφ-mediated inflammation in response to infection with coronavirus MHV-A59 via up-regulation of SETDB2. (A) Setdb2 expression measured in BMDMs from DIO C57BL/6 mice 5 h following in vitro infection with MHV-A59 (MOI 0.5), with and without coadministration with IFNβ (10 U/mL) (n = 5 mice per group, pooled and run in triplicate). (B) SETDB2 protein measured in BMDMs from C57BL/6 mice 12 h following in vitro infection with MHV-A59 (MOI 0.5), with and without coadministration with IFNβ (10 U/mL), via Western blot (n = 5 mice per group, pooled). Representative blot is shown. (CE) ChIP analysis of H3K9me3 on the Il1b (C), Tnf (D), and Il6 (E) promoters in BMDMs from DIO C57BL/6 mice 24 h following in vitro infection with MHV-A59 (MOI 0.5) with and without coadministration of IFNβ (10 U/mL) compared to uninfected DIO BMDMs (n = 5 mice per group, pooled and run in triplicate). (F) Il1b, Tnf, and IL6 expression in BMDMs from DIO C57BL/6 mice 24 h following in vitro infection with MHV-A59 (MOI 0.5), with and without coadministration with tofacitinib (50 nM) and IFNβ (10 U/mL) with tofacitinib (n = 5 mice per group, pooled and run in triplicate). *P < 0.05, **P < 0.01, ***P < 0.001, ****P < 0.0001. Data are presented as the mean ± SD. All data are representative of two to four independent experiments. Data were first analyzed for normal distribution, and, if data passed the normality test, two-tailed Student’s t test was used.
Fig. 7.
Fig. 7.
Schematic of SETDB2 in diabetic macrophages following coronavirus infection.

Similar articles

Cited by

References

    1. Dong E., Du H., Gardner L., An interactive web-based dashboard to track COVID-19 in real time. Lancet Infect Dis. 20, 533–534 (2020). - PMC - PubMed
    1. Fajgenbaum D. C., June C. H., Cytokine storm. N. Engl. J. Med. 383, 2255–2273 (2020). - PMC - PubMed
    1. Del Valle D. M., et al. ., An inflammatory cytokine signature predicts COVID-19 severity and survival. Nat. Med. 26, 1636–1643 (2020). - PMC - PubMed
    1. Hu B., Huang S., Yin L., The cytokine storm and COVID-19. J. Med. Virol. 93, 250–256 (2021). - PMC - PubMed
    1. Ragab D., Salah Eldin H., Taeimah M., Khattab R., Salem R., The COVID-19 cytokine storm; what we know so far. Front. Immunol. 11, 1446 (2020). - PMC - PubMed

Publication types

MeSH terms