. 2021 Sep 7;118(36):e2025000118.
doi: 10.1073/pnas.2025000118.

Translational value of choroid plexus imaging for tracking neuroinflammation in mice and humans

Affiliations

Translational value of choroid plexus imaging for tracking neuroinflammation in mice and humans

Vinzenz Fleischer et al. Proc Natl Acad Sci U S A. .

Abstract

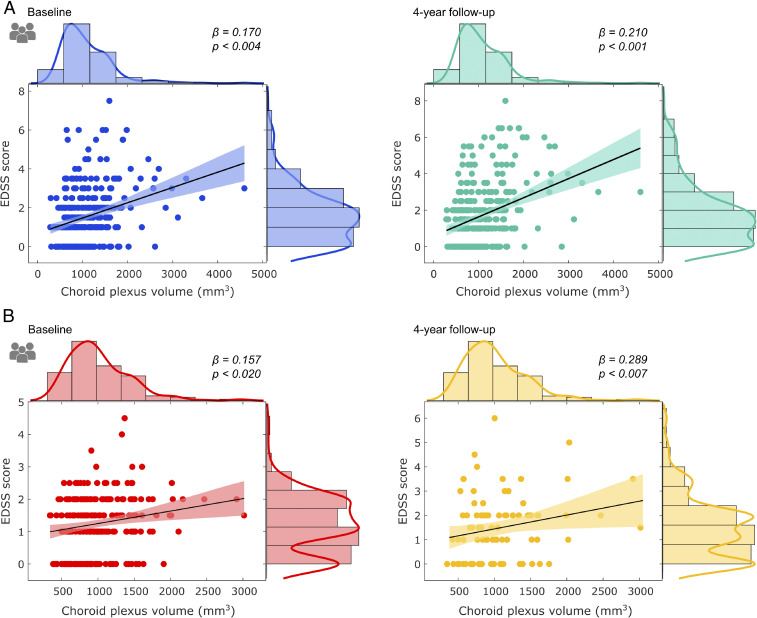
Neuroinflammation is a pathophysiological hallmark of multiple sclerosis and has a close mechanistic link to neurodegeneration. Although this link is potentially targetable, robust translatable models to reliably quantify and track neuroinflammation in both mice and humans are lacking. The choroid plexus (ChP) plays a pivotal role in regulating the trafficking of immune cells from the brain parenchyma into the cerebrospinal fluid (CSF) and has recently attracted attention as a key structure in the initiation of inflammatory brain responses. In a translational framework, we here address the integrity and multidimensional characteristics of the ChP under inflammatory conditions and question whether ChP volumes could act as an interspecies marker of neuroinflammation that closely interrelates with functional impairment. Therefore, we explore ChP characteristics in neuroinflammation in patients with multiple sclerosis and in two experimental mouse models, cuprizone diet-related demyelination and experimental autoimmune encephalomyelitis. We demonstrate that ChP enlargement-reconstructed from MRI-is highly associated with acute disease activity, both in the studied mouse models and in humans. A close dependency of ChP integrity and molecular signatures of neuroinflammation is shown in the performed transcriptomic analyses. Moreover, pharmacological modulation of the blood-CSF barrier with natalizumab prevents an increase of the ChP volume. ChP enlargement is strongly linked to emerging functional impairment as depicted in the mouse models and in multiple sclerosis patients. Our findings identify ChP characteristics as robust and translatable hallmarks of acute and ongoing neuroinflammatory activity in mice and humans that could serve as a promising interspecies marker for translational and reverse-translational approaches.

Keywords: choroid plexus; disease activity; multiple sclerosis; neuroinflammation.


Conflict of interest statement

The authors declare no competing interest.

Figures

Fig. 1.
Fig. 1.
Volumetric differences in the choroid plexus in human and mouse models. Box plots depicting choroid plexus volumes as derived from individual MRI. (A) In humans, enlarged volumes in MS patients with respect to HCs are evidenced. In mice, choroid plexus volumes showed a similar enlargement during the course of (B) the cuprizone-induced demyelination and (C) with increased disability during the course of the EAE mouse model. **P < 0.01.
Fig. 2.
Fig. 2.
Associations between clinical disability and choroid plexus enlargement in MS patients. Scatter plots depicting the association between choroid plexus volume and clinical disability, as measured with EDSS, in the study cohort (A), at baseline (blue) and at 4-y follow-up (green). In addition, the scatter plots derived from (B) the replication cohort are provided for baseline (red) and 4-y follow-up (yellow).
Fig. 3.
Fig. 3.
Volumetric differences and associations of the choroid plexus with clinical, MRI, CSF, and cognitive measures. Choroid plexus volumes, derived from individual MRI in humans, depicting enlarged volumes in MS patients with EDA in comparison to MS patients with NEDA, each in comparison to healthy individuals’ choroid plexus volume (A). Choroid plexus volumes depicting enlarged volumes in MS patients with high T2 lesion load in the MRI in comparison to patients with low T2 lesion load (B). Scatter plots depicting the association between choroid plexus volume and cortical thickness in the study cohort (C) and the replication cohort (D). Scatter plots depicting the association between choroid plexus volume and albumin in the CSF (E). Scatter plots depicting the association between choroid plexus volume and cognitive performance in the study cohort, as measured with the Symbol Digit Modalities Test (F). **P < 0.01.
Fig. 4.
Fig. 4.
Increased numbers of activated microglia and infiltrating T cells in the murine choroid plexus. Numbers of Iba1+ and CD3+ cells within the choroid plexus at different stages of the (A and B) cuprizone and (C and D) EAE mouse models were analyzed by immunohistochemistry. Representative images of the fluorescent stainings of the (E and F) cuprizone mice and (G and H) EAE mice depicting Iba1 (red)/Clec7a (green) positive activated microglia as well as CD3 (red) positive T cells. Nuclei were always counterstained with DAPI (blue). Statistical analysis was performed using ANOVA with Dunnett’s post hoc test compared to naïve mice. *P < 0.05, **P < 0.01, ***P < 0.001. (Scale bar: 100 µm.)
Fig. 5.
Fig. 5.
Associations between choroid plexus volume and astrocyte and microglia counts in relation to the degree of myelination. Scatter plots in the left column illustrate the association between the number of GFAP+ cells in the cortex and the MRI-derived choroid plexus volume at baseline (A), demyelination (B), and remyelination (C) in the cuprizone mouse model. Right column scatter plots illustrate the association between the number of microglia cells in the cortex and the MRI-derived choroid plexus volume at baseline (D), demyelination (E), and remyelination (F) in the cuprizone mouse model.
Fig. 6.
Fig. 6.
Choroid plexus transcriptomics from the RNA sequencing. In A, the principal component analyses (PCA) show a good separation between the EAE peak (n = 5) and the naive EAE group (n = 5). The PCA analyses in the cuprizone model (B) show a very good cluster separation between the demyelination group (n = 3) and the naive group (n = 5). In C, the Venn diagram shows the differential expressed genes for the comparison between the EAE peak versus naive (n = 2,090) and cuprizone-diet induced demyelination versus naive (n = 266), and their shared gene expression (n = 44). In D, the common top 10 up-regulated biological processes pathways both in the EAE peak and the cuprizone demyelination groups are shown. In E, the up-regulated biological processes pathways for the two group comparisons, namely peak EAE versus naive and the cuprizone demyelination versus naive are shown, followed by the molecular function pathways in F, respectively. The up-regulated functional pathways shown here are all P adjusted < 0.05.

Comment in

References

    1. Talhada D., et al. ., The choroid plexus: Simple structure, complex functions. J. Neurosci. Res. 98, 751–753 (2020). - PubMed
    1. Louveau A., et al. ., Structural and functional features of central nervous system lymphatic vessels. Nature 523, 337–341 (2015). - PMC - PubMed
    1. Kipnis J., Multifaceted interactions between adaptive immunity and the central nervous system. Science 353, 766–771 (2016). - PMC - PubMed
    1. Iliff J. J., et al. ., A paravascular pathway facilitates CSF flow through the brain parenchyma and the clearance of interstitial solutes, including amyloid β. Sci. Transl. Med. 4, 147ra111 (2012). - PMC - PubMed
    1. Benarroch E. E., Choroid plexus–CSF system: Recent developments and clinical correlations. Neurology 86, 286–296 (2016). - PubMed

Publication types