. 2021 Sep 3;12(1):5213.
doi: 10.1038/s41467-021-25453-2.

Long-term treatment with senolytic drugs Dasatinib and Quercetin ameliorates age-dependent intervertebral disc degeneration in mice

Affiliations

Long-term treatment with senolytic drugs Dasatinib and Quercetin ameliorates age-dependent intervertebral disc degeneration in mice

Emanuel J Novais et al. Nat Commun. .

Abstract

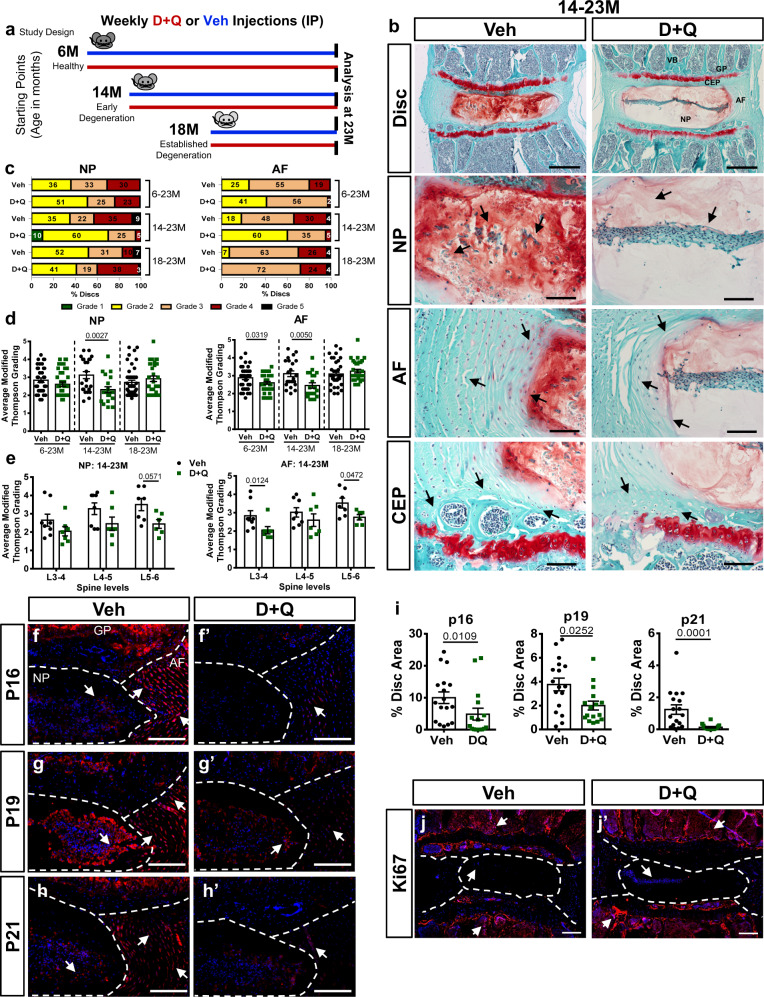
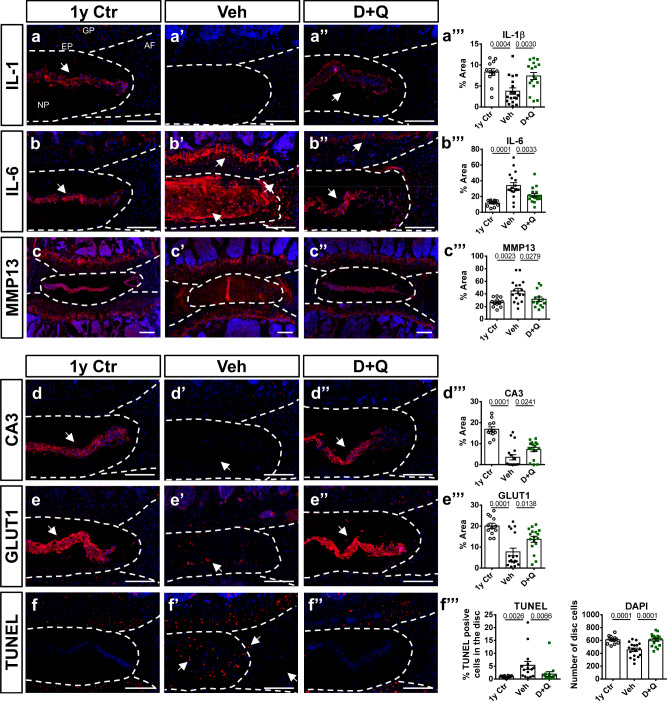
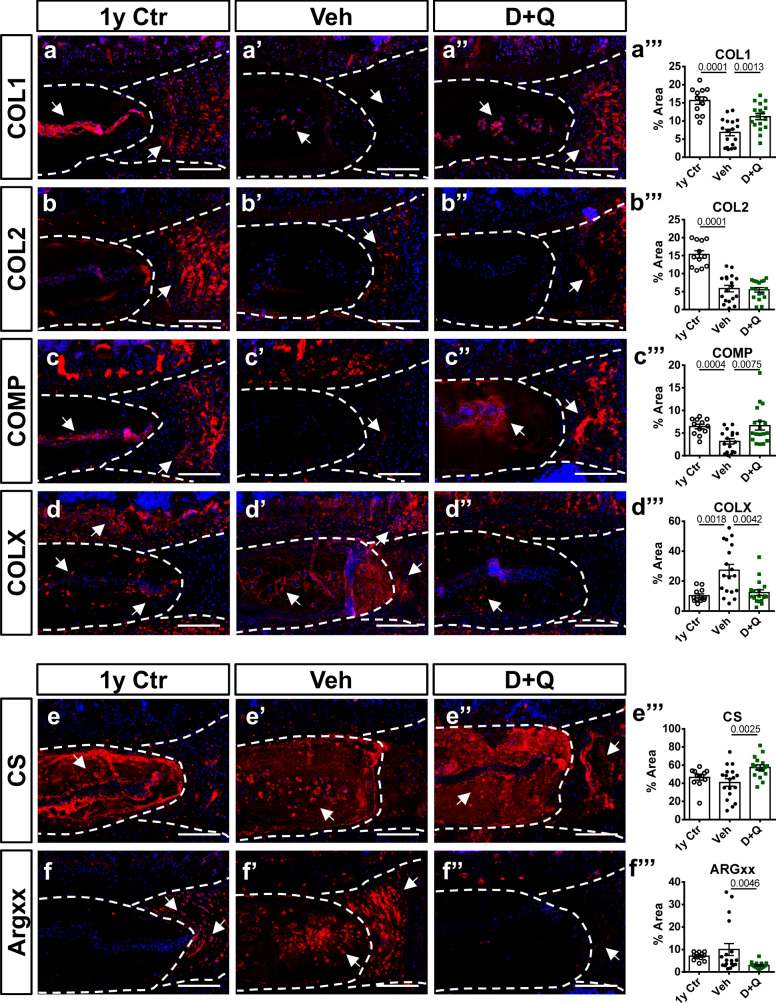
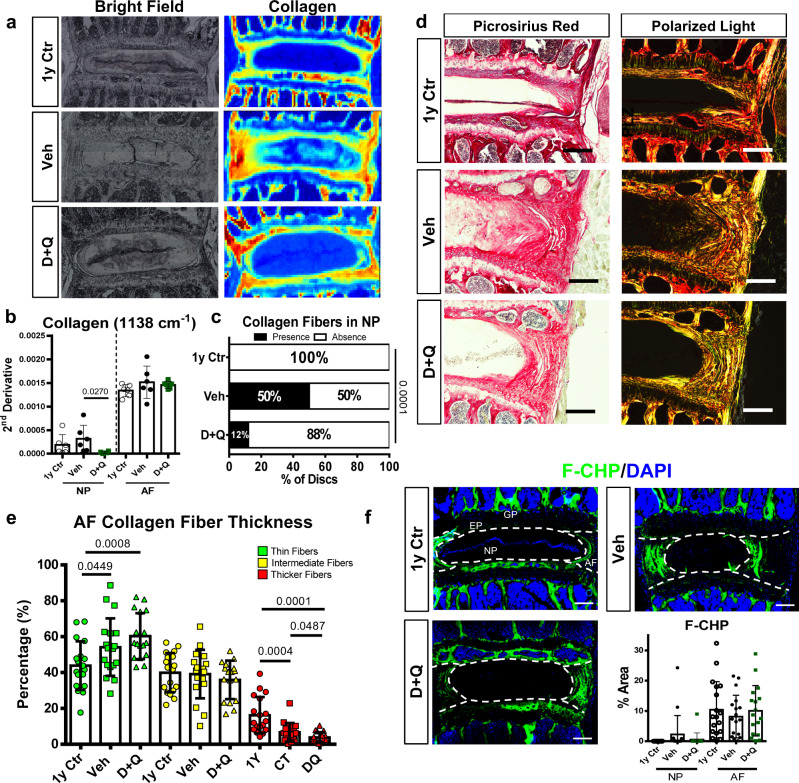
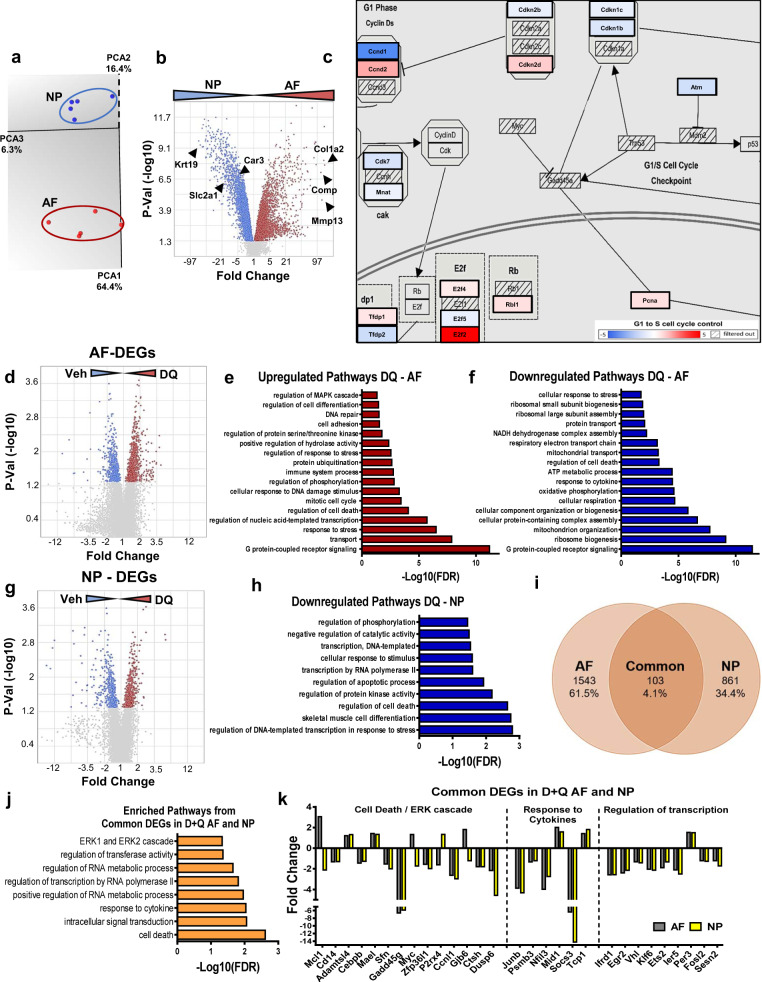
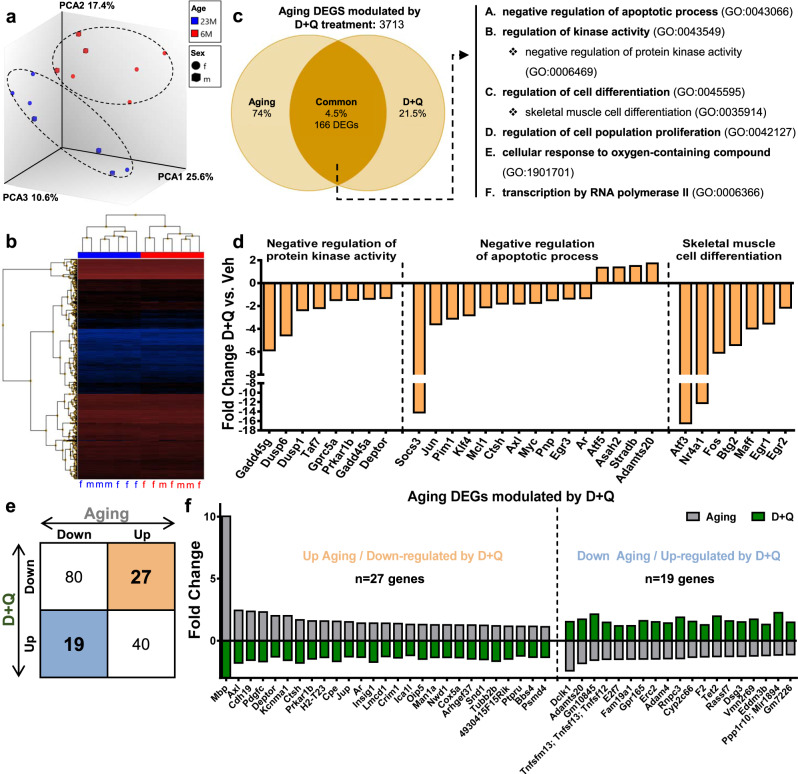
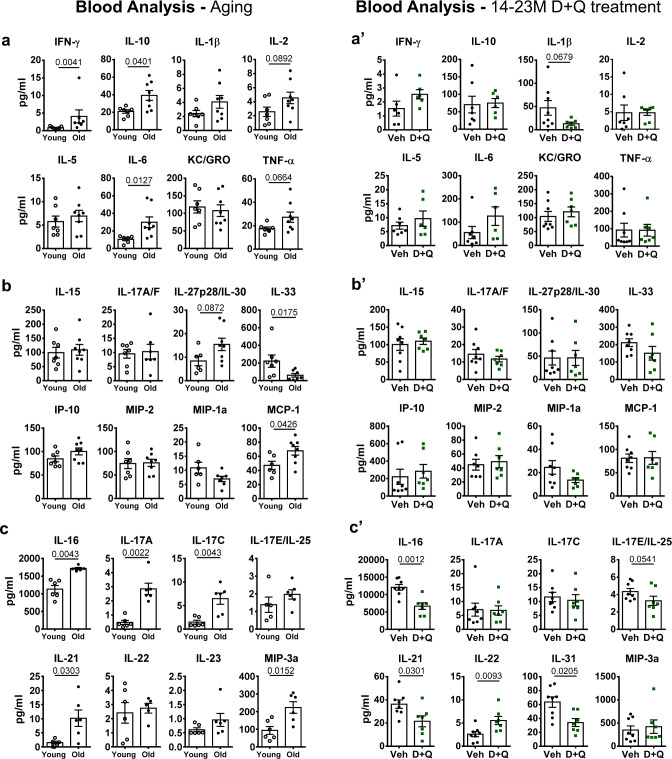
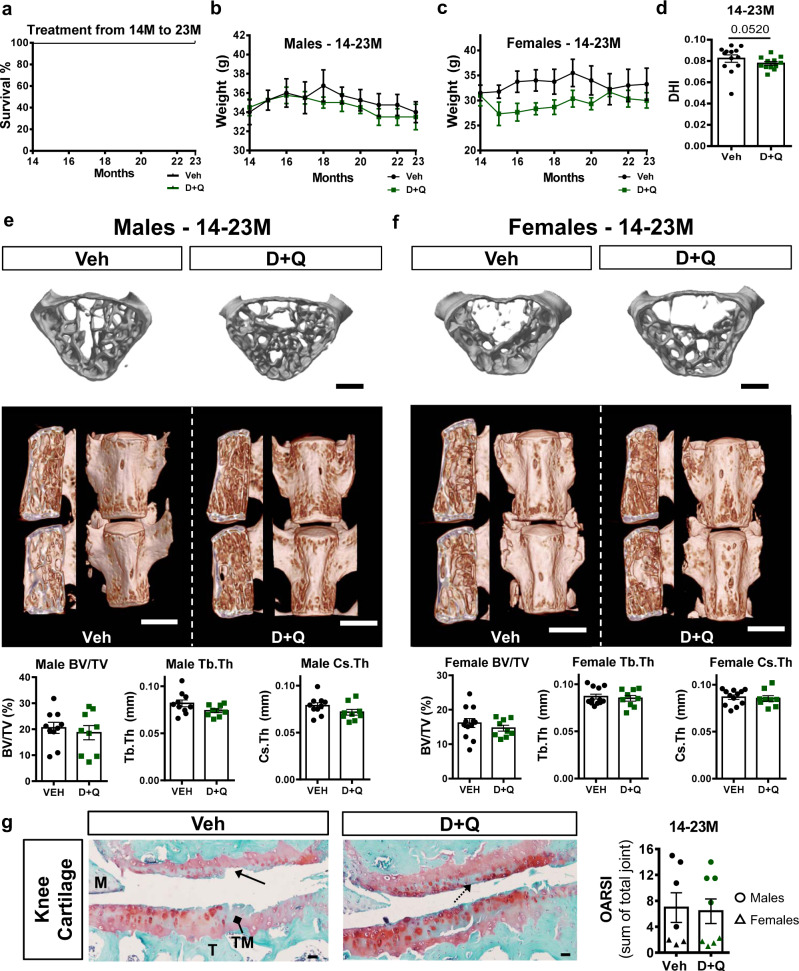
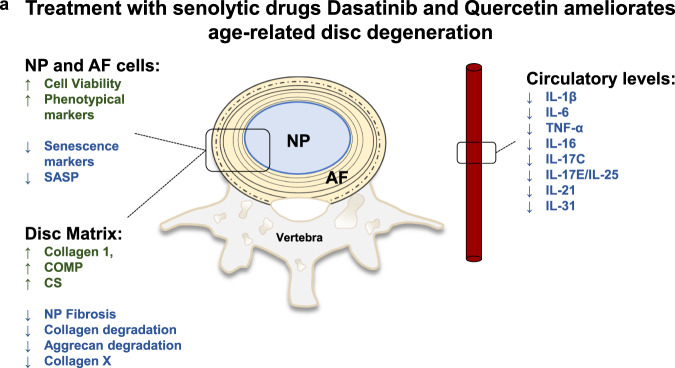
Intervertebral disc degeneration is highly prevalent within the elderly population and is a leading cause of chronic back pain and disability. Due to the link between disc degeneration and senescence, we explored the ability of the Dasatinib and Quercetin drug combination (D + Q) to prevent an age-dependent progression of disc degeneration in mice. We treated C57BL/6 mice beginning at 6, 14, and 18 months of age, and analyzed them at 23 months of age. Interestingly, 6- and 14-month D + Q cohorts show lower incidences of degeneration, and the treatment results in a significant decrease in senescence markers p16INK4a, p19ARF, and SASP molecules IL-6 and MMP13. Treatment also preserves cell viability, phenotype, and matrix content. Although transcriptomic analysis shows disc compartment-specific effects of the treatment, cell death and cytokine response pathways are commonly modulated across tissue types. Results suggest that senolytics may provide an attractive strategy to mitigating age-dependent disc degeneration.


Conflict of interest statement

The authors declare no competing interests.

Figures

Fig. 1
Fig. 1. Senolytic drugs Dasatinib and Quercetin alleviate age-dependent intervertebral disc degeneration and decrease abundance of senescence markers.
a Schematic showing study design: peritoneal injections were administered once every week to mice starting at 6 (6 M), 14 (14 M), or 18 (18 M) months of age and ending at 23 (23 M) months of age. Vehicle (1:1 PBS/DMSO), D + Q (5 mg/kg Dasatinib plus 50 mg/kg Quercetin). b Histology of the 14–23 M cohort showed preservation of tissue architecture and cell morphology in the NP, AF, and CEP of D + Q-treated mice. 5X and 20X images of 14–23 M show NP, AF, and CEP compartment morphologies. c, d Modified Thompson Grading averages and grade distributions showed lower average scores of degeneration in mice that were treated from 6 M and 14 M. Mice in 18–23 M D + Q cohort showed comparable scores the Veh group. e Level-by-level analysis of L3-6 in the lumbar spine evidenced decreases in degeneration grades in the NP compartment at L5-6 and in the AF compartment at L3-4 and L5-6. fj Staining and abundance of key markers of senescence p16INK4a, p19ARF and p21, and cell cycle: Ki67 in disc compartments. Two-tailed t-test or Mann–Whitney test were used as appropriate for comparing differences between Veh and D + Q groups. 6–23 M Veh (n = 13), D + Q (n = 15); 14–23 M Veh (n = 8), D + Q (n = 7); 18–23 M Veh (n = 11), D + Q (n = 9). Data are represented as mean ± SEM. Scale bar b (disc) = 200 µm; Scale bar b (NP, AF, and CEP) = 50 µm; Scale bar ff’, gg’, ii’, and jj’ = 200 µm. NP: nucleus pulposus; AF: annulus fibrosus; EP: endplate; GP: growth plate, VB: vertebral bone. Source data are provided as a Source Data file.
Fig. 2
Fig. 2. D + Q treatment prevents age-dependent SASP progression and promotes NP cell phenotype maintenance and disc cell viability.
ac”’ Immunohistological staining and staining area quantifications of SASP markers IL-1, IL-6, and MMP13 in the disc compartments of 1-year-old healthy Ctr (1 y Ctr), 14–23 M Veh-, and 14–23 M D + Q-treated mice. de”’ Quantitative immunostaining of NP cell phenotypic markers CA3 and GLUT1. ff”’ Cell death assessment in the disc compartments by TUNEL staining. Two-tailed ANOVA or Kruskal–Wallis tests were used as appropriate; n = 6 mice/group, 2–3 levels per mouse. Data are represented as mean ± SEM. Scale bar = 200 µm. Source data are provided as a Source Data file.
Fig. 3
Fig. 3. D + Q treatment preserved healthy extracellular matrix composition with a decrease in Aggrecan degradation during aging.
a–f”’ Staining and abundance in the disc compartment of essential extracellular matrix proteins in 1 y Ctr, 14–23 M Veh, and 14–23 M D + Q groups: Collagen I, Collagen II, COMP, Collagen X, Chondroitin sulfate, and ARGXX neoepitope. Two-tailed ANOVA or Kruskal–Wallis tests were used as appropriate; n = 6 mice/group, 2–3 levels per mouse were analyzed. Data are represented as mean ± SEM. Scale bar af” = 200 µm. Source data are provided as a Source Data file.
Fig. 4
Fig. 4. D + Q treatment results in lower incidence of NP fibrosis.
a Bright field and chemical map of mean second-derivative peaks for collagen (1338 cm−1). Red: high relative absorbance; yellow: intermediate relative absorbance; blue: low relative absorbance. b Quantification of mean second-derivative peaks for collagen (1338 cm−1). c Quantification of the percentage of presence/absence of collagen fibers within the NP compartment. d 1-year Ctr, Veh and D + Q lumbar discs showing collagen fiber organization under bright field and polarized light (scale bar = 100 μm). e Quantification of collagen fiber thickness distribution and proportion in the AF. f Denatured collagen, measured by a collagen hybridization peptide (CHP) biding assay (scale bar = 200 µm). Two-tailed ANOVA or Kruskal–Wallis tests were used as appropriate; n = 6 mice/group, 2–3 levels per mouse were analyzed. Data are represented as mean ± SEM. Source data are provided as a Source Data file.
Fig. 5
Fig. 5. D + Q treatment promoted transcriptomic modulation of cell death, response to cytokines, regulation of RNA polymerase II, and the ERK1/ERK2 cascade in AF and NP compartments.
a Transcriptomic profiles of AF (n = 5) and NP (n = 5) tissues from 14–23 M Veh mice clustered distinctly with principal component analysis. b Volcano Plot, showing up- and downregulated DEGs from the 23 M AF vs. NP comparison used for GO Process enrichment analysis, p-value ≤ 0.05. c Schematic summarizing the DEGs between the AF and NP at 23 M related to cell cycle regulation. d Volcano Plot, showing up- and downregulated DEGs from the D + Q AF vs. Veh AF comparison, p ≤ 0.05. e Representative GO processes of upregulated genes from D + Q AF vs. Veh AF. f Representative GO processes of downregulated genes from D + Q AF vs. Veh AF. g Volcano Plot, showing up- and downregulated DEGs from the D + Q NP vs. Veh NP comparison, p-value ≤ 0.05. h Representative GO processes of downregulated genes from D + Q NP vs. Veh NP. i Venn Diagram of common DEGs from D + Q AF vs. Veh AF and D + Q NP vs. Veh NP, p-value ≤ 0.05. j Representative GO processes of common DEGs from panel I. k Representative DEGs from selected GO processes from panel j. p-values were calculated using eBayes ANOVA Method (unadjusted). GO analysis was performed using the PANTHER Overrepresentation Test with GO Ontology database annotations and a binomial statistical test with FDR ≤ 0.05. Source data are provided as a Source Data file.
Fig. 6
Fig. 6. D + Q modulates aging-associated DEGs related to negative regulation of apoptotic process, regulation of kinase activity and regulation of cell differentiation pathways.
a, b PCA and hierarchical clustering of transcriptomic signature from 23 M vs. 6 M BL6 NP of deposited data in GSE134955, p < 0.05. c Venn diagram from intersection analysis of aging and D + Q modulated DEGs and the representative GO processes associated with the 166 common DEGs. d Representative common DEGs from selected GO processes from panel C. e Schematic of common DEGs showing directionality of change in each experiment study (Aging vs. D + Q). f Representative DEGs with opposite modulation between aging and D + Q selected from panel e. p-values were calculated using eBayes ANOVA Method (unadjusted). GO analysis was performed using the PANTHER Overrepresentation Test with GO Ontology database annotations and a binomial statistical test with FDR ≤ 0.05. Source data are provided as a Source Data file.
Fig. 7
Fig. 7. D + Q treatment prevented the age-associated systemic increase in proinflammatory molecules, cytokines, and Th17-related proteins.
Multiplex analysis of the main (aa’) proinflammatory molecules, (bb’) cytokines, and (cc’) Th17-related proteins in plasma of young (6–12 M, n = 7), old (23 M, n = 8), Veh-14–23 M (n = 8), and D + Q-14–23M (n = 7) groups. Two-tailed t-test or Mann–Whitney test were used as appropriate. Data are represented as mean ± SEM. Source data are provided as a Source Data file.
Fig. 8
Fig. 8. Long-term D + Q treatment was well tolerated by mice.
a Survival curve from the 14–23 M Veh and. D + Q cohorts. b Weight progression in males from 14–23 M Veh (n = 4) and D + Q (n = 4) cohorts. c Weight progression in females from 14–23 M Veh (n = 4) and D + Q (n = 3) cohorts. d Disc height index comparison between 14 and 23 M Veh and D + Q groups. e Representative lumbar spine μCT pictures and bone properties:BV/TV, trabecular thickness, and cortical bone thickness of Veh (n = 4) and D + Q (n = 4) males from the 14–23 M cohort, L4-L6/mouse. f Representative lumbar spine μCT pictures and bone parameter analysis of BV/TV, trabecular thickness, and cortical bone thickness of Veh (n = 4) and D + Q (n = 3) females from the 14–23 M cohort, L4-L6/mouse. Scale bar e, f = 500 µm. t-test or Mann–Whitney test was used as appropriate. g Representative hindlimb histology from the 14–23 M cohort as assessed by Safranin-O/Fast Green/Hematoxylin. Imaged from the lateral side of the joint. Anatomical and histological features of the joint are denoted: Femur (F), Tibia (T), meniscus (M), tidemark (TM with diamond arrow), Saf-O loss (dotted arrow), and vertical clefts of cartilage loss (solid arrow). OARSI grading (0–6) summed across 4 quadrants of joint from 14–23 M Veh (n = 7) and D + Q (n = 8) cohorts. Males denoted by circles, females by triangles. Scale bar e, f = 500 µm, G = 20 µm. Two-tailed t-test or Mann–Whitney test was used as appropriate. Data are represented as mean ± SEM. Source data are provided as a Source Data file.
Fig. 9
Fig. 9. Senolytics ameliorate age-related disc degeneration.
a Schematic summarizing the overall beneficial effects of D + Q contributing to alleviation of intervertebral disc degeneration during aging.

References

    1. Collaborators GBD. 2017 Disease and Injury Incidence and Prevalence. Global, regional, and national incidence, prevalence, and years lived with disability for 354 Diseases and Injuries for 195 countries and territories, 1990-2017: a systematic analysis for the Global Burden of Disease Study 2017. Lancet. 2018;392:P1789–P1858. doi: 10.1016/S0140-6736(18)32279-7. - DOI - PMC - PubMed
    1. Cheung KMC, et al. Prevalence and pattern of lumbar magnetic resonance imaging changes in a population study of one thousand forty-three individuals. Spine (Phila. Pa. 1976). 2009;34:934–940. doi: 10.1097/BRS.0b013e3181a01b3f. - DOI - PubMed
    1. Merceron C, et al. Loss of HIF-1α in the notochord results in cell death and complete disappearance of the nucleus pulposus. PLoS ONE. 2014;9:e110768. doi: 10.1371/journal.pone.0110768. - DOI - PMC - PubMed
    1. Iatridis JC, Michalek AJ, Purmessur D, Korecki CL. Localized intervertebral disc injury leads to organ level changes in structure, cellularity, and biosynthesis. Cell. Mol. Bioeng. 2009;2:437–447. doi: 10.1007/s12195-009-0072-8. - DOI - PMC - PubMed
    1. Caldeira J, et al. Matrisome profiling during intervertebral disc development and ageing. Sci. Rep. 2017;7:11629. doi: 10.1038/s41598-017-11960-0. - DOI - PMC - PubMed

Publication types

MeSH terms