. 2021 Sep 3;11(1):17630.
doi: 10.1038/s41598-021-96967-4.

Parasites and diet as main drivers of the Malagasy gut microbiome richness and function

Affiliations

Parasites and diet as main drivers of the Malagasy gut microbiome richness and function

Stanislas Mondot et al. Sci Rep. .

Abstract

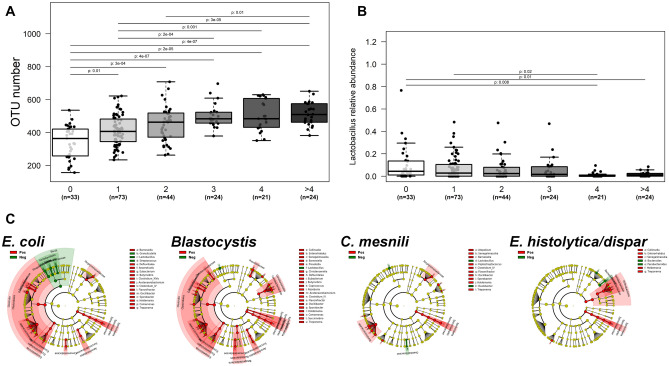
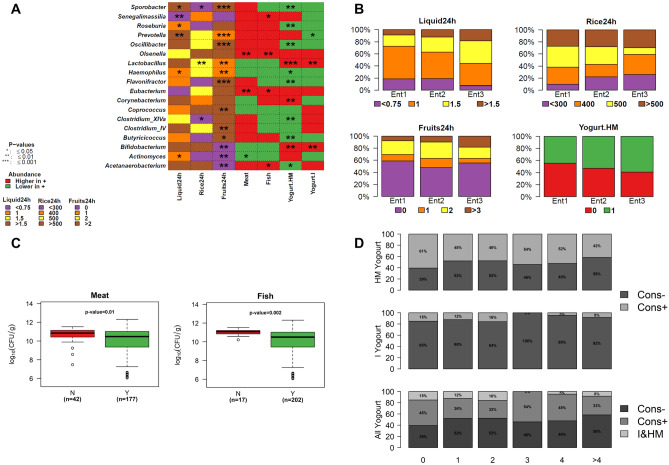
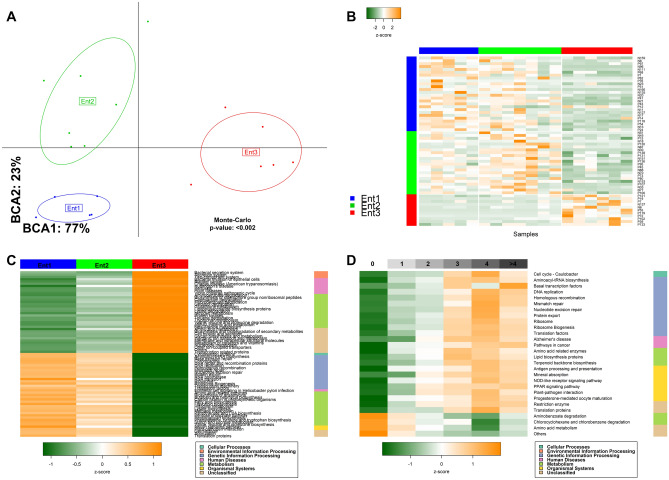
Interactions between the prokaryotic microbiome and eukaryotic parasites in the vertebrate gut may affect overall host health and disease. While intertropical areas exhibit a high rate of parasites carriers, such interactions are understudied in these populations. Our objectives were to (1) describe the gut microbiome of individuals living in Madagascar, (2) identify potential associations between bacterial taxa and parasites colonizing the digestive tract and (3) highlight main determinants of the gut microbiota composition in this developing country. Metadata (socioeconomic, diet, clinical) and fecal samples were collected from 219 volunteers from North-West Madagascar (Mahajanga). Fecal microbiome was assessed through 16S rRNA gene sequencing and metabolomics, and related to dietary habits and parasites carriage. We highlight important Malagasy gut microbiome peculiarities. Out of three detected enterotypes, only one is similar to that observed in Westernized countries (Ruminococcus-driven). Functions associated with the two others (Clostridium sensu stricto-driven and Escherichia/Shigella-driven) are mostly directed toward amino acids biosynthesis and degradation, respectively. Diet and protozoan carriage were the main drivers of microbiota composition. High protozoan carriage was associated with higher diversity, richness and microbial functionalities. The gut microbiome of Malagasy strongly differs from that of Westernized countries. Asymptomatic protozoan carriage and dietary habits are the external factors with the deepest impact on gut microbiome. Further studies are needed to understand whether gut microbial richness constitute a predilection niche for protozoans colonization, due to their gazing features, or whether the parasites themselves induce a higher bacterial richness.


Conflict of interest statement

The authors declare no competing interests.

Figures

Figure 1
Figure 1
Malagasy gut microbiota general description and enterotypes classification. (A) Bacterial families (n = 10) contributing the most to the dissimilarity observed within the 219 microbiomes. Taxa contribution was determined using canonical correspondence analysis of family abundances and was plotted on the two first PCoA dimensions. Arrows length is proportional to family contribution (%). Dots indicate individual’s location on PCoA. (B) PCA inter-class analysis depicting the enterotype stratification of individuals from Madagascar. Each dot represents a fecal sample. (C) Bacterial genera driving the most the enterotype description. Bacterial genera were selected following a random forest classification based on enterotypes stratification. (D) Factors associated with the inter-individual variation based on the gut microbiota composition. A total of 19 factors (FDR < 0.1) including medical, demographical, dietary and protozoan carriage were associated with inter-individual variation of the gut microbiota composition. The bar plot indicates the contribution (%) of each factor at explaining the inter-individual variation observed within the faecal bacterial composition of Malagasy individuals.
Figure 2
Figure 2
Association between intestinal colonization by parasites and the gut microbiome richness and composition. (A) Microbial richness (OTU number) as function of cumulative number of different protozoans detected in an individual (ranged from 0 to > 4). (B) Relative abundance of Lactobacillus genus as function of the cumulative number of protozoans detected in an individual (ranged from 0 to > 4). (C) Cladogram representation of bacterial groups significantly increased (in red) or decreased (in green) in the presence of the four main parasitic colonizers (Entamoeba coli, Blastocystis sp., Chilomastix mesnili and Entamoeba histolytica/dispar).
Figure 3
Figure 3
Impact of dietary habits on gut microbiome composition in Malagasy volunteers. (A) Heatmap depicting the bacterial genera having an abundance modulated by daily dietary habits. Liquid consumption is expressed in litre (L), rice in gram (g), fruits in number and other dietary information as yes/no question. Red, blue and green boxes indicate whether the abundance is higher, equal or lower in individuals positive for the listed food type. ANOVA (group > 2) and Wilcoxon test (group = 2) were run all over genera count dataset according to diet. Only boxes tagged with a star are considered statistically informative. The heatmap was generated using R software (https://cran.r-project.org/) with in-house code that uses basic functions included in "stats" and "graphics" packages. It uses genera abundance (as listed in rows) and highlights, for daily consumption of liquid, rice and fruit items, the category that are the most significantly different from others. For Meat, Fish, Yogurt-HM and Yogurt-I items, the heatmap indicates genera whose abundances are increased/decreased in individuals consuming these items. (B) Proportion of individuals included in each enterotype according to food type’s consumption. (C) Bacterial load distribution among meat and fish eaters (Y) as compared to non-eaters (N). (D) Proportion of individuals eating either yogurt (Cons+) (home-made yogurt, industrial yogurt or both (I&HM)), as function of cumulative number protozoans detected in an individual.
Figure 4
Figure 4
Metabolomic specificities of the microbiome in Malagasy volunteers. Eighteen volunteers were selected according to their enterotypes affiliation (nEnt1 = 5, nEnt2 = 7, nEnt3 = 6) and analysed through metabolomic approach. (A) The inter-class analysis computed upon PCA data emphasizes the stratification of these metabolomes in three clusters, similarly to microbiome enterotypes distribution. (B) Metabolic peaks (n = 51) discriminating the Malagasy metabolomes according to enterotypes stratification. (C) Metabolic functions inferred from PICRUSt that pointed out the functional specificities associated with each enterotypes. Functions listed in the heatmap had a significantly different distribution between enterotypes (p ≤ 0.01) and were selected according to Kruskal Walis’s test followed by a post-hoc Dunn’s test assessing the intergroup (enterotypes) comparison. All tests were corrected for false discovery rate. (D) Functions differentially distributed among protozoan carrier types (0 to > 4).

References

    1. De Filippo C, Cavalieri D, Di Paola M, Ramazzotti M, Poullet JB, Massart S, Collini S, Pieraccini G, Lionetti P. Impact of diet in shaping gut microbiota revealed by a comparative study in children from Europe and rural Africa. Proc. Natl. Acad. Sci. USA. 2010;107(33):14691–14696. doi: 10.1073/pnas.1005963107. - DOI - PMC - PubMed
    1. Yatsunenko T, Rey FE, Manary MJ, Trehan I, Dominguez-Bello MG, Contreras M, Magris M, Hidalgo G, Baldassano RN, Anokhin AP, et al. Human gut microbiome viewed across age and geography. Nature. 2012;486(7402):222–227. doi: 10.1038/nature11053. - DOI - PMC - PubMed
    1. Schnorr SL, Candela M, Rampelli S, Centanni M, Consolandi C, Basaglia G, Turroni S, Biagi E, Peano C, Severgnini M, et al. Gut microbiome of the Hadza hunter-gatherers. Nat. Commun. 2014;5:3654. doi: 10.1038/ncomms4654. - DOI - PMC - PubMed
    1. Martinez I, Stegen JC, Maldonado-Gomez MX, Eren AM, Siba PM, Greenhill AR, Walter J. The gut microbiota of rural papua new guineans: Composition, diversity patterns, and ecological processes. Cell Rep. 2015;11(4):527–538. doi: 10.1016/j.celrep.2015.03.049. - DOI - PubMed
    1. Kim JJ, Khan WI. Goblet cells and mucins: Role in innate defense in enteric infections. Pathogens. 2013;2(1):55–70. doi: 10.3390/pathogens2010055. - DOI - PMC - PubMed