. 2021 Nov;27(11):2041-2047.
doi: 10.1038/s41591-021-01491-7. Epub 2021 Sep 3.

Predictors of COVID-19 epidemics in countries of the World Health Organization African Region

Affiliations

Predictors of COVID-19 epidemics in countries of the World Health Organization African Region

Feifei Zhang et al. Nat Med. 2021 Nov.

Abstract

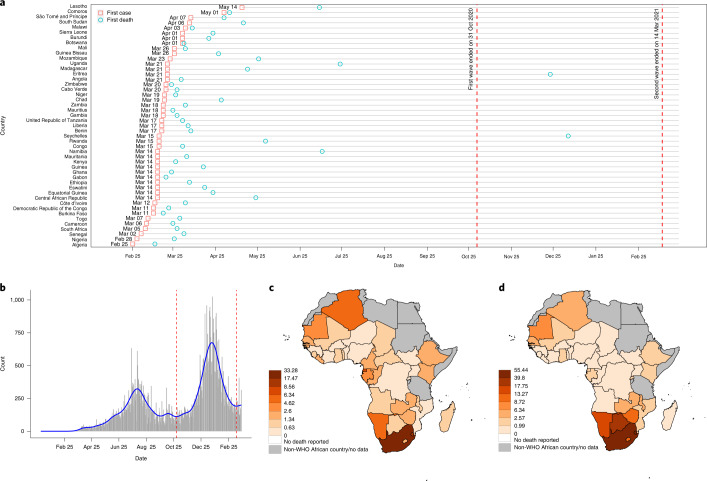
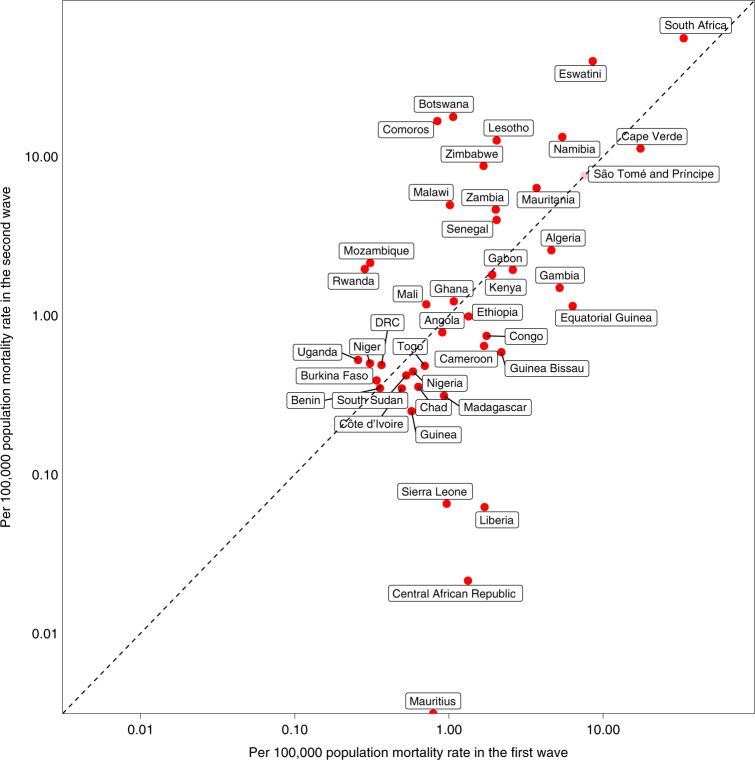
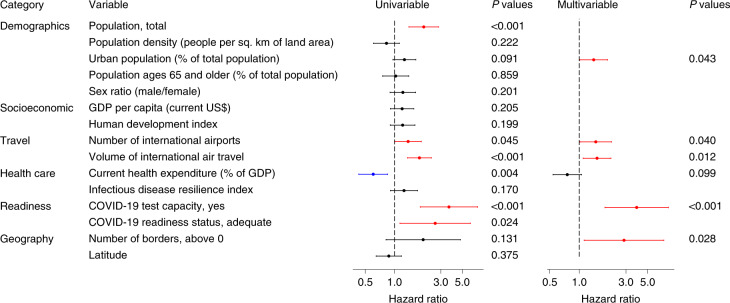
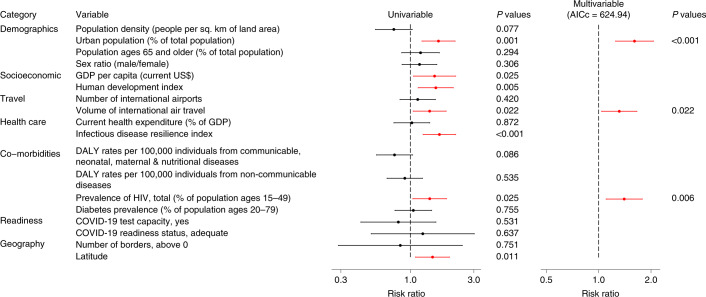
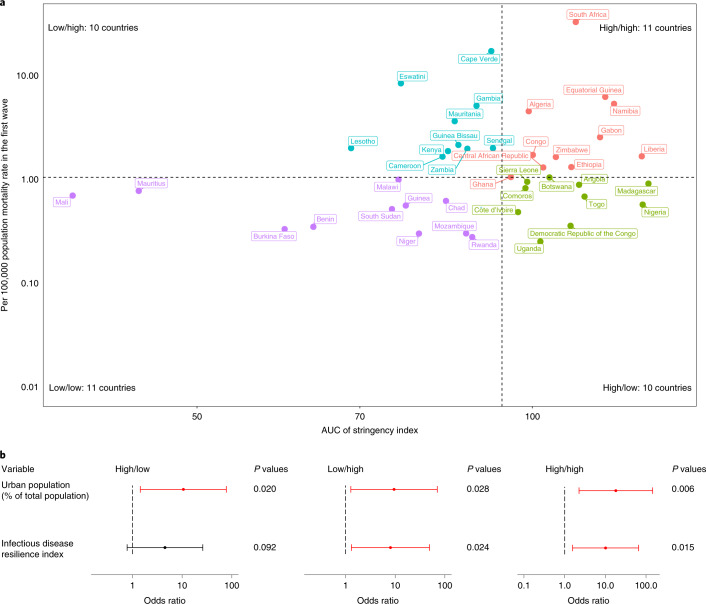
Countries of the World Health Organization (WHO) African Region have experienced a wide range of coronavirus disease 2019 (COVID-19) epidemics. This study aimed to identify predictors of the timing of the first COVID-19 case and the per capita mortality in WHO African Region countries during the first and second pandemic waves and to test for associations with the preparedness of health systems and government pandemic responses. Using a region-wide, country-based observational study, we found that the first case was detected earlier in countries with more urban populations, higher international connectivity and greater COVID-19 test capacity but later in island nations. Predictors of a high first wave per capita mortality rate included a more urban population, higher pre-pandemic international connectivity and a higher prevalence of HIV. Countries rated as better prepared and having more resilient health systems were worst affected by the disease, the imposition of restrictions or both, making any benefit of more stringent countermeasures difficult to detect. Predictors for the second wave were similar to the first. Second wave per capita mortality could be predicted from that of the first wave. The COVID-19 pandemic highlights unanticipated vulnerabilities to infectious disease in Africa that should be taken into account in future pandemic preparedness planning.


Conflict of interest statement

The authors declare no competing interests.

Figures

Fig. 1
Fig. 1. COVID-19 pandemic in the WHO African Region.
a, Timeline of the first case and first death. b, Pandemic curve for daily new deaths. Map of per capita mortality rates in the first wave (c) and in the second wave (d). Tanzania, Burundi, Eritrea and Seychelles were excluded (Methods) and are shown in gray in c and d.
Fig. 2
Fig. 2. Scatter plot of per capita mortality in the first and second waves.
Axes on log10 scale with points falling on the axes denoting zero deaths. The dashed line indicates identical levels of mortality rates in two waves. Tanzania, Burundi, Eritrea and Seychelles were not shown due to incomplete data/being outliers. Note that São Tomé and Principe was not included in mortality rate analyses due to missing predictor data. DRC, Democratic Republic of the Congo.
Fig. 3
Fig. 3. HRs and 95% CIs for predictors of timing of the first case in univariable and multivariable Cox regression model.
n = 47 countries. Error bars are shown. Statistically significant risk factors are in red; protective factors are in blue. Exact two-sided P values for the Wald test are shown for each predictor, and two-sided P values < 0.05 were considered statistically significant.
Fig. 4
Fig. 4. RRs and 95% CIs of predictors of per capita mortality in the first wave in univariable and multivariable Poisson GLMM.
n = 42 countries. Error bars are shown. Statistically significant risk factors are in red. Exact two-sided P values for the Wald test are shown for each predictor, and two-sided P values < 0.05 were considered statistically significant.
Fig. 5
Fig. 5. Associations with stringency index.
a, Scatter plot for AUC of stringency index and per capita mortality rate in the first wave. Vertical axis has log10 scale. Dashed lines indicate median values, separating countries into four categories: high/high, high/low, low/high and low/low. b, Odds ratios (ORs) and 95% CIs in multivariable multinomial logistic regression model. n = 42 countries. Error bars are shown. Statistically significant risk factors are in red. Exact two-sided P values for the Wald test are shown for each predictor, and two-sided P values < 0.05 were considered statistically significant.
Extended Data Fig. 1
Extended Data Fig. 1. Correlation matrix for predictors in the first wave.
Positive correlations are displayed in blue and negative correlations in red colour. n = 47 countries. Spearman’s rank correlation test was used. Colour intensity is proportional to the correlation coefficients.
Extended Data Fig. 2
Extended Data Fig. 2. Correlation matrix for significant predictors in multivariable model for per capita mortality in the first wave and three test variables.
Positive correlations are displayed in blue and negative correlations in red colour. n = 42 countries. Spearman’s rank correlation test was used. Colour intensity is proportional to the correlation coefficients.
Extended Data Fig. 3
Extended Data Fig. 3. Risk ratios and 95% confidence intervals of three test variables for per capita mortality in the first wave in multivariable Poisson generalized linear mixed model.
n = 42 countries. Error bars are shown. Statistically significant risk factors are in red. Exact two-sided P values for the Wald test are shown for each predictor, and two-sided P values < 0.05 were considered statistically significant.
Extended Data Fig. 4
Extended Data Fig. 4. Correlation matrix for significant predictors in multivariable model for per capita mortality in the first wave and two stringency indices.
Positive correlations are displayed in blue and negative correlations in red colour. n = 42 countries. Spearman’s rank correlation test was used. Colour intensity is proportional to the correlation coefficients.
Extended Data Fig. 5
Extended Data Fig. 5. Risk ratios and 95% confidence intervals of two stringency indices for per capita mortality in the first wave in multivariable Poisson generalized linear mixed model.
n = 42 countries. Error bars are shown. Statistically significant risk factors are in red. Exact two-sided P values for the Wald test are shown for each predictor, and two-sided P values < 0.05 were considered statistically significant.
Extended Data Fig. 6
Extended Data Fig. 6. Odds ratios and 95% confidence intervals for outcome with respect to AUC of stringency index and mortality rate in the first wave in univariable multinomial logistic regression model.
n = 42 countries. COVID-19 readiness status and number of borders were excluded from the model because there is no country with adequate COVID-19 readiness status in the reference low/low level and no country with no border in the high/high level, and putting them in the model will generate super wide 95% CIs. Wald test was used. Relative to low/low, P values for Wald test for percentage of urban population are 0.025 (high/low), 0.028 (low/high), and 0.002 (high/high), human development index is 0.020 (high/high), infectious disease resilience index are 0.037 (low/high) and 0.006 (high/high). Error bars are shown. Statistically significant risk factors are in red.
Extended Data Fig. 7
Extended Data Fig. 7. Risk ratios and 95% confidence intervals of predictors of per capita mortality in the first wave and second wave in univariable Poisson generalized linear mixed model.
n = 42 countries. Error bars are shown. Statistically significant risk factors are in red; protective factors are in blue. Exact two-sided P values for the Wald test are shown for each predictor, and two-sided P values < 0.05 were considered statistically significant. NA, not applicable. ND, not done.
Extended Data Fig. 8
Flow diagram.
Extended Data Fig. 9
Extended Data Fig. 9. Residential percent change from baseline and stringency index over time in 24 countries of the WHO African Region.
Time range is from first countermeasure implemented in each country in response to COVID-19 up to 31 October 2020. Y1 axis represents residential percent change from baseline (Jan 3 – Feb 6, 2020) in Google mobility data (in black). Y2 axis represents stringency index calculated from government response data collected by the TIBA Pandemic Response Unit (in red, see Methods).

References

    1. World Health Organization. Weekly epidemiological update on COVID-19. https://www.who.int/emergencies/diseases/novel-coronavirus-2019/situatio... (2021).
    1. Hsiang S, et al. The effect of large-scale anti-contagion policies on the COVID-19 pandemic. Nature. 2020;584:262–267. doi: 10.1038/s41586-020-2404-8. - DOI - PubMed
    1. Salyer SJ, et al. The first and second waves of the COVID-19 pandemic in Africa: a cross-sectional study. Lancet. 2021;397:1265–1275. doi: 10.1016/S0140-6736(21)00632-2. - DOI - PMC - PubMed
    1. Zheng Z, et al. Risk factors of critical & mortal COVID-19 cases: a systematic literature review and meta-analysis. J. Infect. 2020;81:e16–e25. doi: 10.1016/j.jinf.2020.04.021. - DOI - PMC - PubMed
    1. Ji Y, Ma Z, Peppelenbosch MP, Pan Q. Potential association between COVID-19 mortality and health-care resource availability. Lancet Glob. Health. 2020;8:e480. doi: 10.1016/S2214-109X(20)30068-1. - DOI - PMC - PubMed

Publication types