Review
. 2021 Oct;16(10):4855-4877.
doi: 10.1038/s41596-021-00599-x. Epub 2021 Sep 3.

Mass cytometry profiling of human dendritic cells in blood and tissues

Affiliations
Review

Mass cytometry profiling of human dendritic cells in blood and tissues

Marcela Alcántara-Hernández et al. Nat Protoc. 2021 Oct.

Abstract

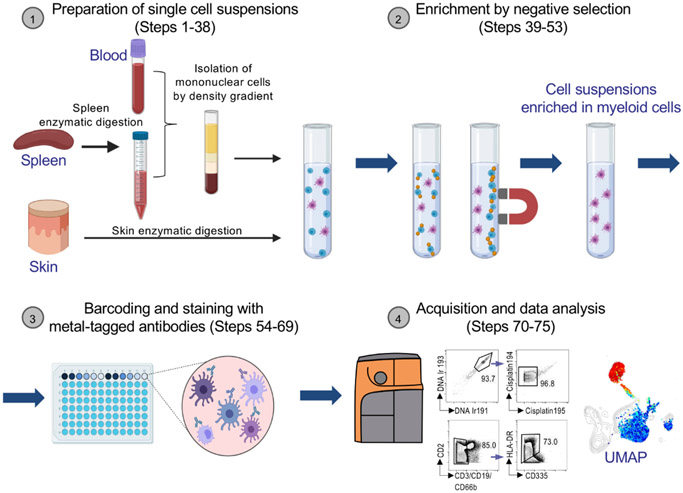
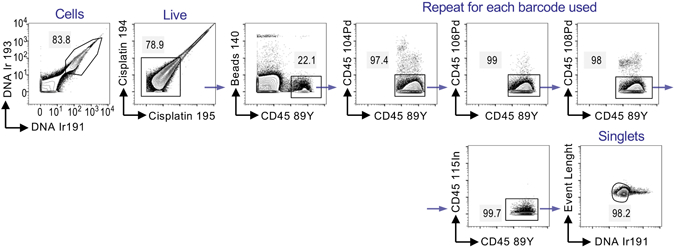
The immune system comprises distinct functionally specialized cell populations, which can be characterized in depth by mass cytometry protein profiling. Unfortunately, the low-throughput nature of mass cytometry has made it challenging to analyze minor cell populations. This is the case for dendritic cells, which represent 0.2-2% of all immune cells in tissues and yet perform the critical task of initiating and modulating immune responses. Here, we provide an optimized step-by-step protocol for the characterization of well-known and emerging human dendritic cell populations in blood and tissues using mass cytometry. We provide detailed instructions for the generation of single-cell suspensions, sample enrichment, staining, acquisition and data analysis. We also include a barcoding option that reduces acquisition variability and allows the analysis of low numbers of dendritic cells, i.e., ~20,000. In contrast to other protocols, we emphasize the use of negative selection approaches to enrich for minor populations of immune cells while avoiding their activation. The entire procedure can be completed in 2-3 d and can be conveniently paused at several stages. The procedure described in this robust and reliable protocol allows the analysis of human dendritic cells in health and disease and during vaccination.


Figures

Extended Data Figure 1.
Extended Data Figure 1.. Frequencies of leukocytes in blood and skin samples before and after enrichment.
PBMC (a) were obtained from blood (Steps 1-10). Skin cell suspensions (b) were obtained after enzymatic digestion (Steps 23-37). Myeloid cells or leukocytes were negatively enriched from blood and skin, respectively, following the procedures described in Steps 45-53. Cells were stained for flow cytometry before and after negative enrichment. One representative blood and skin sample is shown. Numbers represent frequency in the gate. Antibodies used are as follow: CD45 Brilliant Violet 785 (Biolegend, Cat# 304049), CD3 PerCPCy5.5 (Biolegend, Cat# 300430), CD19 PerCPCy5.5 (Biolegend, Cat# 302230), CD335 PerCPCy5.5 (Biolegend, Cat# 331920), CD66b PerCPCy5.5 (Biolegend, Cat# 305108). Figure created for this protocol from data obtained as part of a primary publication.
Figure 1:
Figure 1:. Schematic representation of the experimental procedures described in this protocol.
(1) Single cell suspension is obtained from human spleen and skin by mechanical and enzymatic digestion. Mononuclear cells are enriched from human spleen and blood using a density gradient (Steps 1-38). (2) Blood, spleen and skin cell suspensions are negatively enriched in myeloid cells using magnetic beads (Steps 39-53). (3) Samples are barcoded using anti-hCD45 antibodies and stained with a cocktail of metal-tagged antibodies against surface and intracellular markers (Steps 54-69). (4) Samples are acquired using a mass cytometer, data is de-barcoded, analyzed and visualized using Uniform Manifold Approximation and Projection (UMAP) in FlowJo (Steps 70-75). Created with BioRender.com.
Figure 2.
Figure 2.. Enrichment of myeloid cells using negative selection.
a) The percentage of immune cells subsets in spleen and PBMC was quantified before and after negative selection. The fraction corresponding to “other cells” includes NK, ILCs, basophils and precursors. Numbers represent the average percentage from n=3 samples for each tissue. b) Skin CD45+ leukocytes were quantified before and after negative selection. Numbers represent the average percentage from n=7 skin samples. Figure created for this protocol from data obtained as part of a primary publication.
Figure 3.
Figure 3.. Gating of cells to de-barcode.
Blood cells were stained using the barcoding antibodies against hCD45 outlined in Table 3. Samples were acquired in a CyTOF 2. Events corresponding to cells were gated on DNA Ir191 and Ir193 to eliminate debris, followed by removal of dead cells using cisplatin. Gating of one barcode (CD45 Y89) is shown as an example, but this strategy should be repeated for each barcode used in the experiment. First, remove normalization beads and gate on CD45 Y89 positive cells. Second, clean the sample by gating on CD45 Y89 positive cells and excluding cells positive for the other barcodes (CD45-conjugated with Pd104, Pd106, Pd108 and In115). Finally, event length is used to eliminate potential doublets. The singlets gate contains all the events for the barcode CD45 Y89 and should be exported for further analysis (Figure 5). Numbers represent percentage of events in the gate. Figure created for this protocol from data obtained as part of a primary publication.
Figure 4.
Figure 4.. Gating of sorted DCs pooled with mouse filler splenocytes.
20,000 pDCs were sorted from blood by FACS and cultured for 2 days with IL-3 (see ref. 18). Recovered cells were pooled with 2 x 10⁶ freshly isolated mouse splenocytes. Cell pellet was stained with the antibody panel depicted in Table 1, plus anti-mCD45-Y89 and anti-hCD45-ln115 antibodies (Table 3). Samples were acquired in a CyTOF 2. Cell events were gated on DNA Ir191 and Ir193 to eliminate debris, followed by live cisplatin cells. Mouse splenocytes used as “filler cells” were discarded and human DCs were selected using hCD45-In115 vs mCD45-Y89 gating. Singlets were then selected using Event Length vs DNA Ir191, followed by elimination of normalization beads. Human sorted pDCs were gated as HLA-DR+ and CD123+. Numbers represent percentage of events in the gate. Figure created for this protocol from data obtained as part of a primary publication.
Figure 5.
Figure 5.. Gating of DCs for unbiased analysis.
Cell suspensions from blood, spleen and skin were enriched, stained and acquired in a CyTOF 2. CD45+ events were gated following the strategy of Figure 3. Antibodies for non-myeloid lineages (T cells [CD3], B cells [CD19] and neutrophils [CD66b]) were all conjugated with the same metal, i.e., Dy163 (Table1), and cells positive for these markers were removed during the analysis. a) After elimination of Lineage+ cells, CD335+ NK cells were discarded, followed by the removal of events corresponding to monocytes using either CD11b and CD16 (OPTION A), or CD88 and CD89 (OPTION B). Finally, HLA-DRhigh cells were gated to eliminate other non-DC expressing HLA-DRlow such as ILC, basophils and precursors. HLA-DR vs CD123 was plotted to visualize HLA-DR expression in pDCs, which is generally lower than in other DC subsets. b) After removing Lineage+ cells, HLA-DRhigh events are selected. This gate contains DCs, monocytes and macrophages. Numbers represent percentage of events in the gate. Showing one representative run of n = 3 for blood and spleen, and n = 7 for skin. Figure created for this protocol from data obtained as part of a primary publication and minimal new supporting data, i.e., validation of previous staining using new CD88/CD89 antibodies.
Figure 6.
Figure 6.. Anticipated results for the analysis of DCs from blood, spleen and skin.
One representative blood sample was gated as described in Figure 5. A UMAP map was plotted using 5,000 events from two gating strategies: OPTION A and OPTION B in Figure 5. a) Contour map with DC subsets delineated. b) UMAP showing events corresponding to OPTION A or OPTION B gating strategies, in which similar results can be observed. c) Expression of selected markers of emerging DC subsets (tDCs [AXL], DC2s [CD5] and DC3s [CD14]) is shown. d) Blood, spleen and skin (n=2 samples for each tissue) were enriched and stained following the workflow presented here. Samples were acquired in a CyTOF 2. UMAP plot with 20,000 events from each tissue. Left graph shows a contour UMAP map from all tissues with DC subsets delineated. Right panels are separated by tissue and colored on the expression of the corresponding protein. pDC= plasmacytoid DC, cDC = classical DC, tDC = transitional DC, LC= Langerhans cells, Macro= Macrophages, prog = progenitor. Numbers in scale bar represent expression levels. Figure created for this protocol from data obtained as part of a primary publication and minimal new supporting data, i.e., validation of previous staining using new CD88/CD89 antibodies.

Similar articles

Cited by

References

    1. Steinman RM & Idoyaga J Features of the dendritic cell lineage. Immunol Rev 234, 5–17 (2010). - PubMed
    1. Lewis KL & Reizis B Dendritic cells: arbiters of immunity and immunological tolerance. Cold Spring Harb Perspect Biol 4, a007401 (2012). - PMC - PubMed
    1. Iwasaki A & Medzhitov R Control of adaptive immunity by the innate immune system. Nat Immunol 16, 343–353 (2015). - PMC - PubMed
    1. Böttcher JP & Reis e Sousa C The Role of Type 1 Conventional Dendritic Cells in Cancer Immunity. Trends Cancer 4, 784–792 (2018). - PMC - PubMed
    1. Alcántara-Hernández M et al. High-Dimensional Phenotypic Mapping of Human Dendritic Cells Reveals Interindividual Variation and Tissue Specialization. Immunity 47, 1037–1050.e6 (2017). - PMC - PubMed

Publication types