. 2021 Oct;18(10):2344-2357.
doi: 10.1038/s41423-021-00760-2. Epub 2021 Sep 3.

Construction of a sustainable 3-hydroxybutyrate-producing probiotic Escherichia coli for treatment of colitis

Affiliations

Construction of a sustainable 3-hydroxybutyrate-producing probiotic Escherichia coli for treatment of colitis

Xu Yan et al. Cell Mol Immunol. 2021 Oct.

Abstract

Colitis is a common disease of the colon that is very difficult to treat. Probiotic bacteria could be an effective treatment. The probiotic Escherichia coli Nissle 1917 (EcN) was engineered to synthesize the ketone body (R)-3-hydroxybutyrate (3HB) for sustainable production in the gut lumen of mice suffering from colitis. Components of heterologous 3HB synthesis routes were constructed, expressed, optimized, and inserted into the EcN genome, combined with deletions in competitive branch pathways. The genome-engineered EcN produced the highest 3HB level of 0.6 g/L under microaerobic conditions. The live therapeutic was found to colonize the mouse gastrointestinal tract over 14 days, elevating gut 3HB and short-chain-length fatty acid (SCFA) levels 8.7- and 3.1-fold compared to those of wild-type EcN, respectively. The sustainable presence of 3HB in mouse guts promoted the growth of probiotic bacteria, especially Akkermansia spp., to over 31% from the initial 2% of all the microbiome. As a result, the engineered EcN termed EcNL4 ameliorated colitis induced via dextran sulfate sodium (DSS) in mice. Compared to wild-type EcN or oral administration of 3HB, oral EcNL4 uptake demonstrated better effects on mouse weights, colon lengths, occult blood levels, gut tissue myeloperoxidase activity and proinflammatory cytokine concentrations. Thus, a promising live bacterium was developed to improve colonic microenvironments and further treat colitis. This proof-of-concept design can be employed to treat other diseases of the colon.

Keywords: 3HB; Colitis; Colonic microenvironment; Escherichia coli Nissle 1917; Metabolic engineering; Microbiomes; Probiotics; Synthetic biology; β-hydroxybutyrate.


Conflict of interest statement

The authors declare no competing interests.

Figures
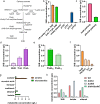
Fig. 1
Fig. 1
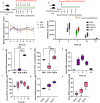
Metabolic engineering of E. coli Nissle 1917 for 3HB overproduction. a Biosynthesis pathway for 3HB production utilizing glucose and acetyl-CoA as the substrate. Three enzymes, e.g., acetyl-CoA acetyltransferase, 3HB-CoA dehydrogenase, and thioesterase, were employed. Two intrinsic branch pathways are also indicated in the illustration. b Determination of the EcN characteristics for 3HB degradation and biosynthesis. LB media + 5 g/L 3HB was germfree medium supplemented with 5 g/L 3HB. The blank plasmid group was the EcN strain transformed with the pNZ8148 plasmid. The pYX5, pYX7, pYX18, and pYX19 groups consisted of EcN strains transformed with the appropriate plasmids. The Y-axis shows the residual 3HB concentration in media after fermentation. c The 3HB production under microaerobic conditions via different pathways. The groups with EcN overexpressing pathways introduced with corresponding plasmids. d The 3HB yields from various acetyl-CoA acetyltransferases. e The 3HB yields from various 3HB-CoA dehydrogenases. PhaBCn, PhaB from Cupriavidus necator H16; PhaBTD, PhaB from Halomonas bluephagenesis TD01. f The 3HB yields from various thioesterases. g Byproduct concentrations in 3HB fermentation processes under aerobic or microaerobic environments. The pYX50 plasmid was introduced for 3HB production. The monitored metabolites are listed on the Y-axis. h The 3HB, ethanol and lactate production levels under different EcN chassis. The pYX50 plasmid was transformed for 3HB production. Bacteria were grown in LB medium supplemented with 10 g/L glucose. All aerobic fermentation data were acquired after 48 h of cultivation at 200 rpm at 37 °C. Microaerobic fermentation results were obtained at 37 °C without shaking. All data are the mean value of 3 biologically independent experiments, and error bars represent standard deviations
Fig. 2
Fig. 2
Genomic engineering to enhance 3HB production. a Schematic illustration of genome engineering in the EcN strains. The 3HB biosynthesis pathway is shown in the figure. The adhE or ldhA gene was knocked out. The 3HB biosynthesis route was integrated into different genomic sites. The 3HB molecules are presented as purple triangles. b Production of 3HB via different genome insertion strategies. EcNW strains were wild-type EcN integrated with the 3HB pathway. EcNL strains had EcNΔldhA inserted with the pathway. Group 1 had PhaBTD in the biosynthesis route. Group 2 had PhaBCn in the biosynthesis route. c The 3HB yields increased via promoter optimizations. EcNL3 was integrated with a promoterless 3HB biosynthesis pathway. EcNL4, EcNL5, and EcNL6 were inserted with the pathway driven by the pfnrS, J23119, and J23110 promoters. d The production of 3HB with different genomic integration sites. The biosynthesis route was integrated into the malEK, rhtCB and yicS/nepI sites for the EcNL4, EcNL7, and EcNL8 strains, respectively. e Determination of the 3HB yields in the EcN strains containing inserted selection markers. EcNL9 and EcNL10 were EcNL4 strains integrated with the ampR gene and sfGFP gene. Cells were grown in LB medium with 10 g/L glucose. Microaerobic fermentation results were acquired at 37 °C without shaking. All data represent the mean of 3 biologically independent parallel samples, and error bars indicate standard deviations
Fig. 3
Fig. 3
In vivo pharmacokinetics of recombinant EcNL4 in mice. a Blood 3HB dynamics after oral administration of the EcNL4 strain. Cells were administered at 5 × 1010 per mouse. The mouse type, numbers, gavage, and quantification frequencies are indicated in the figure. b Engineered EcN gut colonization dynamics after cell administration. EcNL9 was an EcNL4 strain with an ampicillin resistance gene. The EcNW3 strain was EcNW2 with an ampicillin resistance gene. Cells were administered at 5 × 1010 per mouse. The mouse type, numbers, gavage, and detection frequencies are indicated in the figure. c Fecal 3HB concentrations after administration. Feces were sampled on the 3rd day after gavaging. d Fecal SCFA contents after the administration. Feces were sampled on the 3rd day after gavaging. SCFA titers were calculated by accumulating formate, acetate, propionate, butyrate and valerate concentrations. e The 3HB dynamics 14 days after EcNL4 administration. f The SCFA dynamics 14 days after EcNL4 administration. The SCFA titers were calculated by accumulating formate, acetate, propionate, butyrate and valerate concentrations. g The effects of cell amount on 3HB production. Feces were sampled on the 3rd day after gavaging. h The effects of cell amount on SCFA production. Feces were sampled on the 3rd day after gavaging. The SCFA titers were calculated by accumulating formate, acetate, propionate, butyrate and valerate concentrations. All data represent the mean value of 6 biologically independent samples except in a. Data in a were from 4 biologically independent samples. Error bars indicated standard deviations. Two-tailed Student’s t tests were conducted to suggest statistical significance for comparisons. **p < 0.01. ***p < 0.001
Fig. 4
Fig. 4
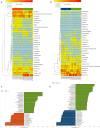
Gut microbiomes changed after EcNL4 administration in mice. a General gut microbiota genus differences between EcN and EcNL4 administration. b General gut microbiota genus differences between PBS and EcNL4 administration. Feces were collected 3 days after bacterial gavage. Data are presented in the heatmap. The color gradient represents the relative abundances in the samples. Vertical clustering indicates the similarity of all species between different samples. c LEfSe difference analysis between the EcN and EcNL4 groups. d LEfSe difference analysis between the PBS and EcNL4 groups. The figures represent the linear discriminant analysis (LDA) scores that suggested microorganisms with significant impacts on the differences of groups in microflora. The threshold was 2 in LDA analysis
Fig. 5
Fig. 5
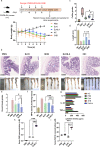
EcNL4 ameliorated colitis better than wild-type EcN in mouse models. a Body weight dynamics of the mice with colitis. The illustration above shows the mouse type, numbers, gavage, and model construction strategies. Mouse body weights were monitored every day. Feces were collected 3 days after administration. The NC group was normal mice gavaged with PBS. Statistical analysis was conducted between the EcNL4 group and the heaviest group (EcN group). b Physiological and histological results of the mice with colitis. The upper figure shows H&E staining of colon slices. The lower figure illustrates the colon length of the mice. c, d The figures show the statistical index results of the figures mentioned in b. e Occult blood level in mouse feces. f Mouse colon tissue MPO activities. g Blood cytokine levels. IL-6, IL-1β, and TNF-α levels were determined in the groups. h Fecal 3HB concentrations in the DSS-treated mice. i Gut SCFA concentrations in the DSS-treated mice. SCFA titers were calculated by accumulating formate, acetate, propionate, butyrate and valerate concentrations. All data represent the mean value of 5 biologically independent samples. Error bars indicate standard deviations. Two-tailed Student’s t tests were performed to determine statistical significance for comparisons. *p < 0.05, **p < 0.01. ***p < 0.001
Fig. 6
Fig. 6
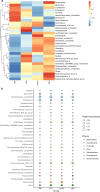
Gut microbiome changes after administration of bacteria in mice with colitis. a Gut microbiota differences at the genus level in the mice with colitis. Feces were collected 3 days after bacterial gavage. Data are presented in the heatmap. The color gradient represents the relative abundances in samples. Vertical clustering indicates the similarity of all species between different samples. b The relative abundance of different genera in the groups of mice with colitis. Data are exhibited in the bubble map format. The size of the bubbles represents the relative abundance of the corresponding genus. The different colors in the bubble indicate the phylum annotations of specific genera
Fig. 7
Fig. 7
Schematic illustration of the EcNL4 therapeutic. Briefly, EcNL4 was orally administered, colonized the colitis sites, ameliorated colitis by upregulating SCFA concentrations, decreasing inflammation and enriching probiotics such as Akkermansia spp. Figure captions are exhibited above the figure

References

    1. Kurtz CB, Millet YA, Puurunen MK, Perreault M, Charbonneau MR, Isabella VM, et al. An engineered E. coli Nissle improves hyperammonemia and survival in mice and shows dose-dependent exposure in healthy humans. Sci Transl Med. 2019;11:475. doi: 10.1126/scitranslmed.aau7975. - DOI - PubMed
    1. Aggarwal N, Breedon AME, Davis CM, Hwang IY, Chang MW. Engineering probiotics for therapeutic applications: recent examples and translational outlook. Curr Opin Biotech. 2020;65:171–9. doi: 10.1016/j.copbio.2020.02.016. - DOI - PubMed
    1. Pedrolli DB, Ribeiro NV, Squizato PN, de Jesus VN, Cozetto DA, Team AQA Unesp at iGEM. Engineering microbial living therapeutics: the synthetic biology toolbox. Trends Biotechnol. 2019;37:100–15. doi: 10.1016/j.tibtech.2018.09.005. - DOI - PubMed
    1. Cao Z, Cheng S, Wang X, Pang Y, Liu J. Camouflaging bacteria by wrapping with cell membranes. Nat Commun. 2019;10:1–10. doi: 10.1038/s41467-018-07882-8. - DOI - PMC - PubMed
    1. Bai L, Gao M, Cheng X, Kang G, Cao X, Huang H. Engineered butyrate-producing bacteria prevents high fat diet-induced obesity in mice. Microb Cell Fact. 2020;19:1–13. doi: 10.1186/s12934-019-1269-8. - DOI - PMC - PubMed

Publication types

Substances