. 2021 Sep;18(9):1046-1055.
doi: 10.1038/s41592-021-01248-7. Epub 2021 Sep 3.

Systematic evaluation of chromosome conformation capture assays

Affiliations

Systematic evaluation of chromosome conformation capture assays

Betul Akgol Oksuz et al. Nat Methods. 2021 Sep.

Abstract

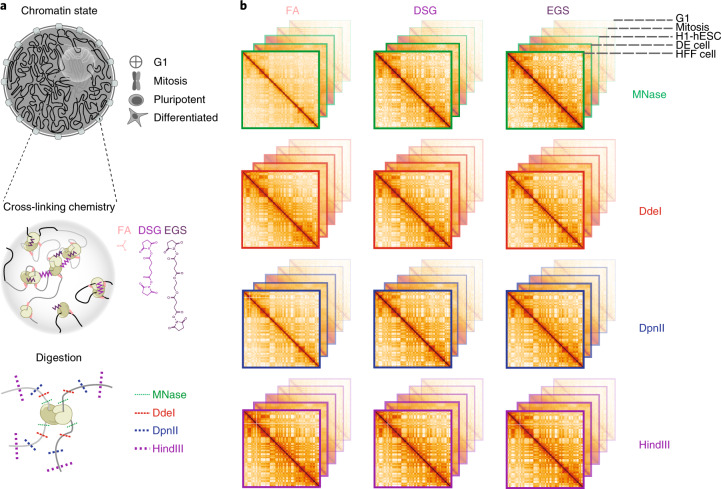
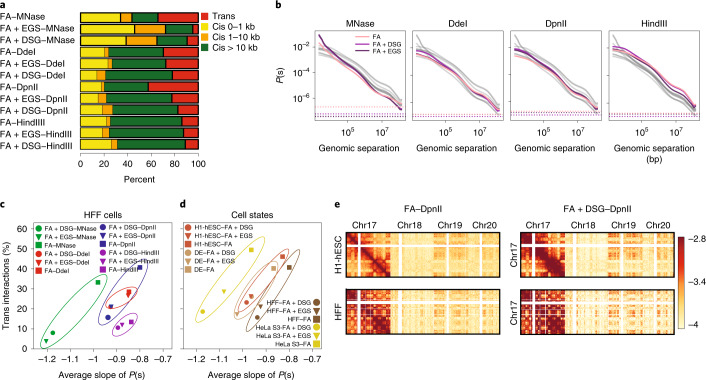
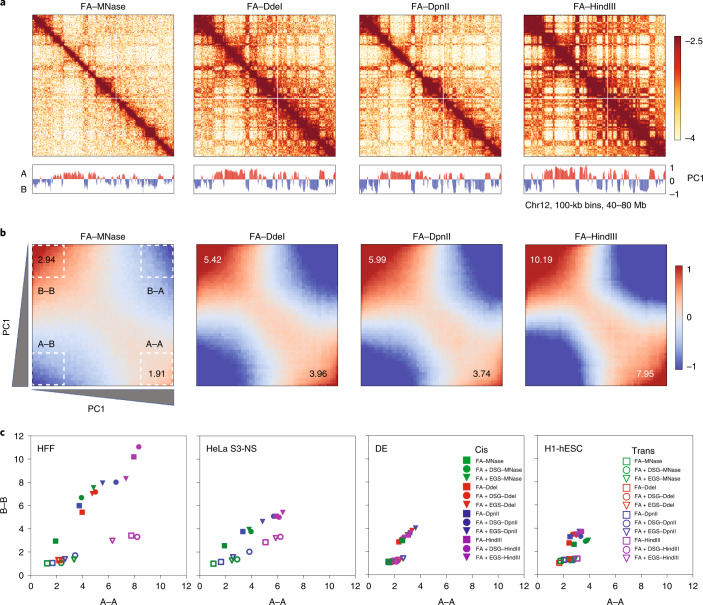
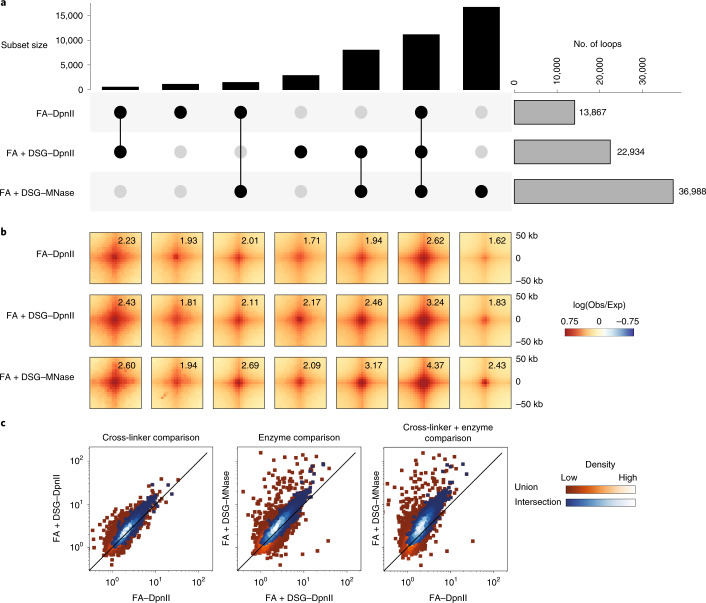
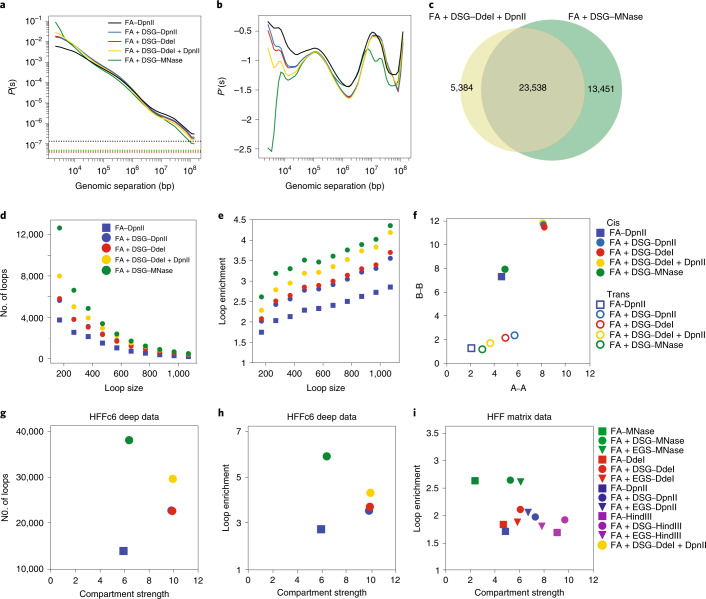
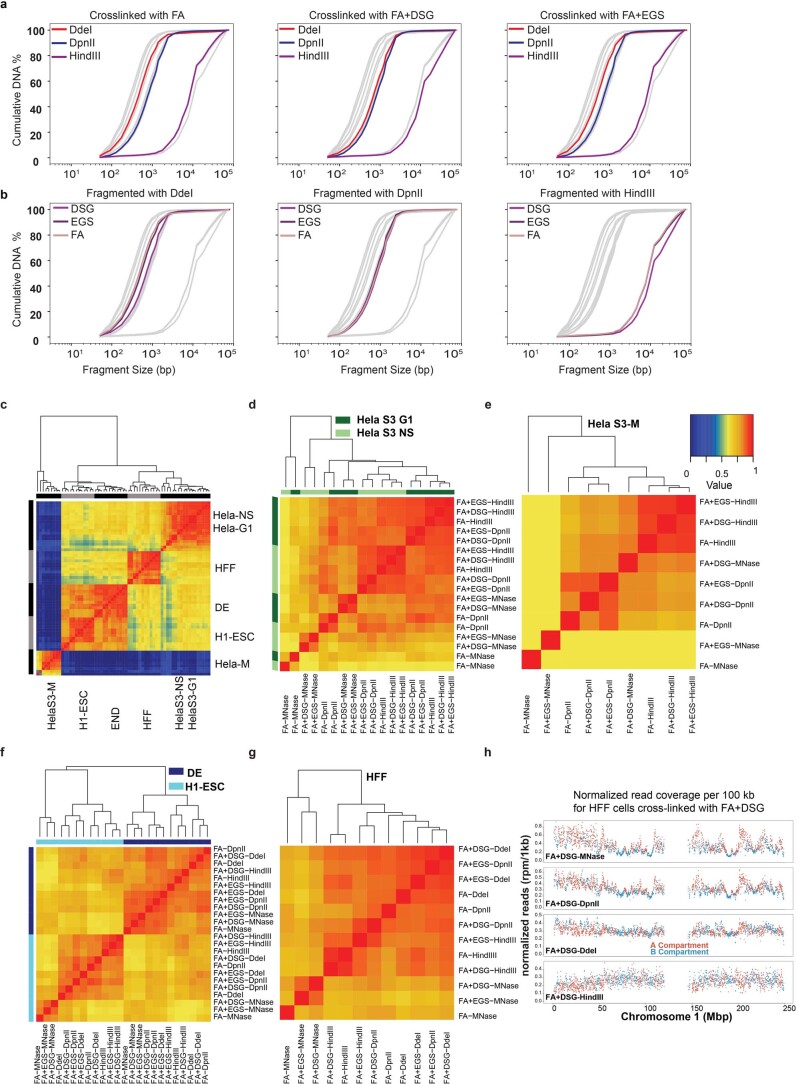
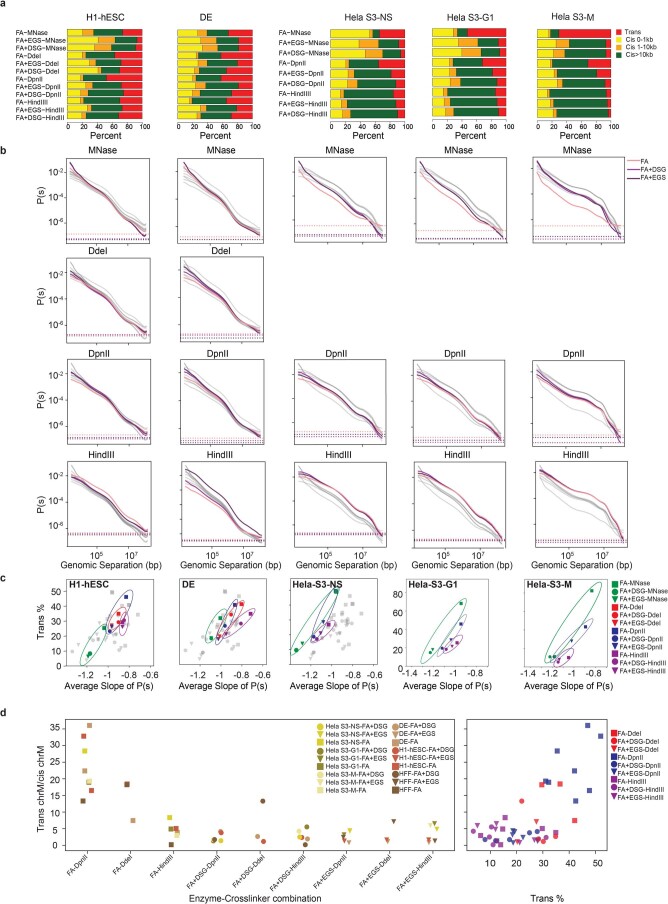
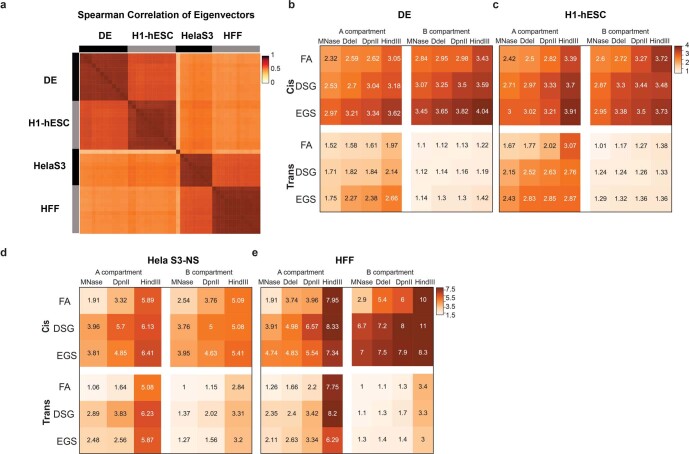
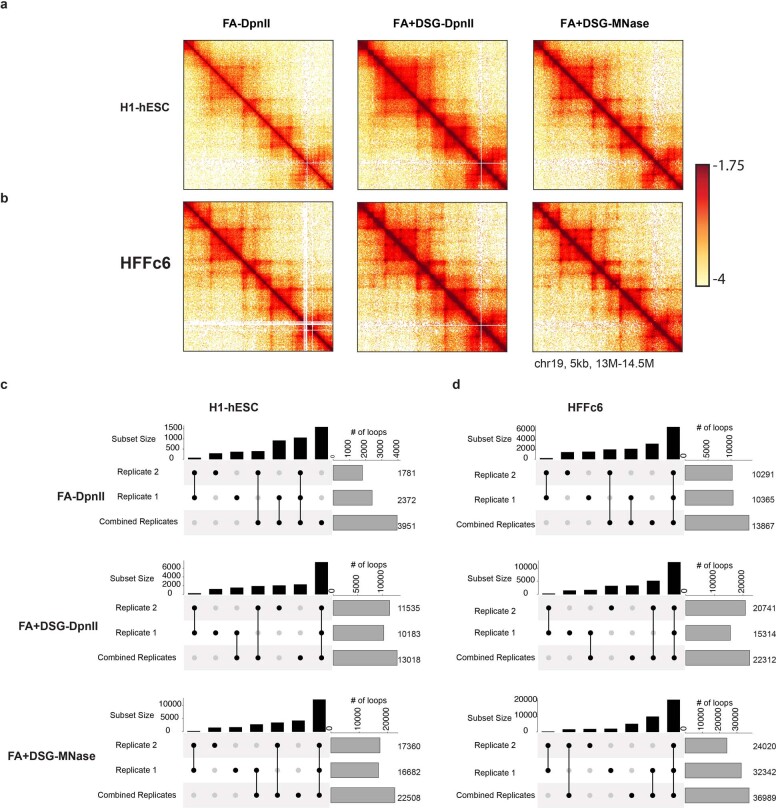
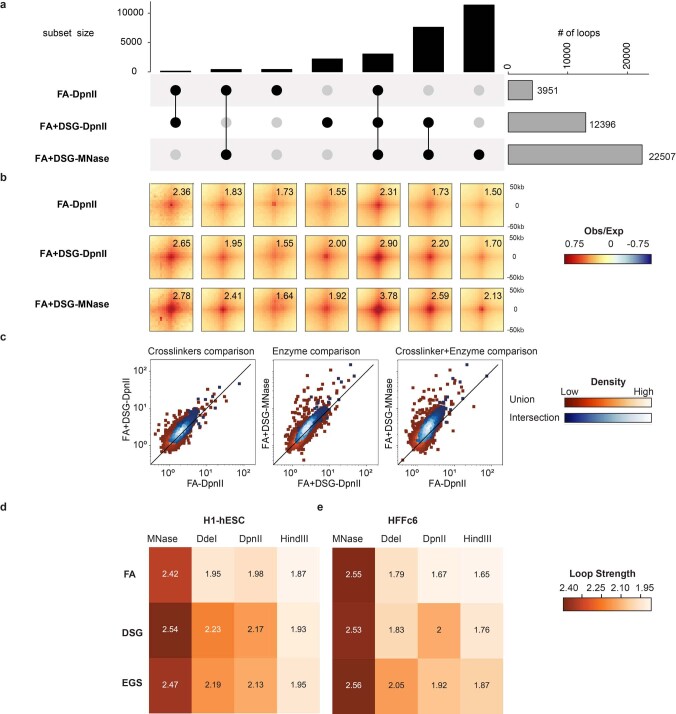
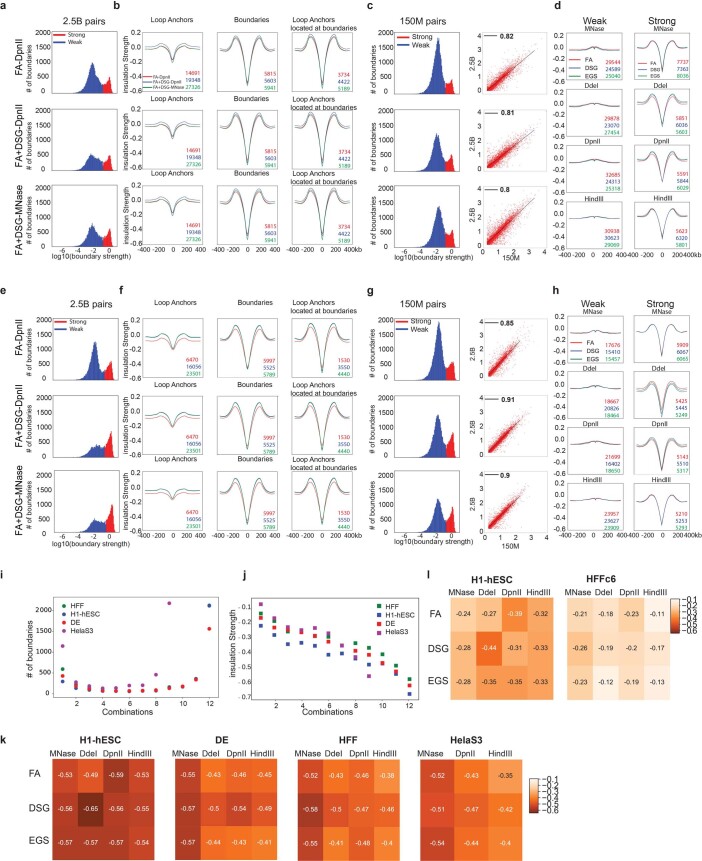
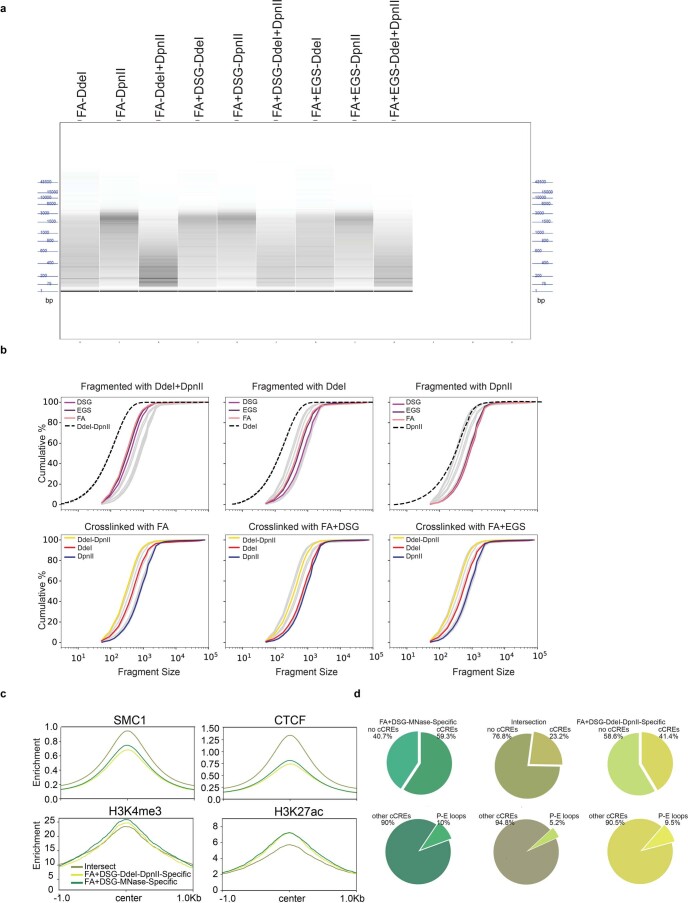
Chromosome conformation capture (3C) assays are used to map chromatin interactions genome-wide. Chromatin interaction maps provide insights into the spatial organization of chromosomes and the mechanisms by which they fold. Hi-C and Micro-C are widely used 3C protocols that differ in key experimental parameters including cross-linking chemistry and chromatin fragmentation strategy. To understand how the choice of experimental protocol determines the ability to detect and quantify aspects of chromosome folding we have performed a systematic evaluation of 3C experimental parameters. We identified optimal protocol variants for either loop or compartment detection, optimizing fragment size and cross-linking chemistry. We used this knowledge to develop a greatly improved Hi-C protocol (Hi-C 3.0) that can detect both loops and compartments relatively effectively. In addition to providing benchmarked protocols, this work produced ultra-deep chromatin interaction maps using Micro-C, conventional Hi-C and Hi-C 3.0 for key cell lines used by the 4D Nucleome project.


Conflict of interest statement

The authors declare no competing interests.

Figures

Fig. 1
Fig. 1. Outline of the experimental design.
a, Experimental design for conformation capture for various cells, cross-linkers and enzymes. b, Representation of interaction maps from experiments in a.
Fig. 2
Fig. 2. Extra cross-linking yields more intra-chromosomal contacts.
a, The number of valid pairs in each of the 12 HFF protocols by genomic distance. b, Distance-dependent contact probability for the 12 HFF protocols. Each plot shows P(s) for experiments performed with the indicated nuclease. The colored lines indicate the cross-linkers and the gray lines indicate all datasets. The dashed lines show the level of the trans interactions. c, The percentage of trans interactions versus the average slope of distance-dependent contact probability for all cross-linker and enzyme combinations in HFF. Nucleases are grouped by colored ovals. d, Percentage of trans interactions versus the average slope of distance-dependent contact probability for each cell state. Only experiments cross-linked with FA, FA + DSG or FA + EGS and digested with DpnII are shown. e, Interactions (log transformed) between chromosome (chr) 17 and chromosomes 17, 18, 19 and 20 for FA or FA + DSG cross-linking and DpnII digestion, in H1-hESC and HFF cells. Total trans interactions for FA–DpnII protocols in H1-hESCs, 47.7%; HFF cells, 42.5%; and for FA + DSG–DpnII protocols in H1-hESCs, 25%; and HFF cells, 17.3%. Source data
Fig. 3
Fig. 3. Fragment size and cross-linking affect compartment strength.
a, Interactions (log transformed) for HFF cells obtained after cross-linking with FA only and digestion with MNase, DdeI, DpnII and HindIII, respectively. Principal component 1 (PC1) values of the genomic region are displayed below the figure. b, Saddle plots of genome-wide interaction maps for data shown in a. The signal of A–A and B–B compartmentalization in cis interactions become stronger with increasing fragment size. c, Quantification of the compartment strength using saddle plots of cis and trans interactions for 12 protocols applied to HFF cells, 9 protocols to non-synchronized HeLa-S3 (HeLa-S3 NS) NS, 12 protocols to DE cells, and 12 protocols to H1-hESCs. The y axis represents the strongest 20% of B–B interactions and the x axis represents the strongest 20% of A–A interactions, normalized by the bottom 20% of A–B interactions; that is, y = top(B–B)/bottom(A–B) and x = top(A–A)/bottom(A–B). Source data
Fig. 4
Fig. 4. Fragment size and cross-linking determine loop detection.
a, ‘Upset’ plot of loops detected in protocols using HFFc6 cells showing the total number of loops detected in the FA–DpnII, FA + DSG–DpnII and FA + DSG–MNase protocols on the right side (gray bars), and the number of loops detected in one, two or three of these protocols (shown in black bars). Loops found with one or multiple protocols are connected with black dots. b, Pileups of the loops shown in a. Numbers in each pileup represent signal enrichment at the loop compared with local background (Methods). c, Scatter plots for the strength of individual loops calculated in the same way as in b between protocol pairs in HFFc6 cells. The plots display two sets of looping interactions: the union sets (red squares) and the intersection sets (blue circles) from the three protocols. The color scale represents the density of loop interactions. Source data
Fig. 5
Fig. 5. Characterization of interactions and chromatin features of loop anchors.
a, The number of loops versus the number of loop anchors in HFFc6 cells, and the expected relationship between anchors engaged in one loop: y = 2x. b,c, Subtraction of FA–DpnII loops from FA + DSG–DpnII loops (b) or from FA + DSG–MNase loops (c) detected at the same anchors. Union loops of the plotted protocols were used. d, Chromatin interaction maps (linear scale) flanked by tracks for ATAC-seq and CUT&RUN or CUT&Tag signals for CTCF, SMC1, H3K4me3 and H3K27ac. Squares in the interaction maps indicate loop anchors detected with all three protocols (cyan squares) or only with the FA + DSG–MNase protocol (black squares). e, CTCF, SMC1, H3K4me3 and H3K27ac enrichments at loop anchors detected by all protocols (intersection) or by FA + DSG–MNase alone in HFFc6 cells. Open chromatin regions within anchor coordinates were used to center average enrichments. f, cCREs detected in common and in FA + DSG–MNase-specific loop anchors in e (top) and stratified percentage of promoter–enhancer (P–E) cCREs without CTCF enrichment (bottom). g, Enrichment of CTCF, SMC1, H3K4me3 and H3K27ac at the left (anchor 1) and the right (anchor 2) anchors, for anchors detected in HFFc6 cells using FA–DpnII, FA + DSG–DpnII or FA + DSG–MNase. Source data
Fig. 6
Fig. 6. Hi-C 3.0 detects both compartments and loops.
a, Distance-dependent contact probability of interactions detected with five protocols in HFFc6 cells (mean of trans interactions is shown in dashed lines). b, Derivative of the P(s) plots from a. c, Overlapping loops between FA + DSG–DdeI + DpnII and FA + DSG–MNase. d, Number of loops detected in 100-kb intervals (loop size) starting at 70 kb. e, Loop enrichment of 1,000 loops sampled from 100-kb intervals in d. When less than 1,000 loops were available, loop strengths for available loops were used. f, A–A and B–B compartment strengths in cis and in trans derived from saddle plot analysis. g, Number of loops and compartment strength for five protocols applied to HFFc6 cells. h, Compartment strength compared with loop enrichment for 10,000 loops sampled from HFFc6 cells (2,000 loops were sampled from each protocol). i, Compartment strength for 12 protocols described in Fig. 1a is compared to loop enrichment of these protocols using 10,000 sampled loops (in h) using data from the same 12 protocols. Source data
Extended Data Fig. 1
Extended Data Fig. 1. DNA fragmentation and clustering of correlation (HiCRep).
a,b. Cumulative distribution of the lengths of fragmented DNA obtained from fragment analyzer data in HFF cells stratified for different cross-linkers (a) and restriction enzymes (b). Gray lines indicate all datasets, colored lines indicate data obtained with the indicated nuclease/cross-linkers. c-g. Hierarchical clustering of HiCRep correlations for: all protocols comparing cell states (c), synchronized HeLa-S3 G1 cells (dark green) and non-synchronized HeLa-S3 cells (light green) (d), synchronized HeLa-S3 mitotic cells (e), H1-hESC and H1-hESC derived DE cells (f), 12 protocols applied to HFF cells (g). One color key is indicated for all of the heatmaps. h. Genome coverage of data generated using MNase, DdeI, DpnII and HindIII. The read density was normalized to reads per million, separated by the coverage in A and B compartments (Methods). Source data
Extended Data Fig. 2
Extended Data Fig. 2. Cis and trans contact frequency differ between protocols.
a. The number of valid pairs in each of the 12 protocols applied to H1-hESC, DE, HeLa-S3-NS, HeLa-S3-G1 and HeLa-S3-M cells partitioned by genomic distances. b. Distance dependent contact probability of 12 protocols ordered as in (a), partitioned by fragmenting nucleases used (gray lines indicate all datasets, colored lines indicate datasets generated with the nucleases indicated for each plot). c. The relationship between the trans percent and the average slope of the distance dependent contact probability for the 12 protocols ordered as in Extended Data Fig. 2a. d. Quantification of protocol introduced noise as defined by inter-mitochondrial interactions (chrM with chr1-22), normalized by intra-mitochondrial (chrM with chrM) interactions. Source data
Extended Data Fig. 3
Extended Data Fig. 3. Quantitative compartment detection differ between protocols.
a. Hierarchical clustering of Spearman correlations of Eigenvectors (PC1) for 63 protocols. Clustering shows strong correlations between compartments from data obtained with varying protocols applied to the same cell types and weaker correlations for data obtained with the same protocols applied to different cell types. b–e. A-A and B-B compartment strength of saddle plots for fixation versus enzyme stratified by cell state: DE (b), H1-hESC (c), HeLa-S3-NS (d), HFF (e). For each cell type, saddle plot quantification was done for cis and trans reads separately. Source data
Extended Data Fig. 4
Extended Data Fig. 4. FA+DSG cross-linking produces reproducible chromatin loops.
a. Interaction heatmaps (log transformed) of experiments for H1-ESC cells obtained from the following cross-linker-enzyme combinations (from left to right): FA-DpnII, FA+DSG-DpnII and FA+DSG-MNase. b. Interaction heatmaps of protocols specified in Extended Data Fig. 4a for HFFc6 cells. c.Upset plots of loops detected with different replicates for H1-hESC show: 1) total number of loops detected in Replicate 1, Replicate 2 and merged replicates on the right side (gray bars), 2) number of loops detected in the one, two or three experiments shown in black bars. Loops found with only one or multiple experiments are highlighted and connected with black dots. Here Upset plots investigate the consistency of loops between each of the replicates and combined replicates for FA-DpnII, FA+DSG-DpnII and FA+DSG-MNase in H1-hESC. d. Upset plots (as explained in Extended Data Fig. 4c) of loops detected with different replicates for HFFc6 cells.
Extended Data Fig. 5
Extended Data Fig. 5. Fine fragmentation and DSG cross-linking improves loop detection.
a. Loops for HFFc6 shows the 1) total number of loops detected with FA-DpnII, FA+DSG-DpnII and FA+DSG-MNase(gray bars, right side), 2) number of overlapping loops detected (black bars). Overlapping loops are connected with black dots. b. Pileups of the loops from Fig. 4a. Numbers represent signal enrichment over local background (Methods). c. Individual loop strength (as in panel b) between protocol pairs in HFFc6. Protocols (left to right): FA-DpnII v/s FA+DSG-DpnII, FA+DSG-DpnII v/s FA+DSG-MNase and FA-DpnII v/s FA+DSG-MNase. Plots display two sets of looping interactions - Union (red squares) and Intersection (blue circles) from the three protocols. Color scale represents density of loop interactions. d,e.Aggregated loop strengths of intersection loop set from matrix of 12 protocols (described in Fig. 1a) for H1-hESC (d), and HFFc6 (e). Source data
Extended Data Fig. 6
Extended Data Fig. 6. Finer fragments lead to detection of Promoter-Enhancer loops.
a. H1-hESC loops versus loop anchors. Expected for anchors in one loop: y=2x b,c. FA-DpnII loops subtracted from FA+DSG-DpnII (b) or FA+DSG-MNase (c) Union of loops detected at the same anchors. d,e. Valencies of loop anchors for H1-hESC (d), HFFc6 (e) from FA-DpnII, FA+DSG-DpnII, FA+DSG-MNase. FA-DpnII is used as a guiding example. Categories are: anchors from 1 protocol (FA-DpnII), anchors from 2 protocols (FA-DpnII and either FA+DSG-DpnII or FA+DSG-MNase) and anchors from all 3 protocols. f. CTCF, SMC1, H3K4me3 and H3K27ac enrichments at loop anchors for all protocols (intersection) or FA+DSG-MNase alone in H1-hESC.Average enrichments centered on open chromatin regions within anchor coordinates. g. Top: cCREs from common and FA+DSG-MNase specific loop anchors (Extended Data Fig. 5f). Bottom: stratified percentage of Promoter-Enhancer cCREs without CTCF enrichment. h. Enrichment of CTCF, SMC1, H3K4me3 and H3K27ac for left (Anchor1) and right (Anchor 2) anchor in H1-hESC using FA-DpnII, FA+DSG-DpnII or FA+DSG-MNase. Source data
Extended Data Fig. 7
Extended Data Fig. 7. Insulation quantification is robust to experimental variations.
a-d. Rows: HFFc6 deep data from FA-DpnII (top), FA+DSG-DpnII (middle) and FA+DSG-MNase (bottom). Columns: boundary strength distributions with strength threshold (a) (Methods), pileups in FA-DpnII, FA+DSG-DpnII and FA+DSG-MNase for aggregate insulation scores at loop anchors (left), strong insulation boundaries (middle) and loop anchors colocalizing with strong insulation boundaries (right) (b). Left panel: boundary strength distribution of matrix data (Fig. 1a) for FA-DpnII, FA+DSG-DpnII and FA+DSG-MNase. Right panel:correlation of strong boundaries between deep and matrix data for FA-DpnII, FA+DSG-DpnII and FA+DSG-MNase (c). Aggregate insulation profile of weak and strong boundaries from matrix data for HFFc6 for cross-linkers and nucleases (d). e–h. H1-hESC data displayed like Extended Data Fig. 7a-d. i. Number of boundaries (y-axis) stratified by number of protocols (1 to 12; see Fig. 1a) wherein a given boundary was detected (x-axis). j. Insulation strength of boundaries stratified as in (i). k. Mean insulation strength for boundaries detected in at least half of protocols for various cross-linkers and enzyme combinations of H1-hESC, DE, HFF and HeLa-S3-NS (Methods). l. Mean insulation strength of loop anchors detected in all three deep protocols for both HFFc6 and H1-hESC, averaged for 12 protocols of H1-hESC and HFF. Source data
Extended Data Fig. 8
Extended Data Fig. 8. Hi-C 3.0 performs similar to Micro-C.
a. Fragment size distributions from Fragment Analyzer for specified protocols. b. Cumulative distributions of fragmented DNA in HFF cells stratified for cross-linking agents (top row) or restriction enzymes (bottom row). Dashed lines in each of the panels represent expected fragment size distribution from in silico digestion of hg38 for enzymes indicated. Gray lines represent all data from all other enzymes (columns). c. Comparison of CTCF, SMC1, H3K4me3 and H3K27ac enrichments at loop anchors centered at open chromatin regions. Open chromatin regions (ATAC Seq) located within the anchor coordinates were used to center the average enrichments. Anchors were separated into sets detected by FA+DSG-DdeI+DpnII, FA+DSG-MNase or both. d. Percentage of cCREs and promoter-enhancer elements located at loop anchors specific to FA+DSG-DdeI+DpnII, FA+DSG-MNase or shared between them. Source data
Extended Data Fig. 9
Extended Data Fig. 9. Sequencing depth impact loop detection but not compartmentalization.
a. Spearman correlation of the eigenvectors for different sequencing depths in H1-hESC. Each point represents one sampled experiment. X-axis shows the sequencing depth (200 M reads-2B reads) and the y- axis shows the correlation of the eigenvectors for each depth with the eigenvector of the experiment with 2 Billion reads. The bottom plot shows the zoomed correlations. b. Compartment strength of A compartment for experiments with different read depths quantified in cis and trans for H1-hESC. c. Compartment strength of B compartment for experiments with different read depths quantified in cis and trans for H1-hESC. d. # of loops detected in experiments with different read depths in H1-hESC. e-f. Analysis that is shown in a-d repeated for experiments performed in HFFc6 cells. Source data

References

    1. Dekker J, Rippe K, Dekker M, Kleckner N. Capturing chromosome conformation. Science. 2002;295:1306–1311. doi: 10.1126/science.1067799. - DOI - PubMed
    1. Denker A, de Laat W. The second decade of 3C technologies: detailed insights into nuclear organization. Genes Dev. 2016;30:1357–1382. doi: 10.1101/gad.281964.116. - DOI - PMC - PubMed
    1. Rao SS, et al. A 3D map of the human genome at kilobase resolution reveals principles of chromatin looping. Cell. 2014;159:1665–1680. doi: 10.1016/j.cell.2014.11.021. - DOI - PMC - PubMed
    1. Kagey MH, et al. Mediator and cohesin connect gene expression and chromatin architecture. Nature. 2010;467:430–435. doi: 10.1038/nature09380. - DOI - PMC - PubMed
    1. Fudenberg G, et al. Formation of chromosomal domains by loop extrusion. Cell Rep. 2016;15:2038–2049. doi: 10.1016/j.celrep.2016.04.085. - DOI - PMC - PubMed

Publication types