. 2021 Dec;161(6):1953-1968.e15.
doi: 10.1053/j.gastro.2021.08.053. Epub 2021 Sep 2.

Molecular Characterization of Limited Ulcerative Colitis Reveals Novel Biology and Predictors of Disease Extension

Affiliations

Molecular Characterization of Limited Ulcerative Colitis Reveals Novel Biology and Predictors of Disease Extension

Carmen Argmann et al. Gastroenterology. 2021 Dec.

Abstract

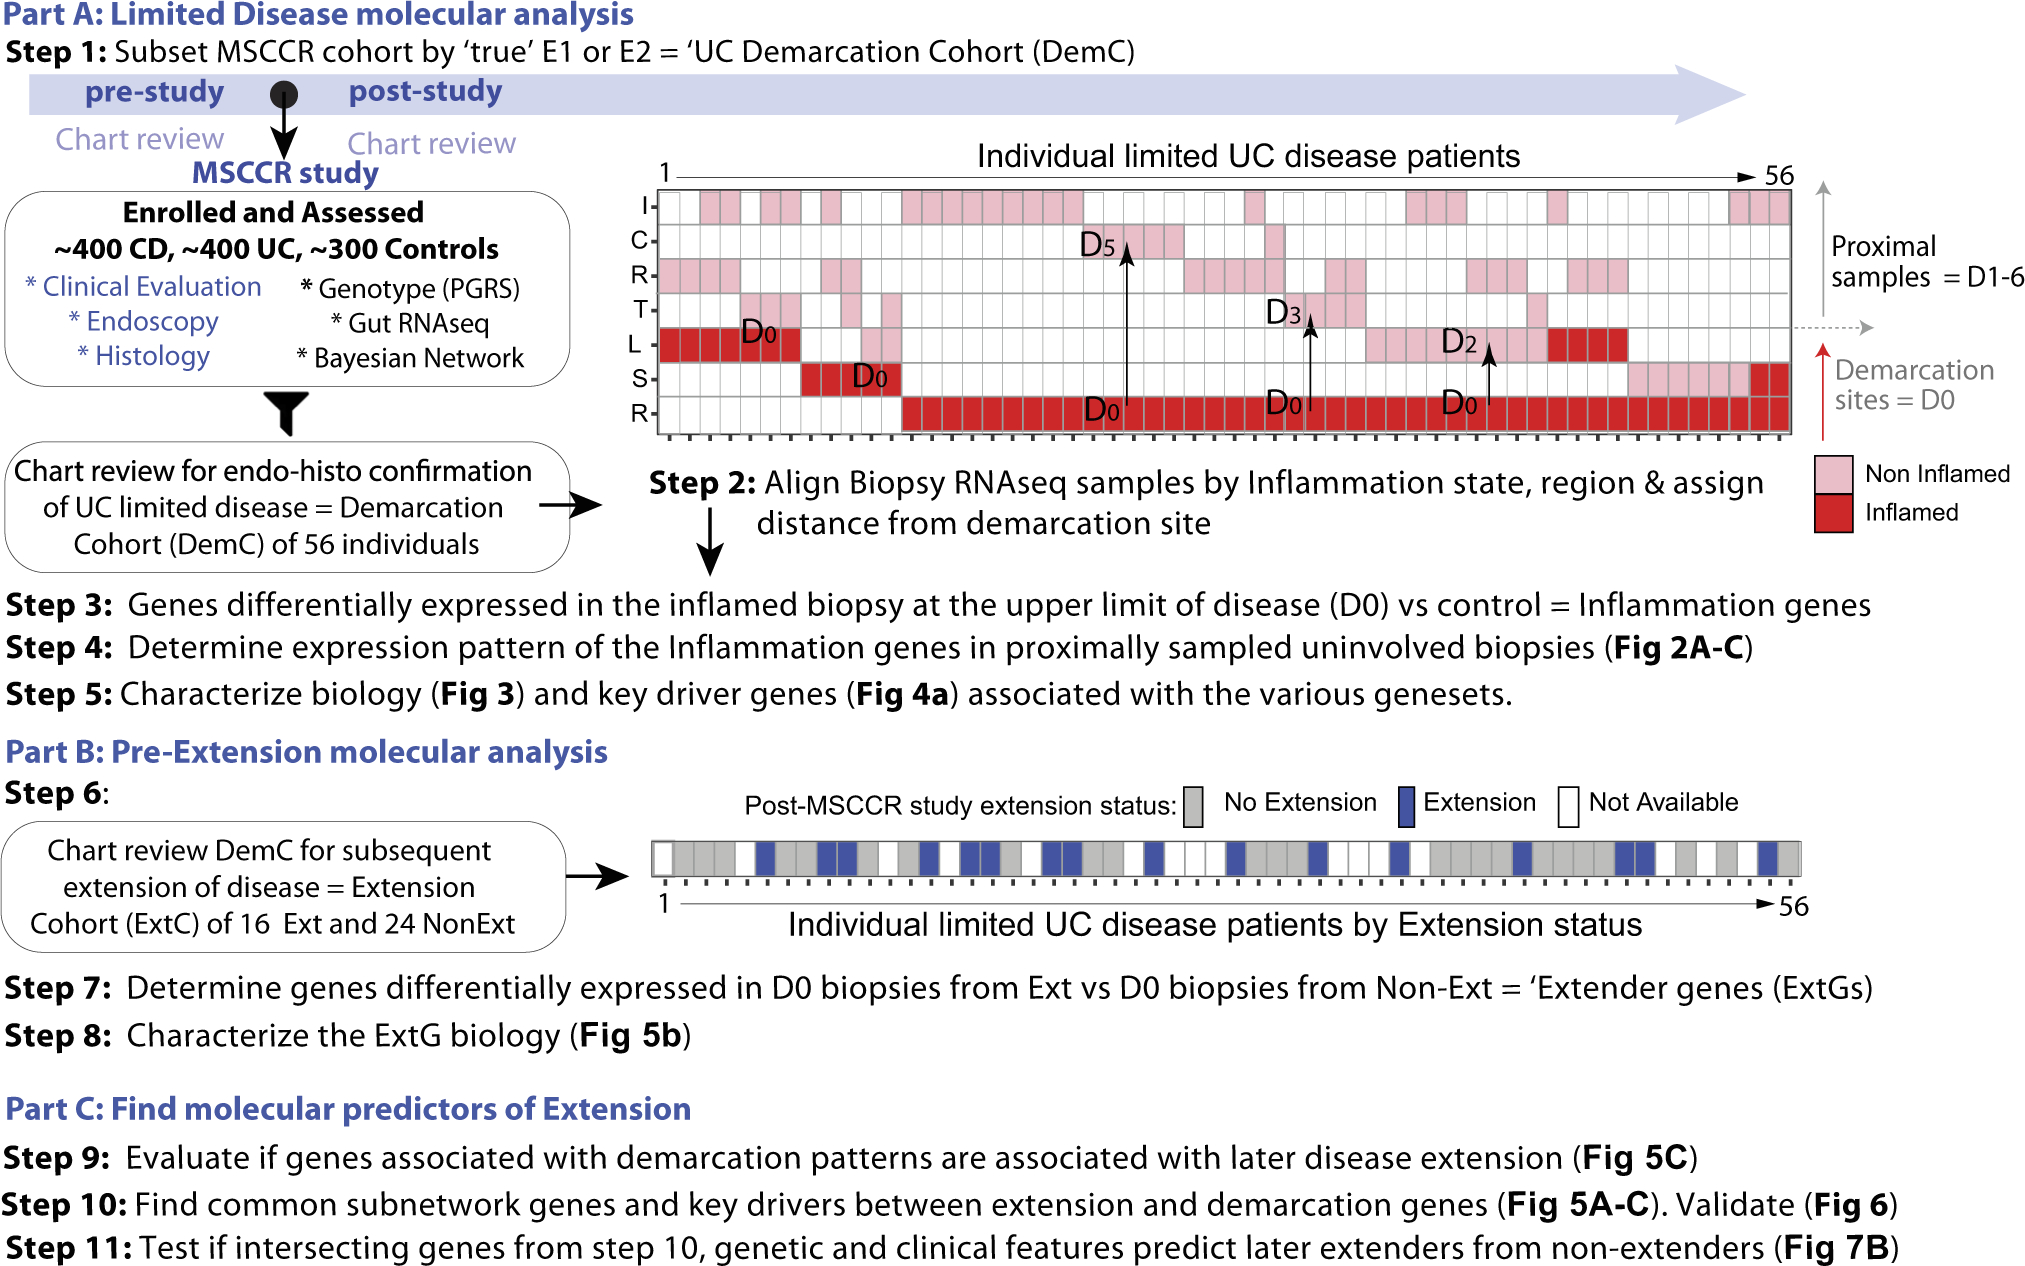
Background and aims: Disease extent varies in ulcerative colitis (UC) from proctitis to left-sided colitis to pancolitis and is a major prognostic factor. When the extent of UC is limited there is often a sharp demarcation between macroscopically involved and uninvolved areas and what defines this or subsequent extension is unknown. We characterized the demarcation site molecularly and determined genes associated with subsequent disease extension.

Methods: We performed RNA sequence analysis of biopsy specimens from UC patients with endoscopically and histologically confirmed limited disease, of which a subset later extended. Biopsy specimens were obtained from the endoscopically inflamed upper (proximal) limit of disease, immediately adjacent to the uninvolved colon, as well as at more proximal, endoscopically uninflamed colonic segments.

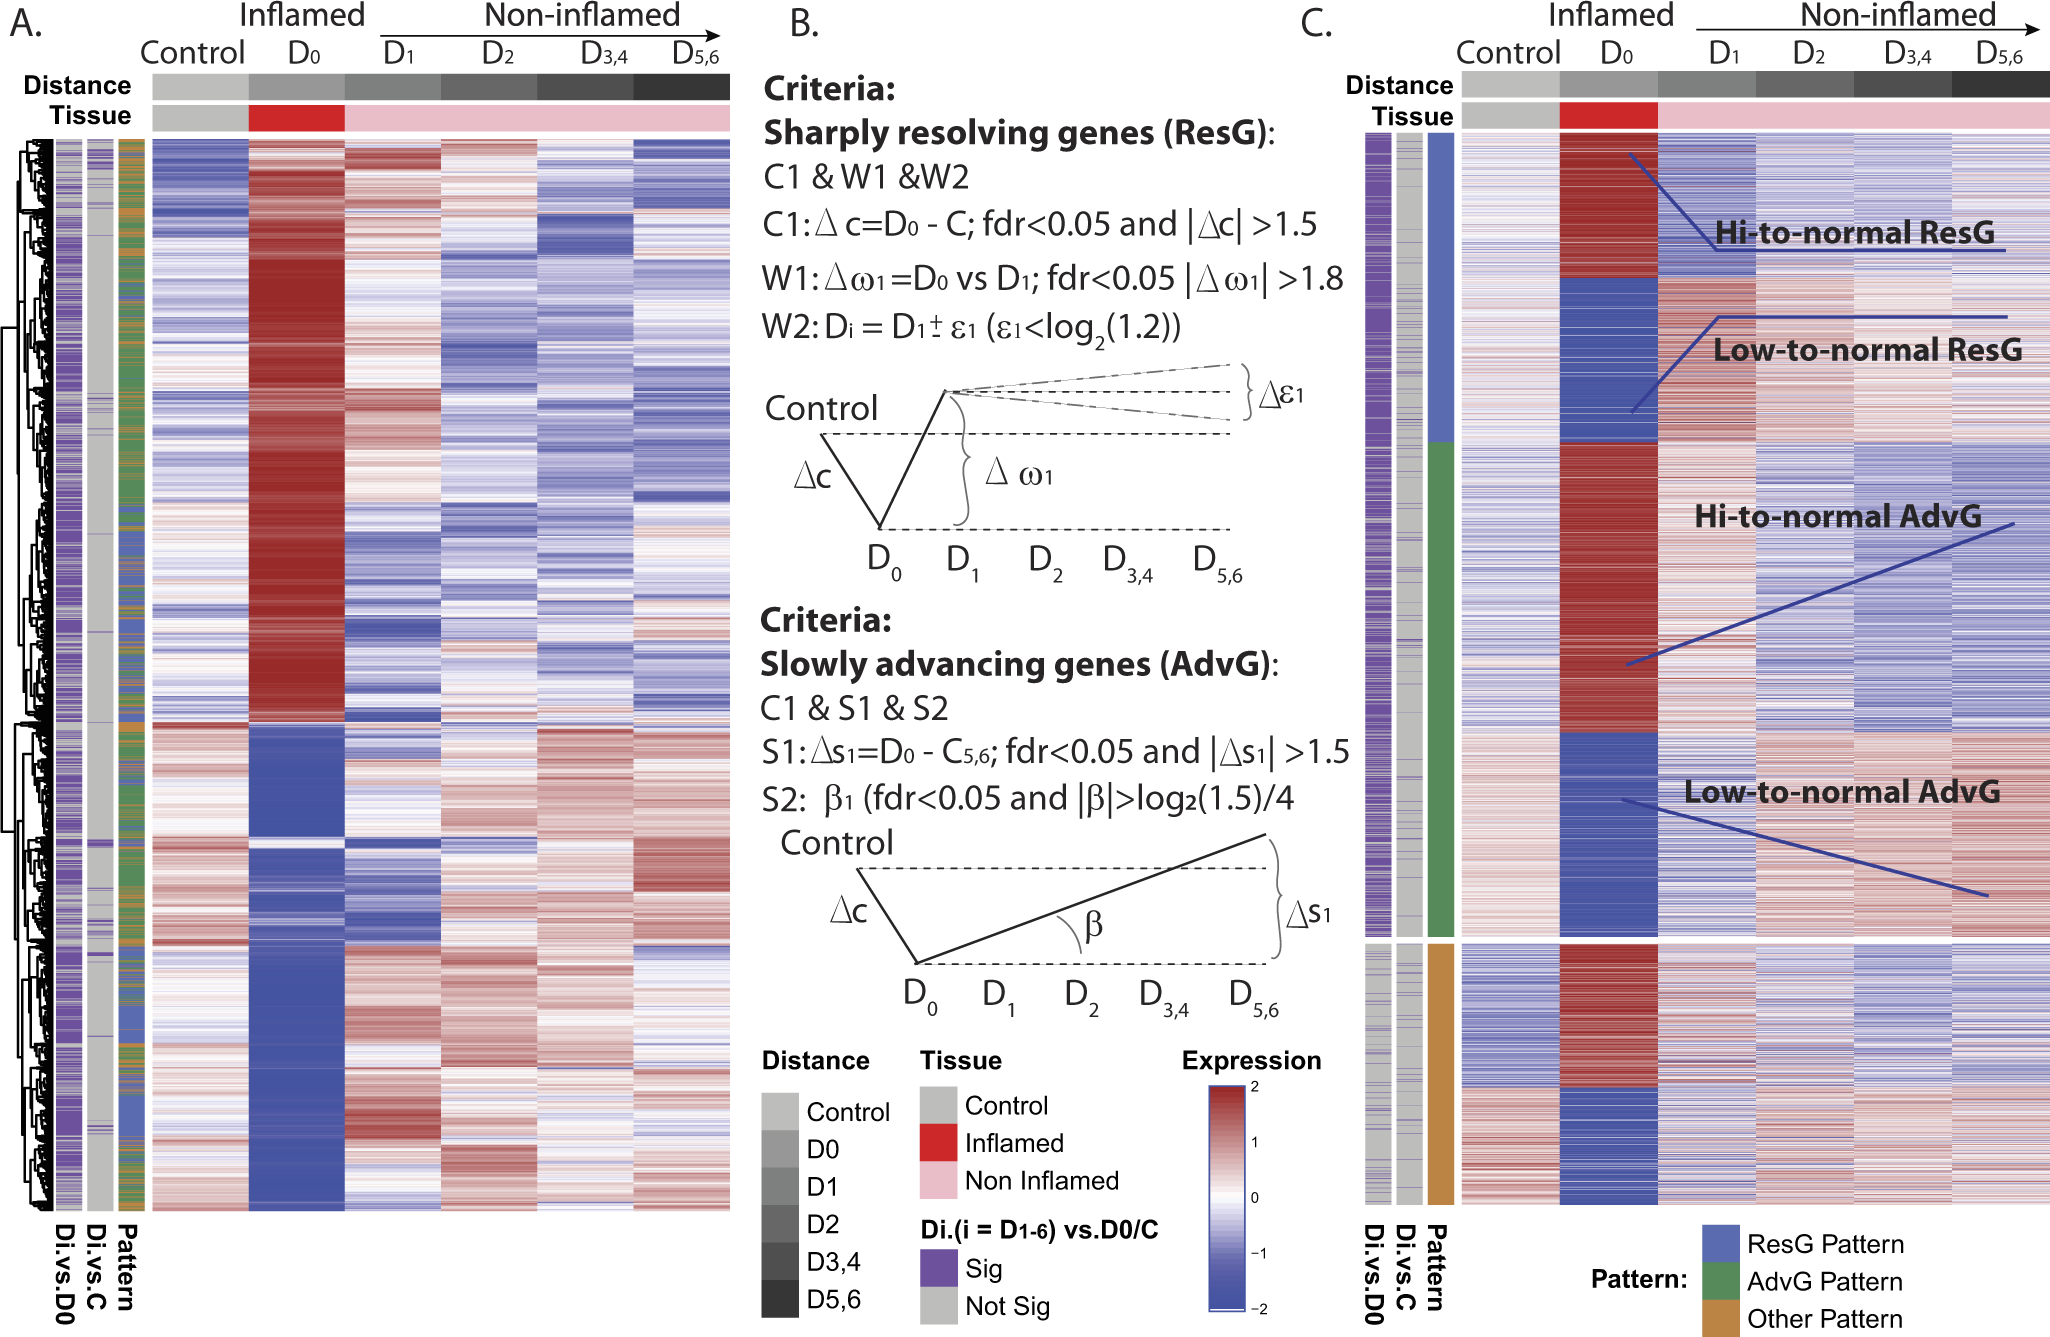
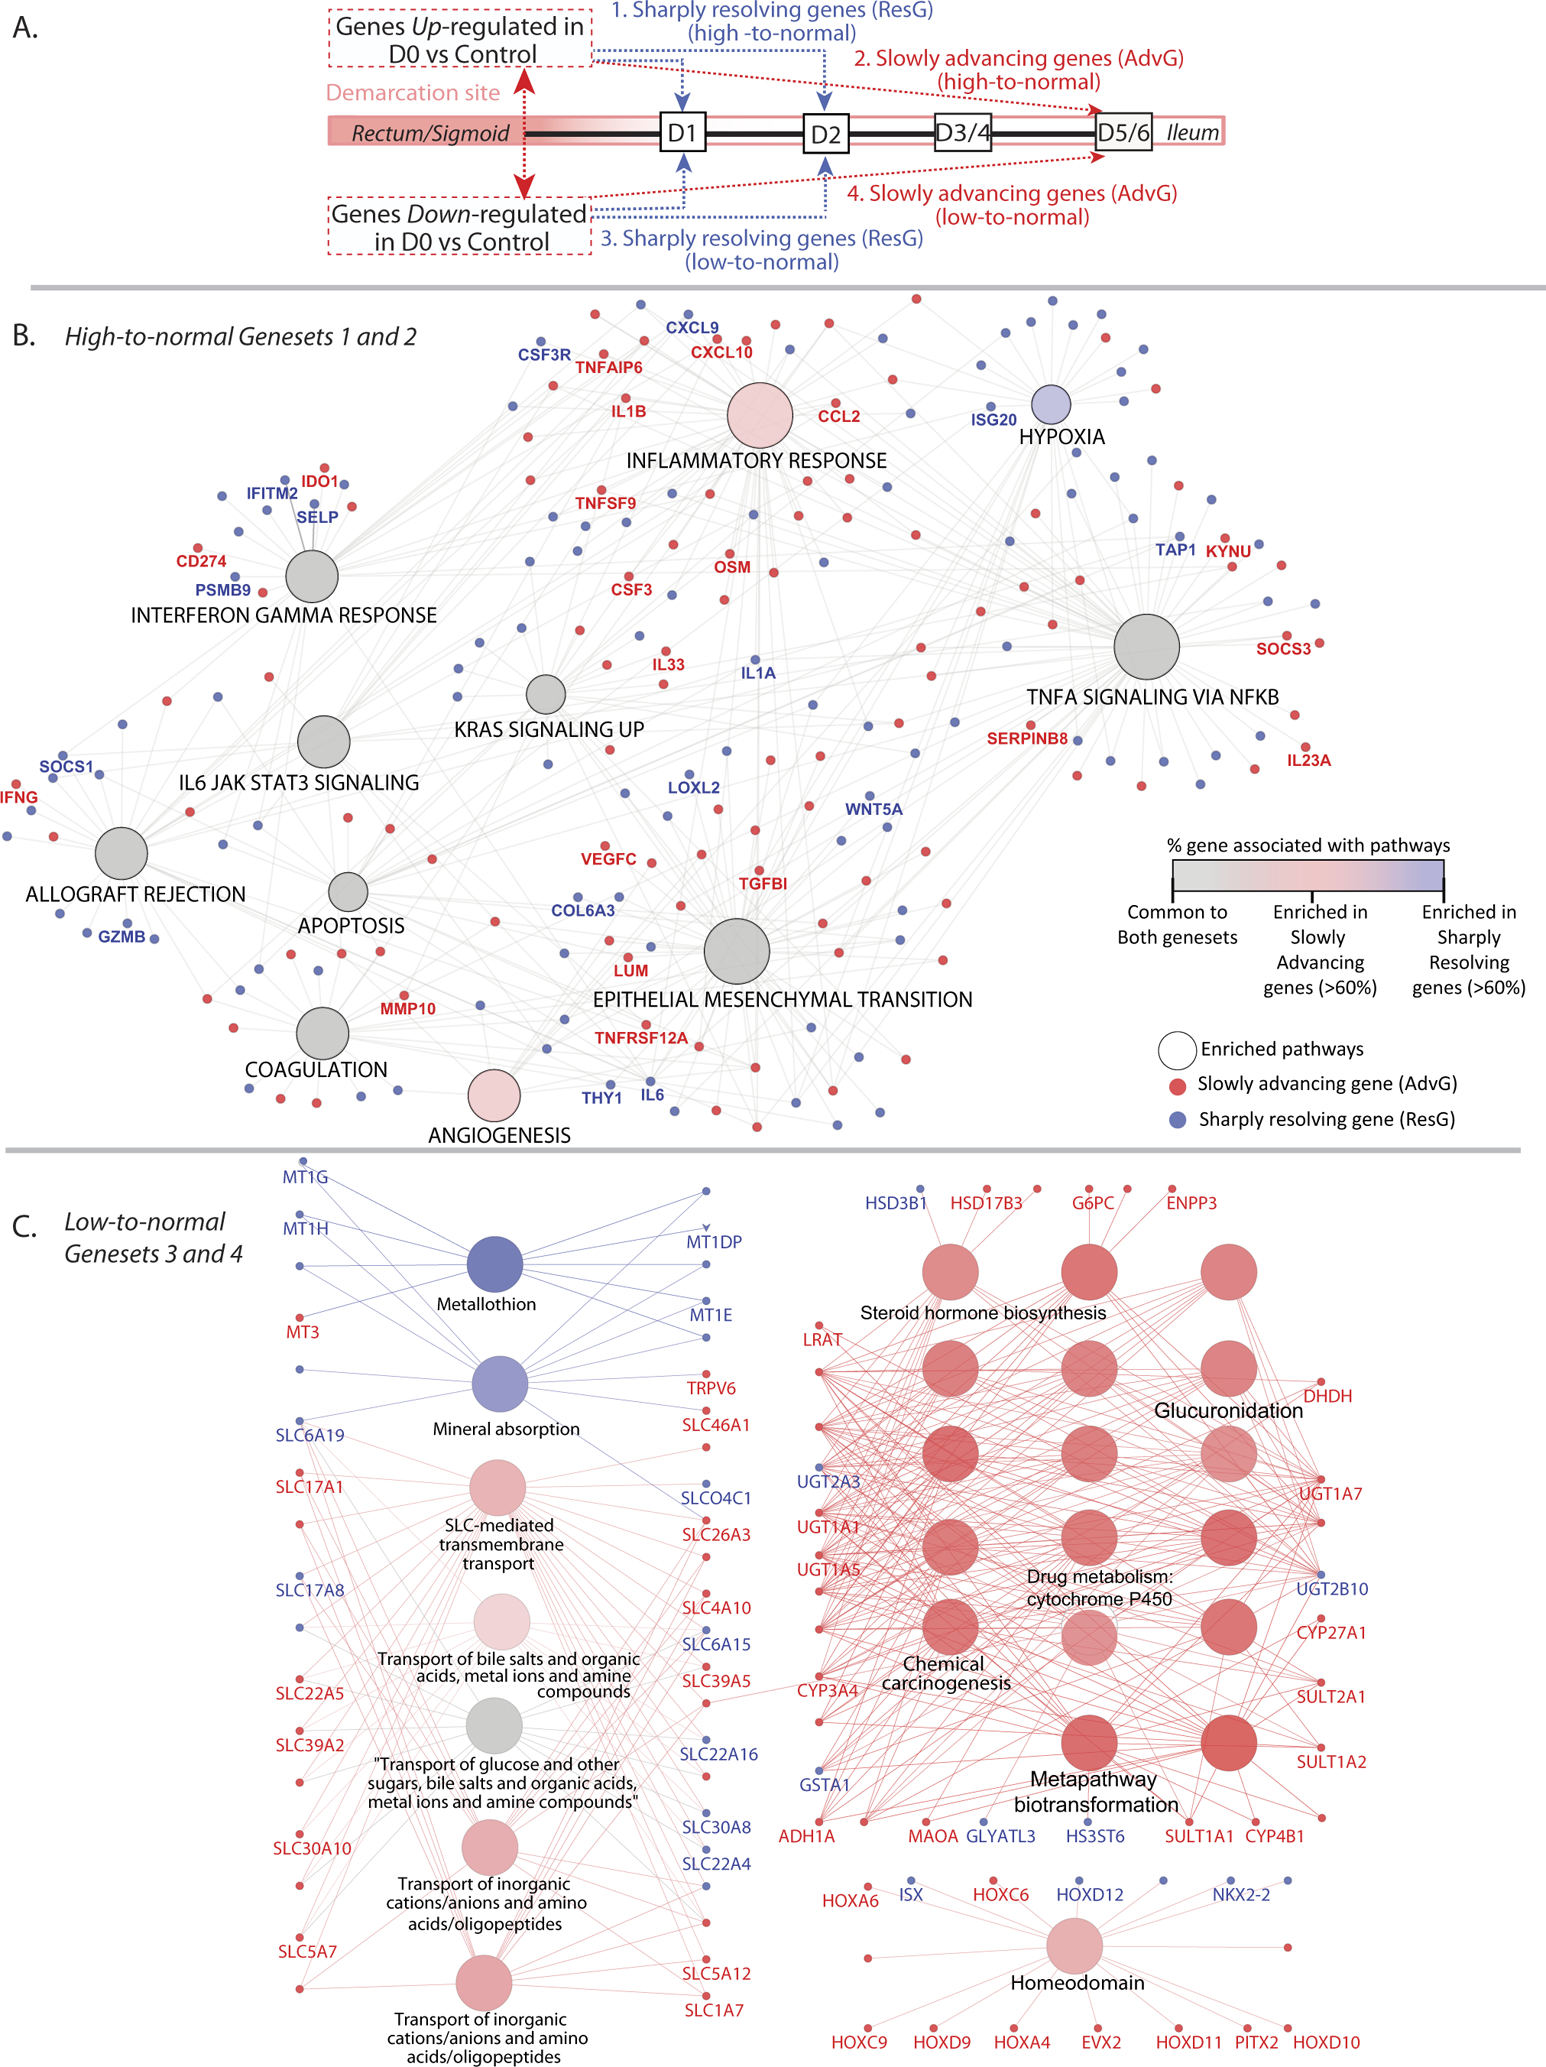
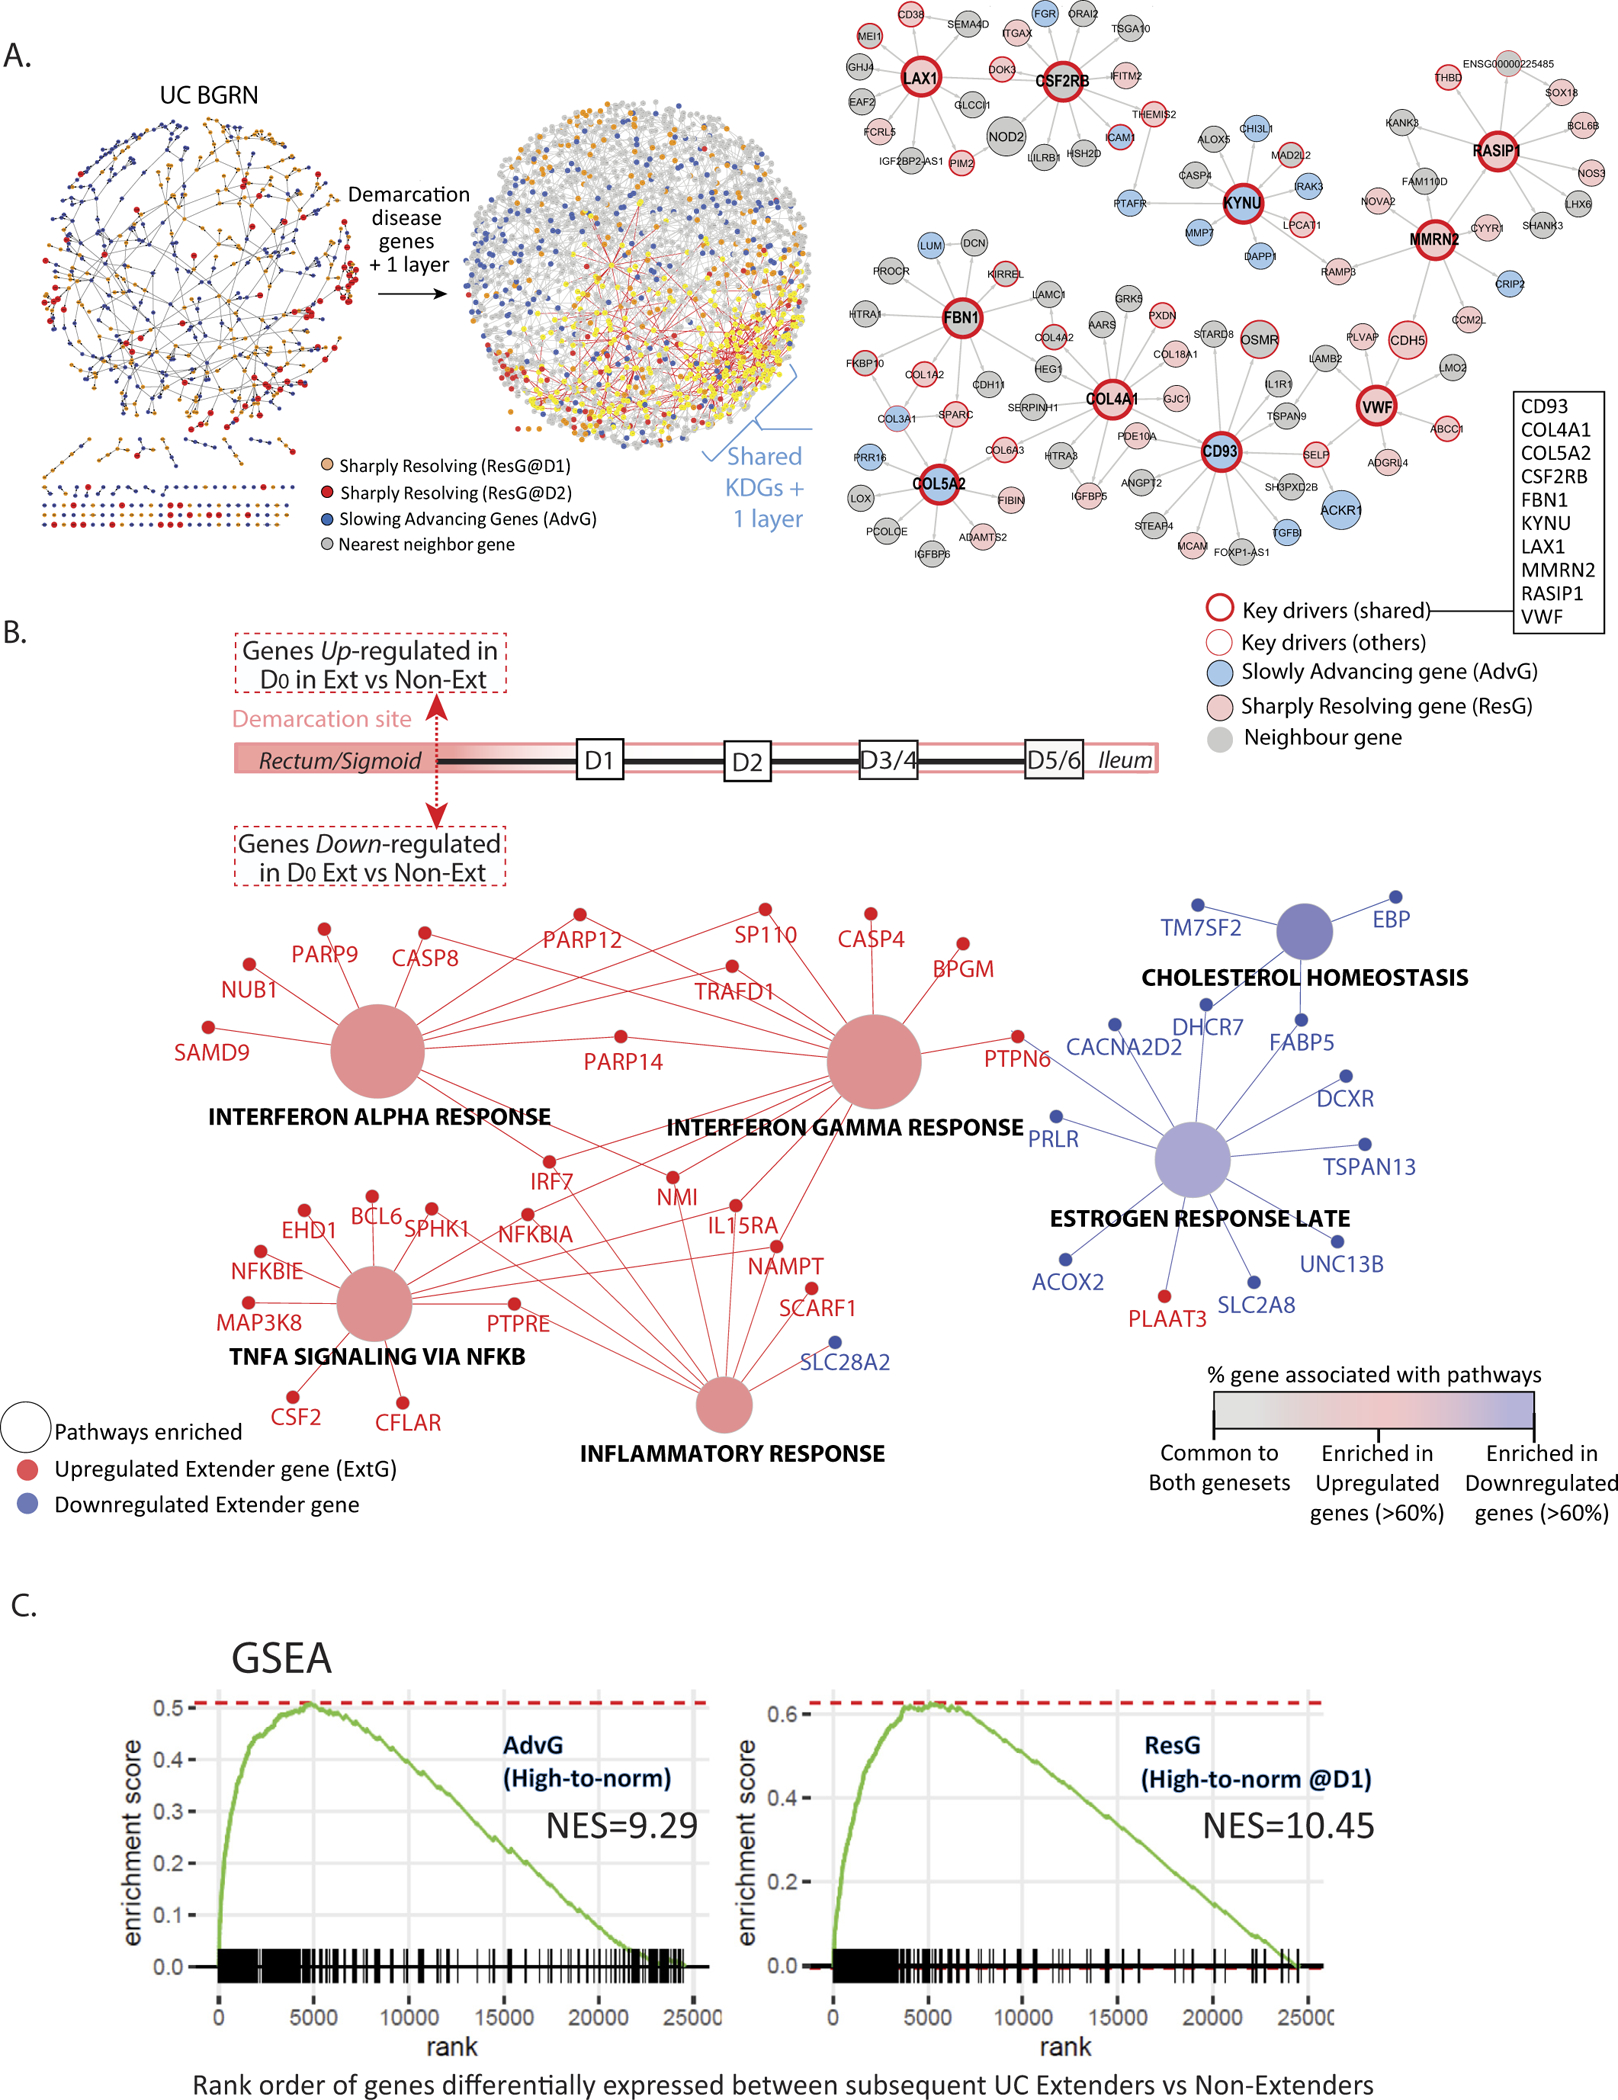
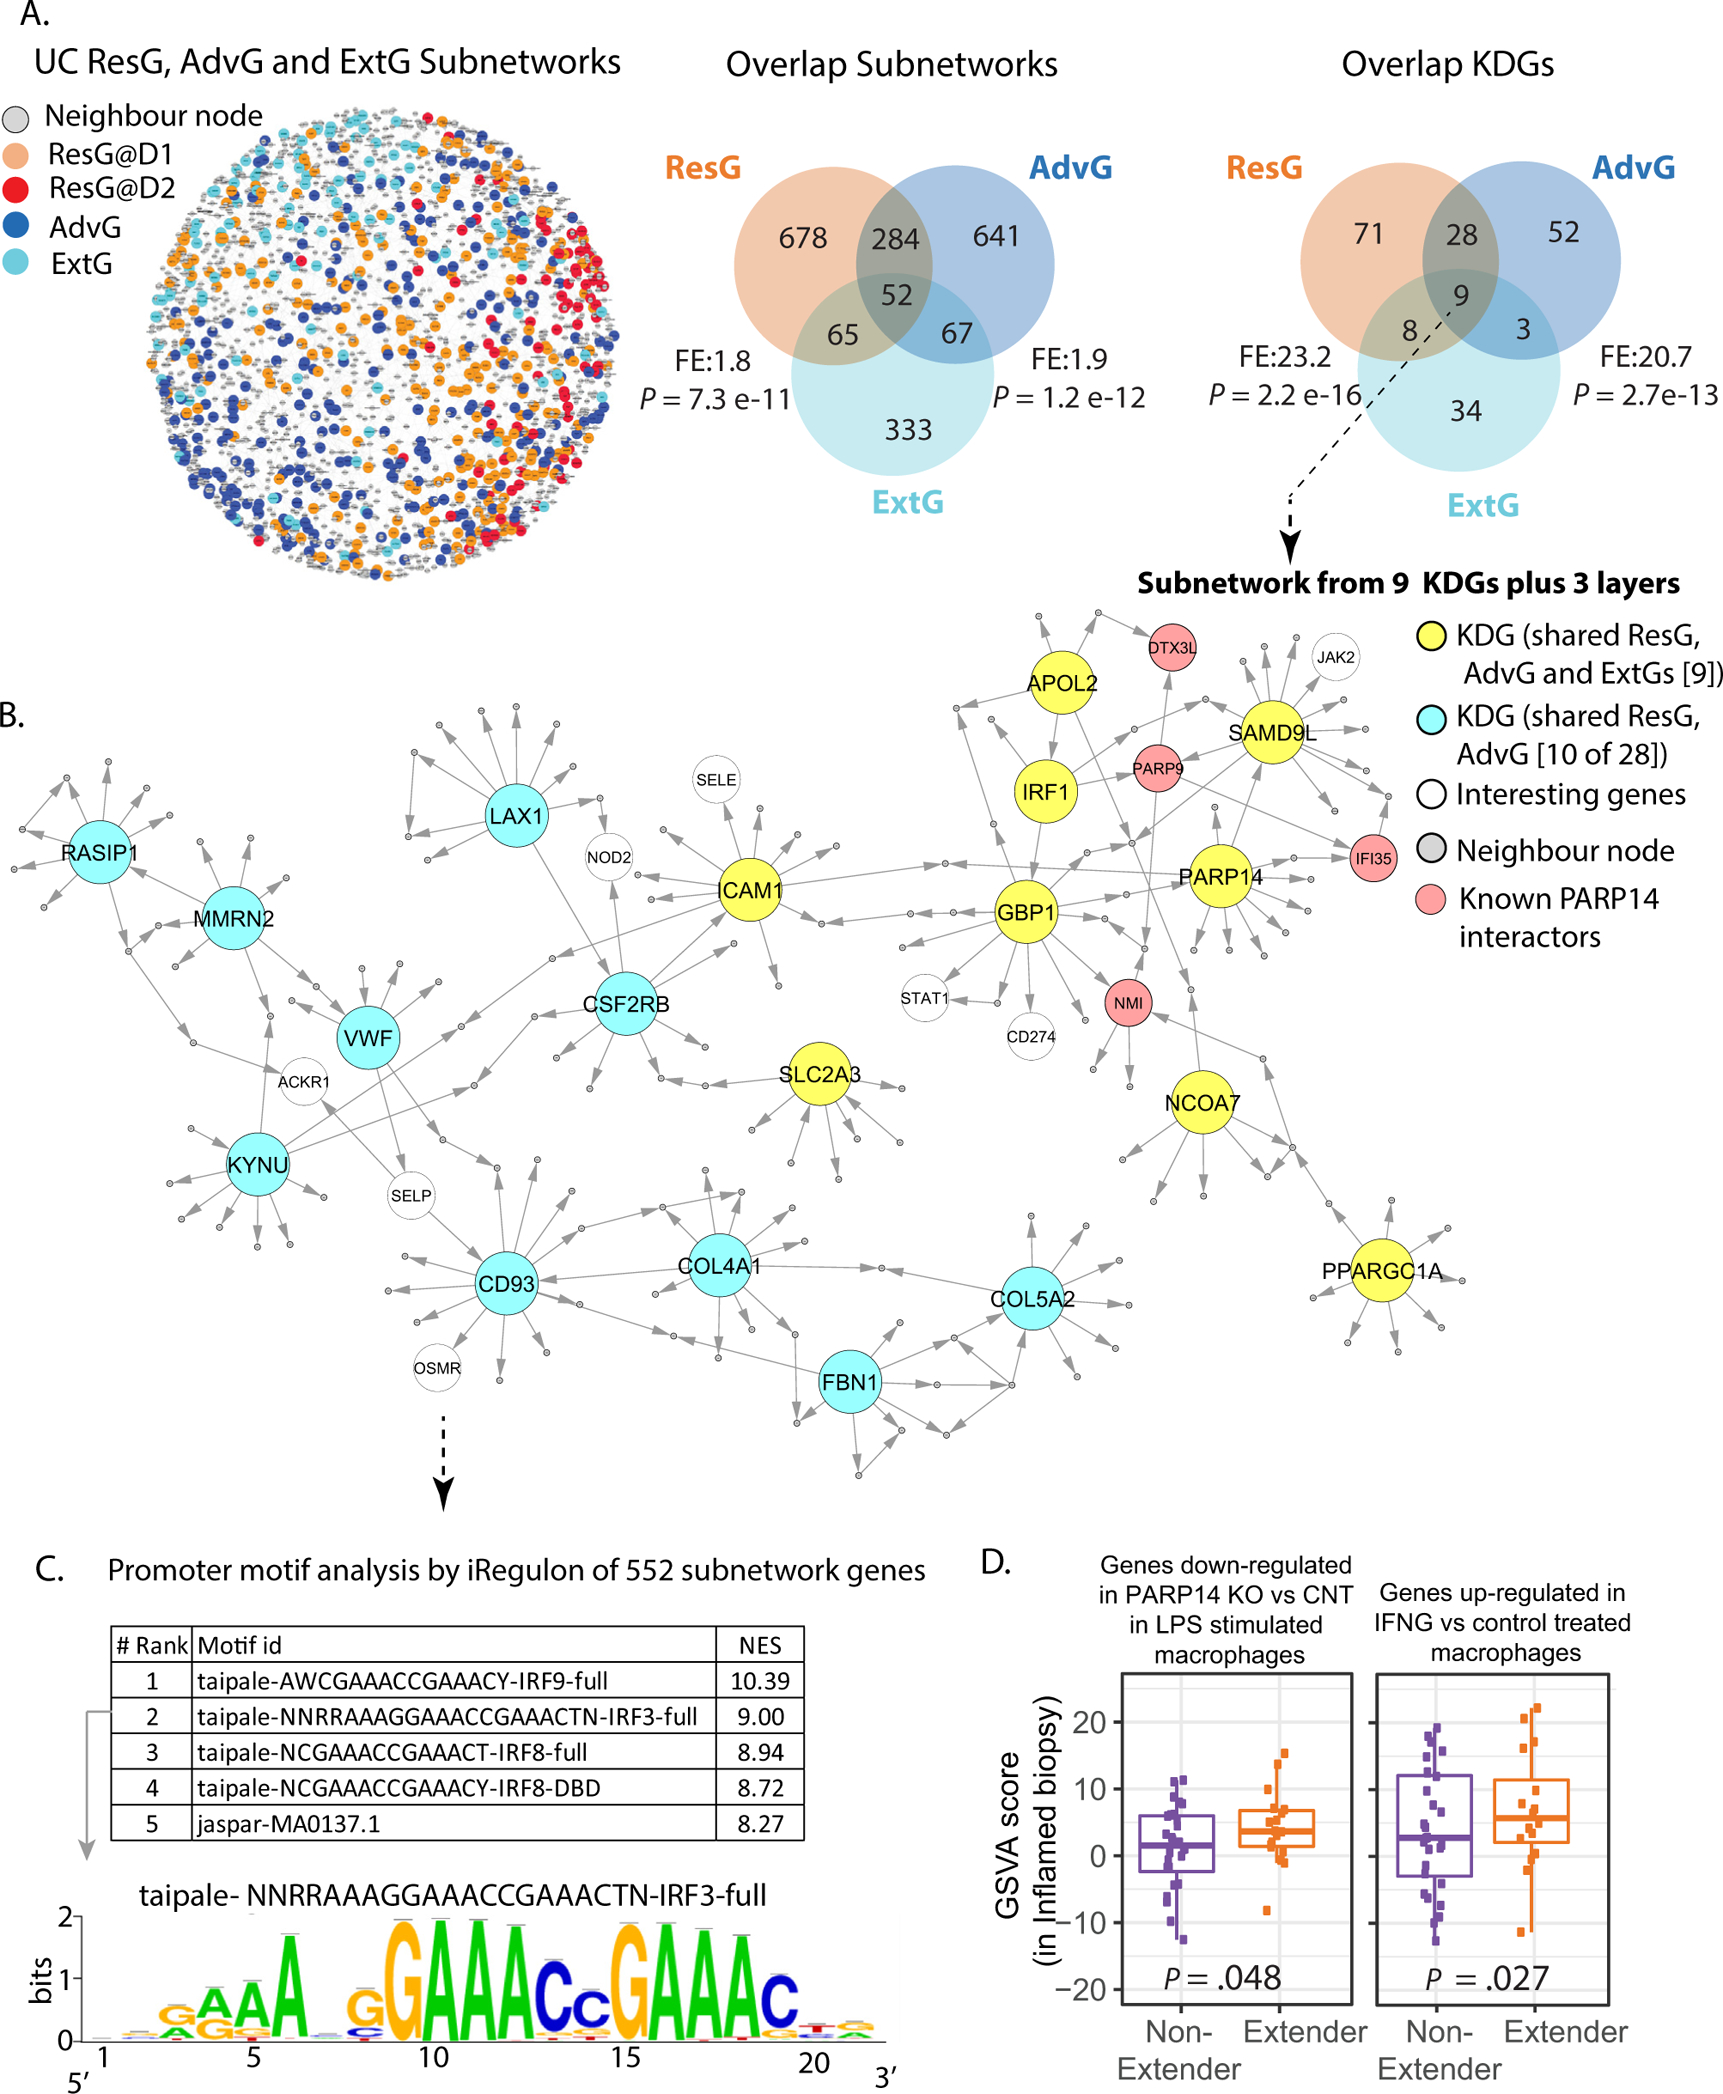
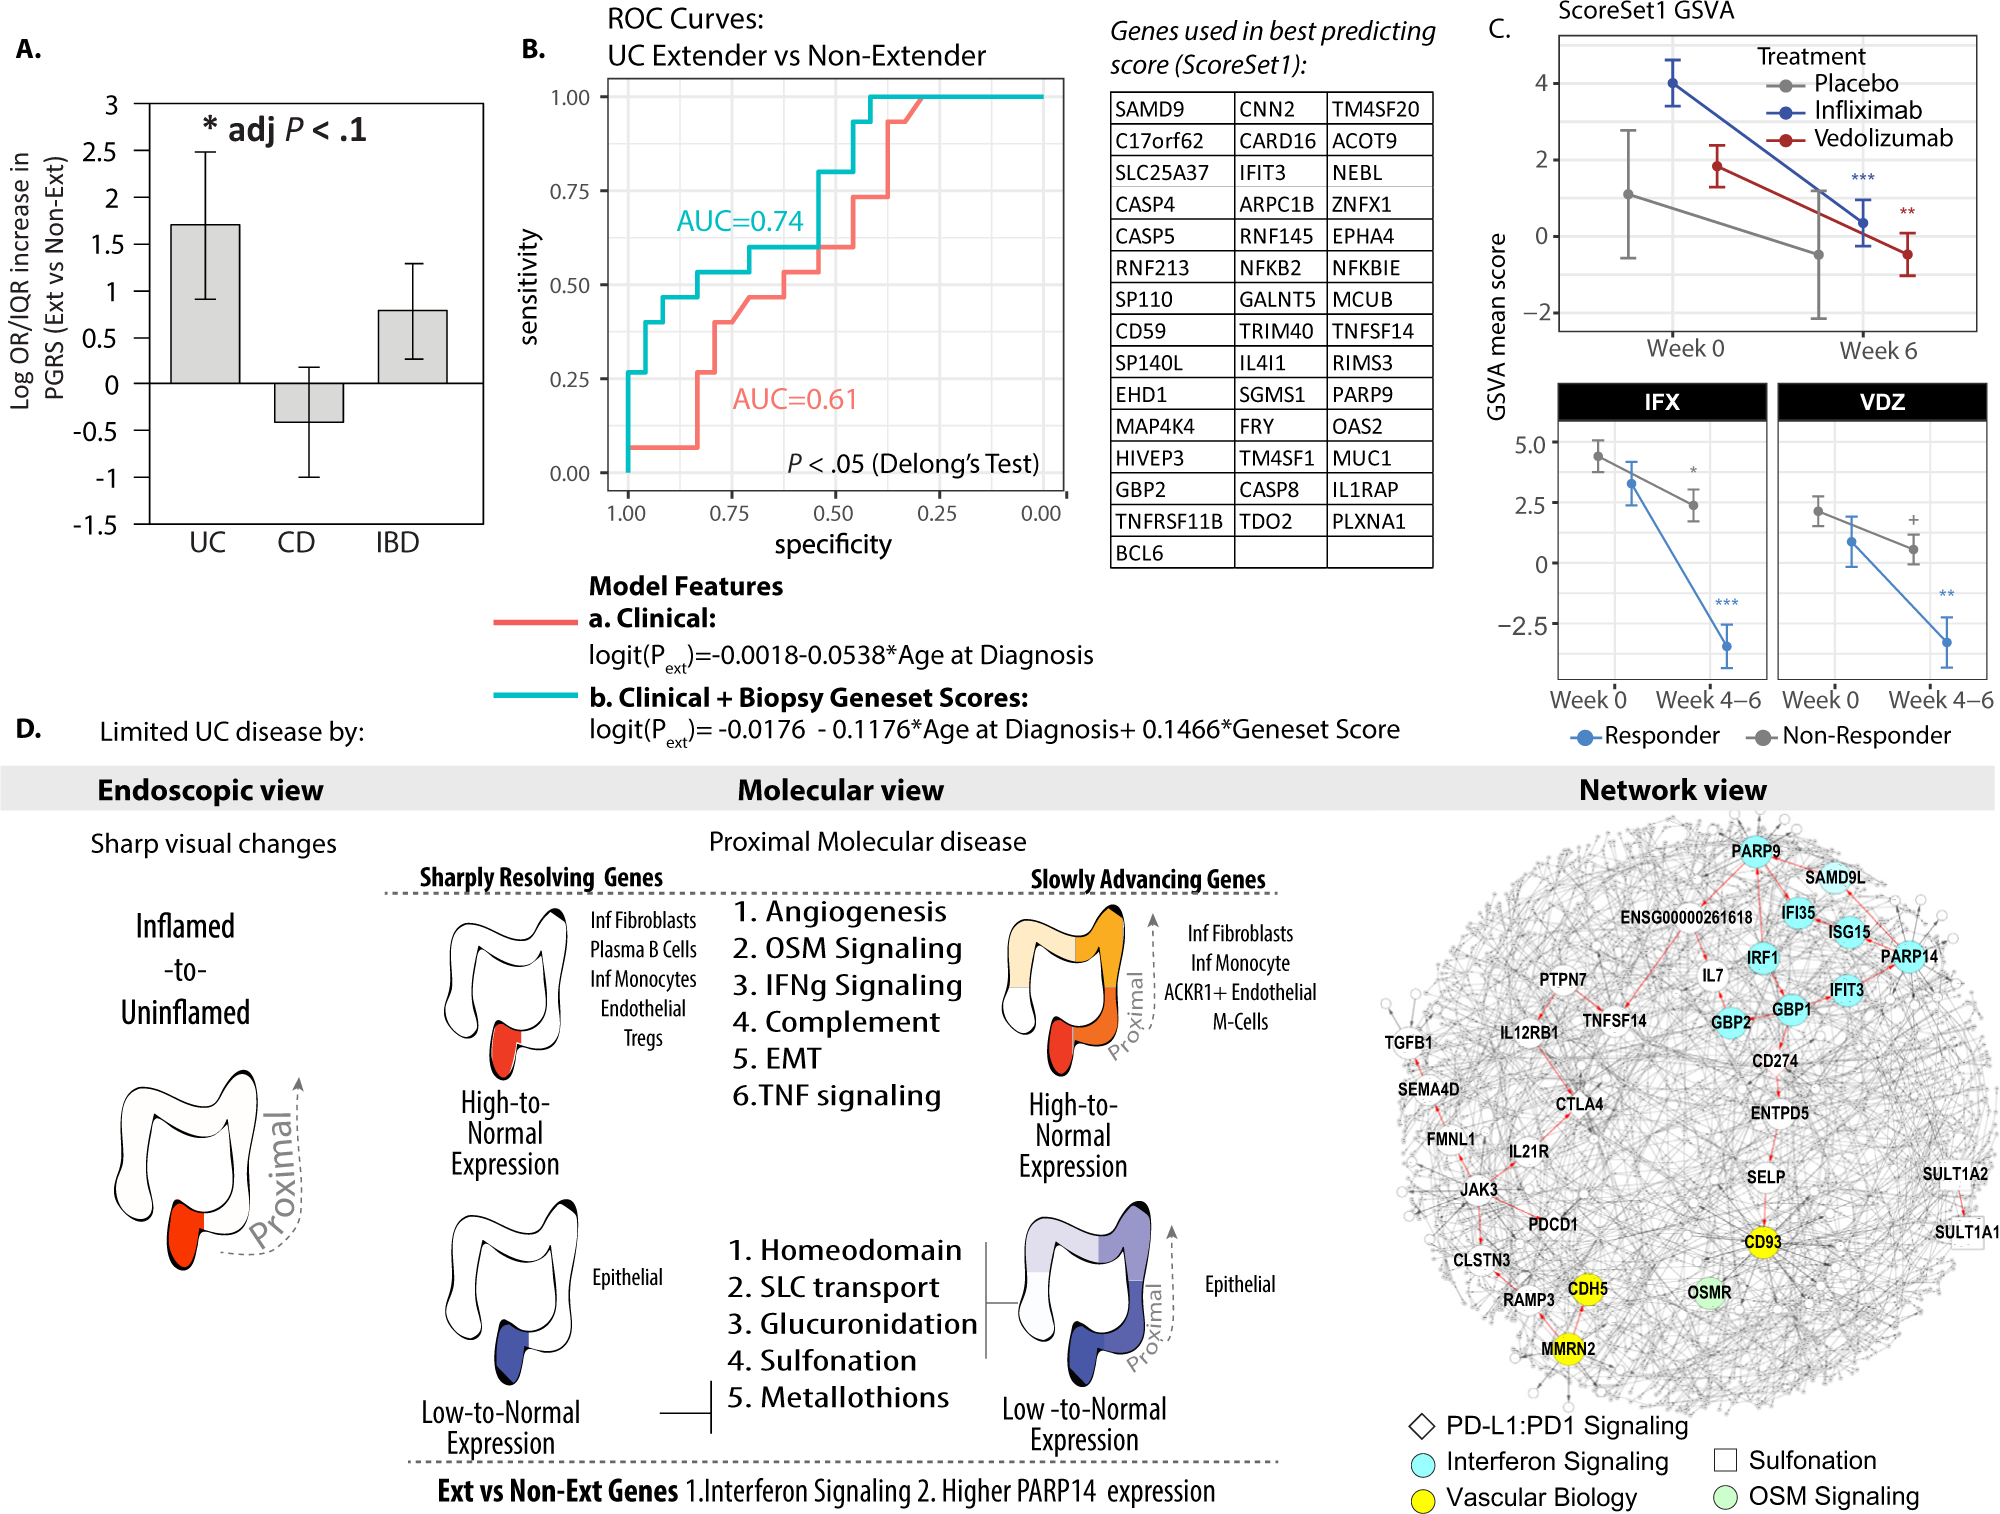
Results: Differentially expressed genes were identified in the endoscopically inflamed biopsy specimens taken at each patient's most proximal diseased site relative to healthy controls. Expression of these genes in the more proximal biopsy specimens transitioned back to control levels abruptly or gradually, the latter pattern supporting the concept that disease exists beyond the endoscopic disease demarcation site. The gradually transitioning genes were associated with inflammation, angiogenesis, glucuronidation, and homeodomain pathways. A subset of these genes in inflamed biopsy specimens was found to predict disease extension better than clinical features and were responsive to biologic therapies. Network analysis revealed critical roles for interferon signaling in UC inflammation and poly(ADP-ribose) polymerase 14 (PARP14) was a predicted key driver gene of extension. Higher PARP14 protein levels were found in inflamed biopsy specimens of patients with limited UC that subsequently extended.

Conclusion: Molecular predictors of disease extension reveal novel strategies for disease prognostication and potential therapeutic targeting.

Keywords: Disease Extension; Interferon Signaling; Molecular; PARP14; UC.


Figures

Figure 1.
Figure 1.
Study design. The MSCCR cohort was subset according to individuals with true limited disease, referred to as Demarcation Cohort (DemC). A schema summarizing the DemC biopsy specimens according to individual (X-axis), intestinal region (Y-axis), and inflammation status. I, ileum; C, cecum; R, rectum; T, transverse; L, left-side; S, sigmoid. The lower panel indicates which patients had known extension status. A “distance” was assigned between each pair of patient biopsy specimens. D0 tagged the most proximal inflamed biopsy and then a number of D1–D6 was assigned for the matching patient uninvolved biopsy depending on the proximal colonic segment it was sampled. Steps 3–5 summarize how molecular disease demarcation patterns were determined including KDGs. The DemC was further subset according to disease extension status (post-MSCCR study) evaluated through chart review. Steps 7 and 8 described the determination of genes associated with later extension and their biological processes. Part C involved integration of the demarcation and extender genes on a network level. Common genes were tested in models to predict later extension.
Figure 2.
Figure 2.
Characterization of the molecular expression patterns proximal to the site of demarcation. (A) Unsupervised clustering of the demarcation disease genes defined as those differentially expressed between D0 and control. The heatmap shows 2 potential patterns of expression changes. (B) Statistical modeling was used to identify genes of specific expression change patterns of either (1) “sharply resolving (ResG),” which have an abrupt change in expression between inflamed and immediate adjacent uninflamed biopsy and does not change in segments sampled more proximally and (2) slowly advancing (AdvG) molecular changes (either inclining or declining in expression) along the colonic segments proximally. (C) Reclustering of genes in B, supervised by the assigned demarcation pattern.
Figure 3.
Figure 3.
Pathways associated with demarcation genes. (A) Schematic summarizing the 2 main molecular demarcation expression patterns identified and the distinction as high-to-normal or low-to-normal. (B) Hallmark pathway enrichment analysis of the ResG or AdvG, with a high-to-normal change in expression. (C) Pathway enrichment analysis according to Kegg, Reactome, Bioplanet, and PFAM of the ResG or AdvG, with a low-to-normal change in expression. Nodes depict enriched terms and the coloring represents pathways in common (gray) or specific for AdvG (red) or ResG (blue). ResGs were queried as a single gene set (resolved @D1 or @D2). The edges connect genes to pathways with a subset labeled with gene names. Pathways shown are Benjamini-Hochberg adjusted P value <.05.
Figure 4.
Figure 4.
Network analysis of ResG and AdvG and pathway analysis of ExtG. (A) The UC_BGRN was queried for either AdvG, ResG@D1, or ResG@D2 and the resulting subnetworks without (left) or with (middle) 1 additional layer of nonsignature genes. Subnetwork associated with the 10 shared KDGs (black box and SF7B) and 1 additional layer gene (far right). (B) Hallmark pathway enrichment analysis (Benjamini-Hochberg adjusted P < .05) of the ~380 genes found differentially expressed (at unadjusted P < .01) in the inflamed biopsy specimens of patients that subsequently extended compared with those that did not (ExtG). Nodes depict the pathway and their coloring depicts those pathways commonly or specifically enriched for either up- (red) or down- regulated genes (blue). Edges connect the gene to pathway. (C) ExtG were ranked according to logFC differences between extenders vs. nonextenders and were tested for enrichment in ResG or AdvG. The trace of the enrichment scores is shown for 2 gene sets: AdvG (high-to-normal genes) and ResG (high-to-normal genes) with full results in SF9. The legend for Figure 3 contains explanation of gene sets. Normalized enrichment score (NES) and false discovery rate.
Figure 5.
Figure 5.
Network analysis of extender and demarcation genes. (A) ExtG, ResG, and AdvG were queried in the UC_BGRN and found to generate a single connected subnetwork of ~2000 genes with 1 layer of nonsignature genes. Venn diagrams comparing the demarcation and ExtG-associated subnetworks and KDGs with fold-enrichment and significance of overlap. (B) A subset of the network (552 total nodes) associated with the 9 shared KDGs between ExtG and demarcation gene sets (ST16). (C) iRegulon analysis using the genes’ promoters defined as 10 kb within the transcription start site (TSS). A summary of the top 5 motifs and their normalized enrichment score (ST17). (D) GSVA analysis of gene sets listed in the figure panel, using the inflamed biopsy expression data from the MSCCR patients with UC that subsequently extended vs. those that did not.
Figure 6.
Figure 6.
Colorectal localization of PARP14 in non-UC controls, UC extenders, and nonextenders. PARP14 (green), CD68 (red), and nuclei (blue) staining in colorectal biopsy specimens. (A) Representative staining from non-UC controls. Magnified images of positive areas are shown in the second column. No primary and isotype controls are shown in the far right panel. (B) Representative staining of inflamed and uninflamed colorectal biopsy specimens from patients with UC with and without subsequent disease extension. Magnified areas with representative CD68+ cells with nuclear PARP14 staining in biopsy specimens from an extender are shown on the far right (arrows) without 4’,6-diamidino-2-phenylindole (DAPI). (C) The frequency of LP cells with high PARP14 nuclear staining is higher in extenders as compared with nonextenders in both uninflamed (top) and inflamed (bottom) colorectal biopsy specimens. High nuclear staining was defined as an average nuclear intensity greater than the median positive value in the non-UC controls. A 1-way analysis of variance was used to compare groups. *P < .05. Scale bar; 100 μm.
Figure 7.
Figure 7.
A subset of AdvG is predictive of extension. (A) Average PGRS of the MSCCR subcohort that subsequently extended vs. nonextenders. (B) Receiver operating characteristic curve for the prediction of extension in patients with limited UC. The red line summarizes the results of the best-performing model that uses clinical features and includes age at diagnosis only. The teal line summarizes the results of the model that showed that the inclusion of molecular scores to clinical features was more predictive than clinical features alone (1-sided P value = .049). The most predictive molecular feature was GSVA scores generated on the inflamed D0 biopsy specimens using genes found in common between the ExtG- and AdvG-associated subnetworks from Figure 5A (and Supplementary Table 18, Scoreset1). (C) GSVA mean score for Scoreset1 as determined in biopsy transcriptome data available from patients with UC (GSE73661) at baseline and after treatment with either vedolizumab (VDZ) or infliximab (IFX, upper panel) vs. placebo groups or according to treatment responders vs. nonresponders (lower panel). (D) Summary of limited UC by endoscopy, molecular, and network views. The granularity of information associated with molecular and network analysis can be appreciated as pathways and potential KDGs associated with the pathology are learned. +P < .1; *P < .05; **P < .01; ***P<.001.

References

    1. Ungaro R, Mehandru S, Allen PB, et al. Ulcerative colitis. Lancet 2017;389:1756–1770. - PMC - PubMed
    1. Silverberg MS, Satsangi J, Ahmad T, et al. Toward an integrated clinical, molecular and serological classification of inflammatory bowel disease: report of a Working Party of the 2005 Montreal World Congress of Gastroenterology. Can J Gastroenterol 2005;19(Suppl A):5A–36A. - PubMed
    1. Burisch J, Ungaro R, Vind I, et al. Proximal disease extension in patients with limited ulcerative colitis: a Danish population-based inception cohort. J Crohns Colitis 2017;11:1200–1204. - PMC - PubMed
    1. Roda G, Narula N, Pinotti R, et al. Systematic review with meta-analysis: proximal disease extension in limited ulcerative colitis. Aliment Pharmacol Ther 2017;45:1481–1492. - PMC - PubMed
    1. Qiu Y, Chen B, Li Y, et al. Risk factors and long-term outcome of disease extent progression in Asian patients with ulcerative colitis: a retrospective cohort study. BMC Gastroenterol 2019;19:7. - PMC - PubMed

Publication types

MeSH terms

Substances