. 2021 Oct;297(4):101159.
doi: 10.1016/j.jbc.2021.101159. Epub 2021 Sep 2.

Spreading of Alzheimer tau seeds is enhanced by aging and template matching with limited impact of amyloid-β

Affiliations

Spreading of Alzheimer tau seeds is enhanced by aging and template matching with limited impact of amyloid-β

Sarah Helena Nies et al. J Biol Chem. 2021 Oct.

Abstract

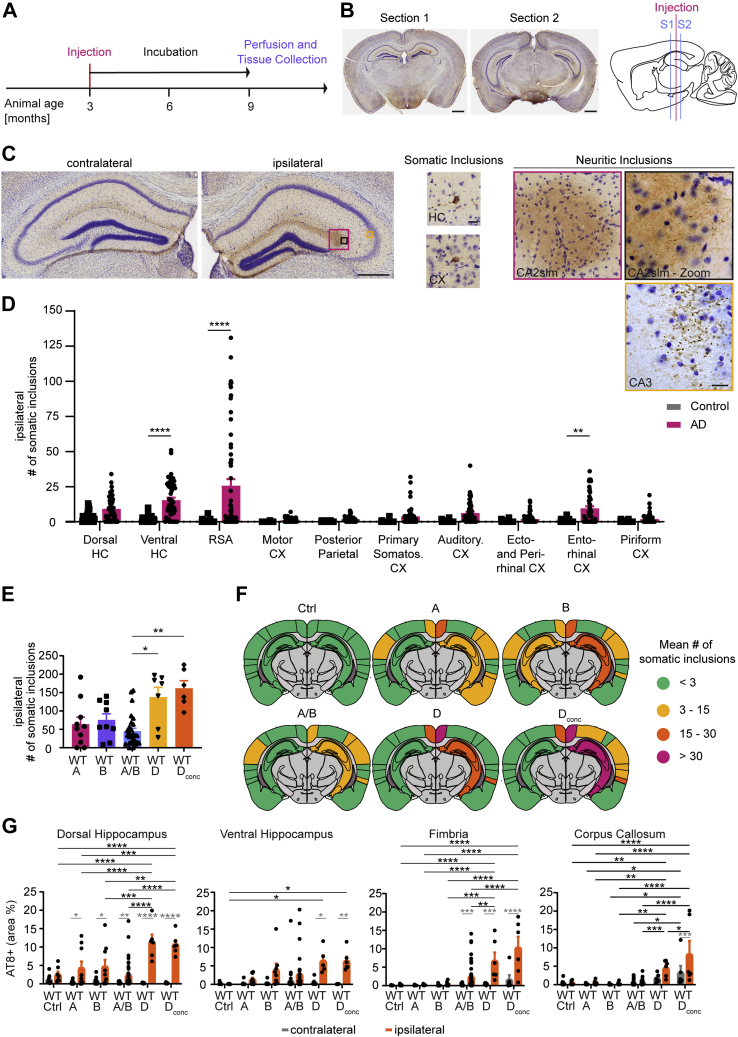
In Alzheimer's disease (AD), deposition of pathological tau and amyloid-β (Aβ) drive synaptic loss and cognitive decline. The injection of misfolded tau aggregates extracted from human AD brains drives templated spreading of tau pathology within WT mouse brain. Here, we assessed the impact of Aβ copathology, of deleting loci known to modify AD risk (Ptk2b, Grn, and Tmem106b) and of pharmacological intervention with an Fyn kinase inhibitor on tau spreading after injection of AD tau extracts. The density and spreading of tau inclusions triggered by human tau seed were unaltered in the hippocampus and cortex of APPswe/PSEN1ΔE9 transgenic and AppNL-F/NL-F knock-in mice. In mice with human tau sequence replacing mouse tau, template matching enhanced neuritic tau burden. Human AD brain tau-enriched preparations contained aggregated Aβ, and the Aβ coinjection caused a redistribution of Aβ aggregates in mutant AD model mice. The injection-induced Aβ phenotype was spatially distinct from tau accumulation and could be ameliorated by depleting Aβ from tau extracts. These data suggest that Aβ and tau pathologies propagate by largely independent mechanisms after their initial formation. Altering the activity of the Fyn and Pyk2 (Ptk2b) kinases involved in Aβ-oligomer-induced signaling, or deleting expression of the progranulin and TMEM106B lysosomal proteins, did not alter the somatic tau inclusion burden or spreading. However, mouse aging had a prominent effect to increase the accumulation of neuritic tau after injection of human AD tau seeds into WT mice. These studies refine our knowledge of factors capable of modulating tau spreading.

Keywords: Alzheimer's disease; amyloid-beta; stereotactic injection; tau protein; transgenic mice.


Conflict of interest statement

Conflict of interest S. M. S. is an inventor on a patent application related to the use of Fyn kinase inhibitors in AD and is a cofounder and holds equity interest in Allyx Therapeutics, seeking to develop Alzheimer's therapies. The other authors declare that they have no conflicts of interest with the contents of this article.

Figures

Figure 1
Figure 1
Characterization of tau fibrils extracted from human AD subjects.A, immunoblots for total tau (HT7) and pTau-Thr231 (AT180) of the tau extracts used in this study (samples were as follows: C: control, A: brain A, B: brain B, AB: 1:1 mixture of brain A and B extracts, D: brain D, and Dconc: 10× concentrated brain D). B, overview of total protein and total tau concentration in each extract. Total protein concentration was evaluated by measuring absorption at 280 nm on a spectrophotometer. Total tau concentration was calculated by comparing densitometric quantifications of total tau (HT7) immunoblots to a dilution curve of recombinant tau (2N4R isoform). C, immunoblots for total tau (HT7) and pTau-Thr231 (AT180) for samples from brain A, B, and a 1:1 mixture of brain A and B (AB) to assess the tau isoform distribution and phosphorylation over a 60-h time course with measurements taken every 12 h. D, tau extracts were diluted in PBS to a concentration of 5 μg/ml, and 5 × 5 μm images were taken by atomic force microscopy (the scale bar represents 0.5 μm). Fibril length was quantified using Gwyddion. N(A) = 219 fibrils from two images, N(B) = 260 fibrils from three images, N(AB) = 494 fibrils from three images, N(D) = 116 fibrils from two images, and N(Dconc) = 225 fibrils from two images. E, primary mouse neurons were seeded at 50,000 to 75,000 density, treated with 0.25% (v/v) human tau extracts at DIV 7 and incubated until DIV 21 (the scale bar represents 50 μm). Cells were fixed in ice-cold methanol and stained for MAP2 and mouse tau (T49). Tau seeding was measured by quantifying the percent area occupied by aggregated mouse tau within MAP2-positive area using ImageJ. Statistics: Brown–Forsythe ANOVA test (F = 43.85; p < 0.0001) with Dunnett's multiple comparisons test to compare all groups to control-treated cells. N = 8 images per condition. ∗p < 0.05, ∗∗p < 0.01, ∗∗∗p < 0.005, and ∗∗∗∗p < 0.0001. AD, Alzheimer's disease; DIV, days in vitro.
Figure 2
Figure 2
Injecting tau extracts into WT mice results in tau deposition and spreading in hippocampus and cortex.A, experimental time line of mouse injections. Mice were injected unilaterally (right hemisphere) at 3 months of age with either control or AD brain tau extract. Per animal, 5 μl of tau extract were injected distributed over two injection sites (2.5 μl/site). After injection, mice were housed under regular conditions for 6 months and then killed by perfusion. B, example pictures of AT8b-DAB + Nissl stain sections that were analyzed and sagittal schematic indicating injection site in pink and analyzed section location in blue. Section 1 is located anterior (from Bregma: ML +2.0 mm, AP −2.0) to the injection sites (from Bregma: anterior–posterior −2.5 mm; medial–lateral 2 mm; dorsoventral −2.4 mm [for hippocampus] and dorsoventral −1.4 mm [for cortex]), section 2 is located posterior (ML +2.0 mm, AP −2.9) to the injection sites (the scale bar represents 1 mm). C, from left to right: magnified images of section 1 contralateral and ipsilateral hippocampus (the scale bar represents 0.5 mm). Example images of somatic inclusions quantified in this study (the scale bar represents 25 μm). Example images of neuritic inclusions quantified in this study (the scale bar represents 25 μm). D, mean number of somatic inclusions per brain region on the ipsilateral hemisphere of WT animals injected with control or AD tau extracts. Inclusions were counted manually in ImageJ with the Cell Counter Tool. Statistics: Ordinary two-way ANOVA test (interaction: F(9, 841) = 8.431, p < 0.0001; row factor: F(9, 841) = 9.852, p < 0.0001; column factor: F(1, 841) = 72.28, p < 0.0001) with Sidak's multiple comparisons test. N represents individual animals. N(control) = 27 and 28, N(AD) = 60. ∗∗p < 0.01, ∗∗∗∗p < 0.0001. E, mean number of somatic inclusions on the ipsilateral hemisphere in animals injected with tau extracts extracted from different AD brains. Statistics: Kruskal–Wallis test (approximate p: 0.0008, Kruskal–Wallis statistic: 18.91) with Dunn's multiple comparisons. N represents individual animals. N(A) = 10, N(B) = 9, N(AB) = 28, N(D) = 7, and N(Dconc) = 6. ∗p < 0.05, ∗∗p < 0.01. F, coronal section schematics of mean somatic inclusion burden in ipsilateral and contralateral brain regions dependent on injected tau extract. Brain regions not analyzed are depicted in gray. Ipsilateral hemisphere is on the right. G, area occupied by neuritic inclusions in four regions of animals injected with tau extracts from different AD brains. Statistics: Ordinary two-way ANOVA (for dorsal hippocampus—interaction: F(5, 144) = 9.266, p < 0.0001; row factor: F(5, 144) = 9.041, p = 0.0001; column factor: F(1, 144) = 95.96, p < 0.0001; for ventral hippocampus—interaction: F(5, 121) = 2.191, p = 0.0596; row factor: F(5, 121) = 2.120, p = 0.0675; column factor: F(1, 121) = 21.06, p < 0.0001; for fimbria—interaction: F(5, 144) = 6.743, p < 0.0001; row factor: F(5, 144) = 11.41, p = 0.0001; column factor: F(1, 144) = 33.45, p < 0.0001; for corpus callosum—interaction: F(5, 137) = 3.679, p = 0.0037; row factor: F(5, 137) = 18.48, p < 0.0001; column factor: F(1, 137) = 12.78, p = 0.0005) with Sidak's multiple comparisons test. In gray: comparing ipsilateral and contralateral hemisphere for the same injected extract. In black: comparing ipsilateral values of different tau extract–injected groups. N represents individual animals. N(control) = 8 and 9, N(A) = 9 and 10, N(B) = 8 and 9, N(AB) = 30 to 39, N(D) = 6 and 7, and N(Dconc) = 6. ∗p < 0.05, ∗∗p < 0.01, ∗∗∗p < 0.005, and ∗∗∗∗p < 0.0001. AD, Alzheimer's disease.
Figure 3
Figure 3
Aβ copathology has no impact on tau inclusion burden or spreading, but the presence of humanized tau (hTau) enhances tau deposition.A, mean number of somatic inclusions in different ipsilateral brain regions of animals injected with tau extracts extracted from control or AD brains. C = control, W = WT, A = APP, hT = hTau, and DK = DKI. Statistics: Kruskal–Wallis test (for dorsal hippocampus (HC)—approximate p value = 0.0155, Kruskal–Wallis statistic = 10.39; for ventral HC—approximate p value = 0.4352, Kruskal–Wallis statistic = 2.730; for RSA—approximate p value = 0.0155, Kruskal–Wallis statistic = 10.39; for motor cortex (Cx)—approximate p value = 0.8045, Kruskal–Wallis statistic = 0.9867; for posterior parietal—approximate p value = 0.6084, Kruskal–Wallis statistic = 1.83; for primary somatosensory Cx—approximate p value = 0.1169, Kruskal–Wallis statistic = 5.894; for auditory Cx—approximate p value = 0.2602, Kruskal–Wallis statistic = 4.012; for ectorhinal and perirhinal Cx—approximate p value = 0.1885, Kruskal–Wallis statistic = 4.781; for entorhinal Cx—approximate p value = 0.4783, Kruskal–Wallis statistic = 2.484; for piriform Cx—approximate p value = 0.1606, Kruskal–Wallis statistic = 5.158) with Dunn's multiple comparisons test. N represents individual animals. N(WT-C) = 9 and 10, N(WT-AD) = 14 and 15, N(APP-C) = 4, N(APP-AD) = 8 and 9, N(hT-C) = 4, N(hT-AD) = 3, N(DK-C) = 5, and N(DK-AD) = 7. ∗p < 0.05. B, schematics of mean somatic inclusion burden of AD tau extract–injected animals dependent on mouse genotype. Brain regions not analyzed are depicted in gray. Ipsilateral hemisphere is on the right. C, area occupied by neuritic inclusions in four brain regions of animals injected with control or AD tau extracts. Statistics: Ordinary two-way ANOVA (for dorsal hippocampus—interaction: F(7, 88) = 8.073, p < 0.0001; row factor: F(7, 88) = 7.714, p < 0.0001; column factor: F(1, 88) = 38.19, p < 0.0001; for ventral hippocampus—interaction: F(6, 62) = 8.017, p < 0.0001; row factor: F(6, 62) = 7.733, p < 0.0001; column factor: F(1, 62) = 30.04, p < 0.0001; for fimbria—interaction: F(7, 90) = 7.293, p < 0.0001; row factor: F(7, 90) = 7.084, p < 0.0001; column factor: F(1, 90) = 24.14, p < 0.0001; for corpus callosum—interaction: F(7, 83) = 4.807, p = 0.0001; row factor: F(7, 83) = 4.837, p = 0.0001; column factor: F(1, 83) = 13.40, p = 0.0004) with Sidak's multiple comparisons test. In gray: comparing ipsilateral and contralateral hemisphere for the same injected extract. In black: comparing ipsilateral values of different tau extract–injected groups. N represents individual animals. N(WT-C) = 9 and 10, N(WT-AD) = 14 and 15, N(APP-C) = 4, and N(APP-AD) = 5 to 9, N(hT-C) = 0 to 4, N(hT-AD) = 3 and 4, N(DK-C) = 5, and N(DK-AD) = 5 and 6. ∗p < 0.05, ∗∗p < 0.01, ∗∗∗p < 0.005, and ∗∗∗∗p < 0.0001. D, representative images of neuritic inclusions in fimbria and hippocampus (the scale bars represent 50 μm [hTau] and 25 μm [hTau-Zoom]). E, representative images of GFAP staining in the ipsilateral hemisphere hippocampus (DG) and cortex (layers I–III). Images were taken with a 20× objective (the scale bar represents 50 μm), for quantification, see Fig. S2D. F, representative images of CD68 staining in the ipsilateral hemisphere hippocampus (DG) and cortex (layers I–III). Images were taken with a 20× objective (the scale bar represents 50 μm), for quantification, see Fig. S2E. AD, Alzheimer's disease; APP, amyloid precursor protein; DKI, double KI; RSA, retrosplenial area.
Figure 4
Figure 4
Aβ in tau extracts leads to a redistribution of nondense core plaque Aβ on ipsilateral hemisphere.A, immunoblot of control (C) and brain A/B extract probed for Aβ with D54D2 antibody and compared with different amounts of synthetic biotinylated-Aβo. Samples were boiled for 5 min at 95 °C with 10% BME. B, quantification of the mean percent area occupied by D54D2-positive and ThioS-positive dense core plaques in the hippocampus of control and AD brain–injected mice was measured by drawing ROIs around the brain region and thresholding images. Representative images can be found in C and Fig. S3A. Statistics: Ordinary two-way ANOVA (for D54D2—interaction: F(5, 43) = 5.939, p = 0.0003; row factor: F(5, 43) = 12.25, p < 0.0001; column factor: F(1, 43) = 11.62, p = 0.0014; for ThioS—interaction: F(5, 43) = 0.4724, p = 0.7947; row factor: F(5, 43) = 5.546, p = 0.0005; column factor: F(1, 43) = 0.09148, p = 0.7638) with Sidak's multiple comparisons test comparing ipsilateral and contralateral hemisphere within each group shown in black and Sidak's multiple comparisons test comparing ipsilateral hemispheres between control and AD-injected mice shown in gray. N represents individual animals. N(APP-C) = 4, N(APP-AD) = 5, N(hT-C) = 4, N(hT-AD) = 3, N(DKI-C) = 4, and N(DKI-AD) = 7. ∗p < 0.05, ∗∗∗∗p < 0.0001. C, immunofluorescent staining with D54D2 (magenta) antibody for amyloid-β and thioflavin S (green) for dense-core amyloid-β plaques of APP and DKI mice injected with AD brain tau extracts (the scale bar represents 1 mm). D, representative images of D54D2 (magenta) and ThioS (green) staining taken with a 20× objective (the scale bar represents 50 μm). Schematic on the left indicates the location of images in the brain. E, quantification of D54D2 staining seen in D. For quantification of ThioS staining, see Fig. S3B. Statistics: Ordinary two-way ANOVA (for region 1—interaction: F(1, 13) = 2.449, p = 0.1416; row factor: F(1, 13) = 3.066, p = 0.1035; column factor: F(1, 13) = 3.131, p = 0.1002; For region 2—interaction: F(1, 14) = 2.309, p = 0.1509; row factor: F(1, 14) = 5.332, p = 0.0367; column factor: F(1, 14) = 2.655, p = 0.1255; region 3—interaction: F(1, 14) = 2.701, p = 0.1225; row factor: F(1, 14) = 3.560, p = 0.0801; column factor: F(1, 14) = 2.609, p = 0.1285; region 4—interaction: F(1, 14) = 0.005899, p = 0.9399; row factor: F(1, 14) = 0.8148, p = 0.3820; column factor: F(1, 14) = 1.500, p = 0.2410; region 5—interaction: F(1, 14) = 0.5541, p = 0.4690; row factor: F(1, 14) = 0.5692, p = 0.4631; column factor: F(1, 14) = 0.0001762, p = 0.9896; region 6—interaction: F(1, 14) = 7.892, p = 0.0139; row factor: F(1, 14) = 8.591, p = 0.0109; column factor: F(1, 14) = 8.843, p = 0.0100; region 7—interaction: F(1, 14) = 1.918, p = 0.1877; row factor: F(1, 14) = 4.515, p = 0.0519; column factor: F(1, 14) = 2.662, p = 0.1251; region 8—interaction: F(1, 14) = 0.3087, p = 0.5879; row factor: F(1, 14) = 1.470, p = 0.2470; column factor: F(1, 14) = 0.02451, p = 0.8780) with Sidak's multiple comparisons test comparing ipsilateral and contralateral hemisphere within each injection and ipsilateral results across injections. N represents individual animals. N(APP-C) = 4, N(APP-AD) = 4 and 5. ∗p < 0.05, ∗∗p < 0.01. AD, Alzheimer's disease; APP, amyloid precursor protein; DKI, double KI.
Figure 5
Figure 5
Immunodepleting Aβ from tau extracts ameliorates Aβ redistribution.A, immunoblots of tau extracts that had been incubated with D54D2 antibody conjugated to Protein G magnetic beads to remove Aβ from tau extracts. Blots shown were probed for Aβ (D54D2) to assess the removal of Aβ from the extracts. Bands shown were run on the same blot but not next to each other, and vertical black lines indicate splicing of the blot. U = untreated samples, D = D54D2-incubated samples. B, mean number of somatic inclusions on the ipsilateral hemisphere of animals injected with control (C) or AD brain tau extracts, or with control or AD brain tau extracts that had been cleared of Aβ by incubating samples with D54D2 antibody conjugated to Protein G beads (C-D and AD-D samples). Statistics: Kruskal–Wallis test (approximate p value = 0.0176, Kruskal–Wallis statistic = 16.97) with Dunn's multiple comparisons test. N represents individual animals. N(WT-C) = 4, N(WT-C-D) = 4, N(WT-AD) = 8, N(WT-AD-D) = 7, N(APP-C) = 2, N(APP-C-D) = 1, N(APP-AD) = 8, and N(APP-AD-D) = 10. ∗p < 0.05. C, schematics of mean somatic inclusion burden of tau extract (extracted from AD brains, with or without Aβ removal)–injected animals dependent on mouse genotype. Brain regions not analyzed are depicted in gray. Ipsilateral hemisphere is on the right. D, area occupied by neuritic inclusions in four brain regions of animals injected with control or AD brain–derived tau extracts with and without Aβ removal. Statistics: Ordinary two-way ANOVA (for dorsal hippocampus—interaction: F(7, 68) = 1.680, p = 0.1287; row factor: F(7, 68) = 11.67, p < 0.0001; column factor: F(1, 68) = 1.790, p = 0.1864; for ventral hippocampus—interaction: F(7, 70) = 0.06833, p = 0.9995; row factor: F(7, 70) = 3.114, p = 0.0064; column factor: F(1, 70) = 0.07003, p = 0.7921; for fimbria—interaction: F(7, 61) = 0.7205, p = 0.6550; row factor: F(7, 61) = 1.275, p = 0.2777; column factor: F(1, 61) = 2.317, p = 0.1331; for corpus callosum—interaction: F(7, 67) = 0.2680, p = 0.9573; row factor: F(7, 67) = 1.825, p = 0.0967; column factor: F(1, 67) = 0.5514, p = 0.4603) with Sidak's multiple comparisons test. In gray: comparing ipsilateral and contralateral hemisphere for the same genotype and injected extract. In black: comparing ipsilateral values of different tau extract–injected groups. N(WT-C) = 4, N(WT-C-D) = 2, N(WT-AD) = 8, N(WT-AD-D) = 6 and 7, N(APP-C) = 2, N(APP-C-D) = 1, N(APP-AD) = 8, and N(APP-AD-D) = 10. ∗p < 0.05, ∗∗p < 0.01, ∗∗∗p < 0.005, and ∗∗∗∗p < 0.0001. E, representative images of the ipsilateral hippocampus with immunofluorescent staining of D54D2 (magenta) antibody for Aβ and ThioS (green) for dense-core amyloid plaques in APP mice injected with AD brain extracts with and without Aβ removal (the scale bars represent 250 μm). F, quantification of the percent area occupied by D54D2 (top) and ThioS (bottom) in the hippocampus of APP mice injected with AD brain extracts with and without Aβ removal. Statistics: Ordinary two-way ANOVA (for D54D2—interaction: F(1, 29) = 0.9156, p = 0.3465; row factor: F(1, 29) = 5.346, p = 0.0281; column factor: F(1, 29) = 10.96, p = 0.0025; for ThioS—interaction: F(1, 32) = 0.2028, p = 0.6555; row factor: F(1, 32) = 0.08193, p = 0.7765; column factor: F(1, 32) = 0.02327, p = 0.8797) with Sidak's multiple comparisons test comparing ipsilateral and contralateral hemisphere within each injection. N represents individual animals. N(APP-AD) = 8, N(APP-AD-D) = 8 to 10. ∗p < 0.05. AD, Alzheimer's disease; APP, amyloid precursor protein; DKI, double KI.
Figure 6
Figure 6
Ptk2b−/−or pharmacological inhibition of Fyn have no impact on tau spreading.A, mice in the WT versus Ptk2b−/− genotype comparison followed the established time line of injection at 3 months of age, waiting period of 6 months, and then tissue collection and analysis. WT animals treated with vehicle or AZD0530 were also injected at 3 months of age and then started on their AZD or vehicle treatment 2 weeks after tau injection. They were kept for 9 months before tissue was collected and analyzed. B, schematics of mean somatic inclusion burden of AD tau extract–injected animals dependent on mouse genotype. Brain regions not analyzed are depicted in gray. Ipsilateral hemisphere is on the right. C, mean number of somatic inclusions in ipsilateral brain regions of animals injected with tau extracts extracted from control or AD brains. C = control, W = WT, PK = Ptk2b−/−, V = vehicle treated, AZD = AZD0530 treated. Statistics: Kruskal–Wallis test (for dorsal HC—approximate p value = 0.563, Kruskal–Wallis statistic = 2.046; for ventral HC—approximate p value = 0.0153, Kruskal–Wallis statistic = 10.43; for RSA—approximate p value = 0.5301, Kruskal–Wallis statistic = 2.209; for motor cortex (Cx)—approximate p value = 0.3049, Kruskal–Wallis statistic = 3.625; for posterior parietal—approximate p value = 0.0217, Kruskal–Wallis statistic = 9.663; for primary somatosensory Cx—approximate p value = 0.0908, Kruskal–Wallis statistic = 6.472; for auditory Cx—approximate p value = 0.0209, Kruskal–Wallis statistic = 9.743; for ectorhinal and perirhinal CX—approximate p value = 0.0077, Kruskal–Wallis statistic = 11.9; for entorhinal Cx—approximate p value = 0.8443, Kruskal–Wallis statistic = 0.8217; for piriform Cx—approximate p value = 0.8054, Kruskal–Wallis statistic = 0.9828) with Dunn's multiple comparisons test. N represents individual animals. N(WT-C) = 5, N(WT-AD) = 6, N(PK-C) = 5, N(PK-AD) = 5, N(WT-AD-V) = 8 to 10, and N(WT-AD-AZD) = 9. ∗p < 0.05, ∗∗p < 0.01. D, area occupied by neuritic inclusions in four regions of animals injected with tau extracts. Statistics: Ordinary two-way ANOVA (for dorsal hippocampus—interaction: F(5, 66) = 1.122, p = 0.3574; row factor: F(5, 66) = 1.341, p = 0.2580; column factor: F(1, 66) = 8.063, p = 0.0060; for ventral hippocampus—interaction: F(5, 63) = 0.7387, p = 0.5973; row factor: F(5, 63) = 1.155, p = 0.3411; column factor: F(1, 63) = 4.363, p = 0.0408; for fimbria—interaction: F(5, 62) = 5.641, p = 0.0002; row factor: F(5, 62) = 6.684, p < 0.0001; column factor: F(1, 62) = 12.88, p = 0.0007; for corpus callosum—interaction: F(5, 63) = 0.7336, p = 0.6010; row factor: F(5, 63) = 5.642, p = 0.0002; column factor: F(1, 63) = 1.505, p = 0.2244) with Sidak's multiple comparisons test. In gray: comparing ipsilateral and contralateral hemisphere of the same genotype and injected extract. In black: comparing ipsilateral values of different AD tau extract–injected groups. N represents individual animals. N(WT-C) = 5, N(WT-AD) = 6, N(PK-C) = 5, N(PK-AD) = 5, N(WT-AD-V) = 8 to 10, and N(WT-AD-AZD) = 8 and 9. ∗p < 0.05, ∗∗p < 0.01. E, representative images of neuritic inclusions in the fimbria (the scale bar represents 50 μm). AD, Alzheimer's disease; APP, amyloid precursor protein; DKI, double KI; RSA, retrosplenial area.
Figure 7
Figure 7
Grn−/−and Tmem106b−/−do not impact tau spreading, but advanced mice age exacerbates contralateral hippocampal inclusions and neuritic tau deposition.A, WT and Grn−/− mice were injected according to the time line previously described. Aged WT and Tmem106b−/− mice were injected at 19 months of age instead of 3 months of age and then followed the same time line of 6-month waiting period, followed by mice perfusion, tissue collection, and analysis. B, schematics of mean somatic inclusion burden of control and AD tau extract–injected animals dependent on mouse genotype and age at injection. Brain regions not analyzed are depicted in gray. Ipsilateral hemisphere is on the right. C, mean number of somatic inclusions in ipsilateral brain regions of animals injected with tau extracts from control or AD brains. C = control, W = WT, G = Grn−/−, AW = aged WT, and T = Tmem106b−/−. Statistics: Kruskal–Wallis test (for dorsal HC—approximate p value = 0.3227, Kruskal–Wallis statistic = 3.485; for ventral HC—approximate p value = 0.5686, Kruskal–Wallis statistic = 2.018; for RSA—approximate p value = 0.6358, Kruskal–Wallis statistic = 1.705; for entorhinal Cx—approximate p value = 0.9075, Kruskal–Wallis statistic = 0.5511) with Dunn's multiple comparisons test comparing AD-injected groups. N represents individual animals. N(WT-C) = 4, N(WT-AD) = 8, N(G-C) = 7, N(G-AD) = 12, N(AWT-C) = 6, N(AWT-AD) = 7, N(T-C) = 4, and N(T-AD) = 7. D, representative images of ventral hippocampi of animals injected with control or AD tau extracts (the scale bar represents 50 μm). E, area occupied by neuritic inclusions in four brain regions of animals injected with control or AD brain–derived tau extracts. Statistics: Ordinary two-way ANOVA (for dorsal hippocampus—interaction: F(7, 91) = 3.335, p = 0.0033; row factor: F(7, 91) = 3.823, p = 0.0011; column factor: F(1, 91) = 32.08, p < 0.0001; for ventral hippocampus—interaction: F(7, 83) = 5.547, p < 0.0001; row factor: F(7, 83) = 5.329, p < 0.0001; column factor: F(1, 83) = 32.05, p < 0.0001; for fimbria—interaction: F(7, 94) = 10.82, p < 0.0001; row factor: F(7, 94) = 11.02, p < 0.0001; column factor: F(1, 94) = 59.22, p < 0.0001; for corpus callosum—interaction: F(7, 94) = 2.355, p = 0.0292; row factor: F(7, 94) = 5.079, p < 0.0001; column factor: F(1, 94) = 12.36, p = 0.0007) with Sidak's multiple comparisons test. In gray: comparing ipsilateral and contralateral hemisphere for the same injected extract and genotype. In black: comparing ipsilateral values of AD tau extract–injected groups. N represents individual animals. N(WT-C) = 4, N(WT-AD) = 8, N(G-C) = 7, N(G-AD) = 12, N(AWT-C) = 6, N(AWT-AD) = 7, N(T-C) = 4, and N(T-AD) = 7. ∗p < 0.05, ∗∗p < 0.01, ∗∗∗p < 0.005, and ∗∗∗∗p < 0.0001. F, representative images of fimbria and corpus callosum neuritic tau inclusions (the scale bars represent 50 μm). AD, Alzheimer's disease; RSA, retrosplenial area.

References

    1. Brookmeyer R., Johnson E., Ziegler-Graham K., Arrighi H.M. Forecasting the global burden of Alzheimer's disease. Alzheimers Dement. 2007;3:186–191. - PubMed
    1. Alzheimer's Association 2021 Alzheimer's disease facts and figures. Alzheimers Dement. 2021;17:327–406. - PubMed
    1. Tapia-Rojas C., Cabezas-Opazo F., Deaton C.A., Vergara E.H., Johnson G.V.W., Quintanilla R.A. It's all about tau. Prog. Neurobiol. 2019;175:54–76. - PMC - PubMed
    1. Lee V.M., Goedert M., Trojanowski J.Q. Neurodegenerative tauopathies. Annu. Rev. Neurosci. 2001;24:1121–1159. - PubMed
    1. Kurt M.A., Davies D.C., Kidd M. Paired helical filament morphology varies with intracellular location in Alzheimer's disease brain. Neurosci. Lett. 1997;239:41–44. - PubMed

Publication types