. 2021 Sep 21;10(18):e021345.
doi: 10.1161/JAHA.120.021345. Epub 2021 Sep 6.

Associations Between Clinical Outcomes and a Recently Proposed Adult Congenital Heart Disease Anatomic and Physiological Classification System

Affiliations

Associations Between Clinical Outcomes and a Recently Proposed Adult Congenital Heart Disease Anatomic and Physiological Classification System

Cara L Lachtrupp et al. J Am Heart Assoc. .

Abstract

Background American Heart Association and American College of Cardiology consensus guidelines introduce an adult congenital heart disease anatomic and physiological (AP) classification system. We assessed the association between AP classification and clinical outcomes. Methods and Results Data were collected for 1000 outpatients with ACHD prospectively enrolled between 2012 and 2019. AP classification was assigned based on consensus definitions. Primary outcomes were (1) all-cause mortality and (2) a composite of all-cause mortality or nonelective cardiovascular hospitalization. Cox regression models were developed for AP classification, each component variable, and additional clinical models. Discrimination was assessed using the Harrell C statistic. Over a median follow-up of 2.5 years (1.4-3.9 years), the composite outcome occurred in 185 participants, including 49 deaths. Moderately or severely complex anatomic class (class II/III) and severe physiological stage (stage D) had increased risk of the composite outcome (AP class IID and IIID hazard ratio, 4.46 and 3.73, respectively, versus IIC). AP classification discriminated moderately between patients who did and did not suffer the composite outcome (C statistic, 0.69 [95% CI, 0.67-0.71]), similar to New York Heart Association functional class and NT-proBNP (N-terminal pro-B-type natriuretic peptide); it was more strongly associated with mortality (C statistic, 0.81 [95% CI, 0.78-0.84]), as were NT-proBNP and functional class. A model with AP class and NT-proBNP provided the strongest discrimination for the composite outcome (C statistic, 0.73 [95% CI, 0.71-0.75]) and mortality (C statistic, 0.85 [95% CI, 0.82-0.88]). Conclusions The addition of physiological stage modestly improves the discriminative ability of a purely anatomic classification, but simpler approaches offer equivalent prognostic information. The AP system may be improved by addition of key variables, such as circulating biomarkers, and by avoiding categorization of continuous variables.

Keywords: adult congenital heart disease; classification; cohort study; congenital heart disease; guidelines; mortality; outcomes.


Conflict of interest statement

None.

Figures
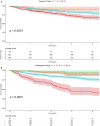
Figure 1
Figure 1. Kaplan‐Meier curves depicting survival free from a composite clinical outcome of death or nonelective cardiovascular hospitalization according to anatomic class and physiological stage.
Kaplan‐Meier curves of survival free of the composite outcome by (A) anatomic class and (B) physiological stage. Curves are compared using the log‐rank test. Shaded regions indicate 95% CIs.
Figure 2
Figure 2. Receiver operating characteristic (ROC) curves comparing the anatomic and physiological classification and other clinical models for the composite outcome of death or nonelective cardiovascular hospitalization within 1 year after enrollment.
ROC curves for anatomic and physiological classification, physiological stage, anatomic class, New York Heart Association functional class (NYHA FC), the Bethesda classification, and imputed NT‐proBNP (N‐terminal proB‐type natriuretic peptide). The grey line indicates area under the curve=0.5. There were 872 participants with follow‐up time ≥1 year or an event within the first year, with a total of 84 events by 1 year. The ROC curve plotted for NT‐proBNP is based on the 10th complete imputed data set; however, the area under the curve presented was calculated using all 20 imputed data sets. Area under the curve for each model is as follows in ascending order: AnatC=0.58, Bethesda classification=0.61, PhyS=0.67, NYHA FC=0.69, AP=0.69, and NT‐proBNP=0.75 (averaged across 20 imputed data sets). AnatC indicates anatomic class; AP, anatomic and physiological; and PhyS, physiological stage.
Figure 3
Figure 3. Concordance statistics for AP classification and other clinical predictors for (A) the composite outcome of all‐cause death or nonelective cardiovascular hospitalization and (B) all‐cause mortality.
C, The C statistics for individual variables used to define physiological stage, for the primary composite outcome of all‐cause mortality or nonelective cardiovascular hospitalization, either the categorical variables used to assign physiological stage (PhyS) (designated by [PhyS]) or, when applicable, the equivalent continuous variables. D, The equivalent data for all‐cause mortality. Error bars represent 95% CI. The green dashed line indicates the C statistic for overall AP class, 0.69 for the composite outcome (A and C), and 0.81 for mortality (B and D). NT‐proBNP (N‐terminal pro‐B‐type natriuretic peptide) estimates are based on the multiply imputed data. Multivariable modeling was not performed with peak oxygen consumption as a covariate given >30% missing data. AnatC indicates anatomic class; AP, anatomic and physiological classification system; NYHA, New York Heart Association; and NYHA FC, New York Heart Association functional class.
Figure 4
Figure 4. Distribution of the individual component variables of physiological stage for subjects classified as overall physiological stage B, C, or D.
Individual physiological variables were assessed for each participant according the anatomic and physiological consensus definitions. Subjects were assigned physiological stage according to their single worst variable. Component variable assignment is presented for subjects classified as physiological stages B, C, or D. For example, of the 574 physiological stage C patients, only 16 met physiological stage C criteria by NYHA functional class (ie, functional class III), whereas the other 558 met A or B criteria (ie, NYHA functional class I or II). Patients classified as physiologic stage B cannot have either venous/arterial stenosis or pulmonary hypertension; these variables are omitted from the top panel. NYHA indicates New York Heart Association. N/A indicates not applicable, in instances where there are missing data.

References

    1. Willems R, Werbrouck A, De Backer J, Annemans L. Real‐world healthcare utilization in adult congenital heart disease: a systematic review of trends and ratios. Cardiol Young. 2019;29:553–563. DOI: 10.1017/S1047951119000441. - DOI - PubMed
    1. Gilboa SM, Devine OJ, Kucik JE, Oster ME, Riehle‐Colarusso T, Nembhard WN, Xu P, Correa A, Jenkins K, Marelli AJ. Congenital heart defects in the United States: estimating the magnitude of the affected population in 2010. Circulation. 2016;134:101–109. DOI: 10.1161/CIRCULATIONAHA.115.019307. - DOI - PMC - PubMed
    1. Agarwal A, Dudley CW, Nah G, Hayward R, Tseng ZH. Clinical outcomes during admissions for heart failure among adults with congenital heart disease. J Am Heart Assoc. 2019;8:e012595. DOI: 10.1161/JAHA.119.012595. - DOI - PMC - PubMed
    1. Marelli AJ, Ionescu‐Ittu R, Mackie AS, Guo L, Dendukuri N, Kaouache M. Lifetime prevalence of congenital heart disease in the general population from 2000 to 2010. Circulation. 2014;130:749–756. DOI: 10.1161/CIRCULATIONAHA.113.008396. - DOI - PubMed
    1. O’Leary JM, Siddiqi OK, de Ferranti S, Landzberg MJ, Opotowsky AR. The changing demographics of congenital heart disease hospitalizations in the United States, 1998 through 2010. JAMA. 2013;309:984–986. DOI: 10.1001/jama.2013.564. - DOI - PubMed

Publication types