. 2021 Aug 18:12:675443.
doi: 10.3389/fphar.2021.675443. eCollection 2021.

Rejuvenation of Helicobacter pylori-Associated Atrophic Gastritis Through Concerted Actions of Placenta-Derived Mesenchymal Stem Cells Prevented Gastric Cancer

Affiliations

Rejuvenation of Helicobacter pylori-Associated Atrophic Gastritis Through Concerted Actions of Placenta-Derived Mesenchymal Stem Cells Prevented Gastric Cancer

Jong Min Park et al. Front Pharmacol. .

Abstract

Chronic Helicobacter pylori infection causes gastric cancer via the progression of precancerous chronic atrophic gastritis (CAG). Therefore, repairing gastric atrophy could be a useful strategy in preventing H. pylori-associated gastric carcinogenesis. Although eradication of the bacterial pathogen offers one solution to this association, this study was designed to evaluate an alternative approach using mesenchymal stem cells to treat CAG and prevent carcinogenesis. Here, we used human placenta-derived mesenchymal stem cells (PD-MSCs) and their conditioned medium (CM) to treat H. pylori-associated CAG in a mice/cell model to explore their therapeutic effects and elucidate their molecular mechanisms. We compared the changes in the fecal microbiomes in response to PD-MSC treatments, and chronic H. pylori-infected mice were given ten treatments with PD-MSCs before being sacrificed for end point assays at around 36 weeks of age. These animals presented with significant reductions in the mean body weights of the control group, which were eradicated following PD-MSC treatment (p < 0.01). Significant changes in various pathological parameters including inflammation, gastric atrophy, erosions/ulcers, and dysplastic changes were noted in the control group (p < 0.01), but these were all significantly reduced in the PD-MSC/CM-treated groups. Lgr5+, Ki-67, H+/K+-ATPase, and Musashi-1 expressions were all significantly increased in the treated animals, while inflammatory mediators, MMP, and apoptotic executors were significantly decreased in the PD-MSC group compared to the control group (p < 0.001). Our model showed that H. pylori-initiated, high-salt diet-promoted gastric atrophic gastritis resulted in significant changes in the fecal microbiome at the phylum/genus level and that PD-MSC/CM interventions facilitated a return to more normal microbial communities. In conclusion, administration of PD-MSCs or their conditioned medium may present a novel rejuvenating agent in preventing the progression of H. pylori-associated premalignant lesions.

Keywords: H pylori; cell therapy; chronic atrophic gastritis; inflammation; placenta-derived mesenchymal stem cell; rejuvenation.


Conflict of interest statement

The author KH was employed by the company Medpacto, Inc. The remaining authors declare that the research was conducted in the absence of any commercial or financial relationships that could be construed as a potential conflict of interest.

Figures
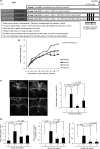
FIGURE 1
FIGURE 1
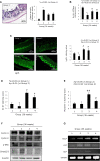
Influence of PD-MSCs or their CM on an H. pylori–initiated, high-salt diet–promoted CAG mice model (36 weeks). (A) Scheme for groups: Group 1, normal control; Group 2, H. pylori–associated CAG disease control; Group 3, disease control treated with 1x10⁶ PD-MSCs (100 μl), 10 times during 22–25 weeks; and Group 4, disease control treated with 10x concentrated CM (200 μl). (B) Body weight changes according to groups. Body weights were measured every 3 days in all mice. (C) Representative photo of the resected stomach and mean gross lesion scores according to groups, see Supplementary Table 1 for the scoring system. (D) Representational pathology and mean pathological scores according to groups, see Supplementary Table 2 for the scoring system. All data represent mean ± SD (n = 10).
FIGURE 2
FIGURE 2
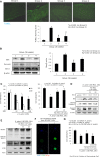
Changes of stemness according to groups relevant to gastric atrophy. (A) Scores for gastric atrophy: left, representational pathology of Group 2 showing significant changes of CAG featured with a loss of parietal cells, gastric inflammation, and a loss of gastric glands with some foci of erosions; right, scores according to groups. See Supplementary Table 2 for the scoring system. (B) Immunohistochemical staining of the proton pump with antibody of H+/K+-ATPase. (C) Confocal staining with LGR5+ antibody: left, representational staining with LGR5+, x100 magnification; right, mean scoring according to groups. (D) Immunohistochemical staining of Ki-67 antibody and the mean positive scoring according to groups. (E) Immunohistochemical staining of Musashi-1 antibody and the mean positive scoring according to groups. (F) Western blot for cell cycle, ERK among MAPK, and smad2/3. (G) RT-PCR for PDGF, FGF, and HGF mRNA. All data represent mean ± SD (n = 10).
FIGURE 3
FIGURE 3
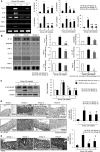
Apoptotic status according to groups. (A) TUNEL staining with apoptotic index according to groups, x100 magnification. (B) Western blot for apoptotic executors, Bax, surviving, and Bcl-2. (C) Changes of RGM-1 cells’ viability after H. pylori infection in a different time point and different POI in a transwell co-culture system. Cell counting using a hemocytometer and trypan blue for measuring cell viability was done after 24 hr of H. pylori infection in the absence or presence of PD-MSCs. (D) Western blot for apoptotic executors in the presence or absence of PD-MSCs under H. pylori infection, 100 MOI, 24 hr. (E) Western blot for autophagy, Beclin1, cleaved Beclin1, ATG5, and LC3B in the presence or absence of PD-MSCs under H. pylori infection, 100 MOI, 24 hr. (F) Confocal imaging of LC3B after CM administration. (G) Cell viability after PD-MSCs in the presence of H. pylori infection in mock cells and LC3B siRNA transfection. All data represent mean ± SD (n = 10).
FIGURE 4
FIGURE 4
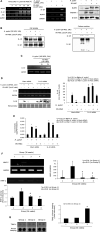
Changes of COX-2 and 15-PGDH according to groups. (A) RT-PCR for COX-2 mRNA and western blot for COX-2. (B) Left: immunohistochemical staining for 15-PGDH, x100 magnification; right: mean expressions according to groups. (C) Western blot for 15-PGDH. All data represent mean ± SD (n = 10).
FIGURE 5
FIGURE 5
Changes of inflammatory mediators according to groups. (A) Left: RT-PCR for IL-1β, IL-6, IL-8, TNF-α, and NOX-1 according to groups; right: mean expressions according to inflammatory genes. (B) Left: protein array for inflammatory proteins including IL-1α, RANTES, IFN-γ, IL-17, IL-6, and TNF-α; right: mean changes of individual inflammatory proteins on the protein array panel. (C) Western blot for p-NF-κB p65 and p-STAT3. (D) Immunohistochemical staining for NF-κB p65 according to groups. (E) Immunohistochemical staining for F4/80 denoting the status of macrophages according to groups, x100 magnification. All data represent mean ± SD (n = 10).
FIGURE 6
FIGURE 6
Inflammasomes relevant to H. pylori infection and PD-MSC influence. (A) Left: RT-PCR for NLRP3, IL-1β, and ASC. RT-PCR for IL-1β and NLRP3 mRNA was repeated in the presence of PD-MSCs in RGM-1 cells using a transwell co-culture system. Right: western blot for NLRP3 and caspase-1 in the presence of PD-MSCs. (B) Western blot for IL-1β and IL-18 in cell lysate and cultured media in the presence of PD-MSCs. (C) IL-10 expressions according to PD-MSC RT-PCR for IL-10 mRNA. (D) IL-1β expression under H. pylori in the presence of PD-MSCs. (E) Left: IL-1β fold changes under H. pylori in the presence of PD-MSCs; right: IL-1β ELISA levels under H. pylori in the presence of PD-MSCs. (F) Upper: RT-PCR for MMP-2; lower: zymography for MMP-2. (G) Protein array for MMP-2. All data represent mean ± SD (n = 10).
FIGURE 7
FIGURE 7
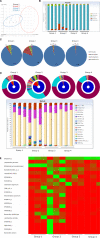
Fecal microbiota changes according to groups. (A) Principal coordinate analysis (PCoA) showing definite discrimination of microbiota according to PD-MSC administration, that is, between PD-MSC–treated and non-treated groups under H. pylori–induced CAG. (B) Phyla changes showing bar display. (C) Phyla level change. (D) Genus level changes with bar display. (E) Heatmap with microbiota nomination.

References

    1. Alzahrani S., Lina T. T., Gonzalez J., Pinchuk I. V., Beswick E. J., Reyes V. E. (2014). Effect ofHelicobacter Pylorion Gastric Epithelial Cells. World. J. Gasteroentrol. 20 (36), 12767–12780. 10.3748/wjg.v20.i36.12767 - DOI - PMC - PubMed
    1. An J. M., Kang E. A., Han Y.-M., Oh J. Y., Lee D. Y., Choi S. H., et al. (2019). Dietary Intake of Probiotic Kimchi Ameliorated IL-6-driven Cancer Cachexia. J. Clin. Biochem. Nutr. 65 (2), 109–117. 10.3164/jcbn.19-10 - DOI - PMC - PubMed
    1. Balic J. J., Saad M. I., Dawson R., West A. J., McLeod L., West A. C., et al. (2020). Constitutive STAT3 Serine Phosphorylation Promotes Helicobacter-Mediated Gastric Disease. Am. J. Pathol. 190 (6), 1256–1270. 10.1016/j.ajpath.2020.01.021 - DOI - PubMed
    1. Broz P., Monack D. M. (2011). Molecular Mechanisms of Inflammasome Activation during Microbial Infections. Immunol. Rev. 243 (1), 174–190. 10.1111/j.1600-065X.2011.01041.x - DOI - PMC - PubMed
    1. Bunpetch V., Wu H., Zhang S., Ouyang H. (2017). From "Bench to Bedside": Current Advancement on Large-Scale Production of Mesenchymal Stem Cells. Stem Cell Develop. 26 (22), 1662–1673. 10.1089/scd.2017.0104 - DOI - PubMed

LinkOut - more resources