. 2021 Aug 13:12:717529.
doi: 10.3389/fphar.2021.717529. eCollection 2021.

Ivermectin has New Application in Inhibiting Colorectal Cancer Cell Growth

Affiliations

Ivermectin has New Application in Inhibiting Colorectal Cancer Cell Growth

Shican Zhou et al. Front Pharmacol. .

Abstract

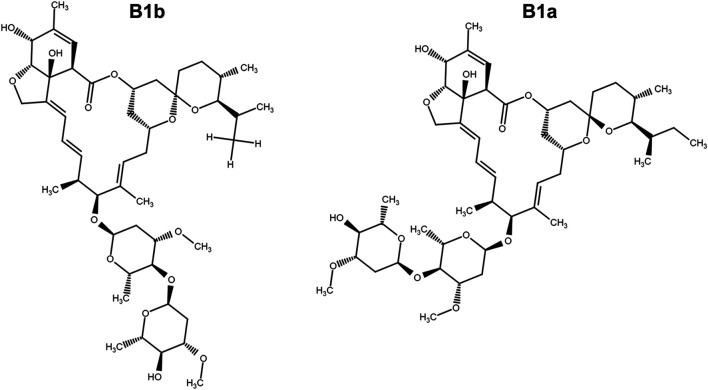
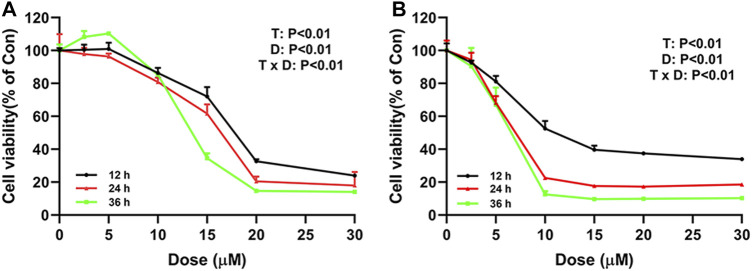
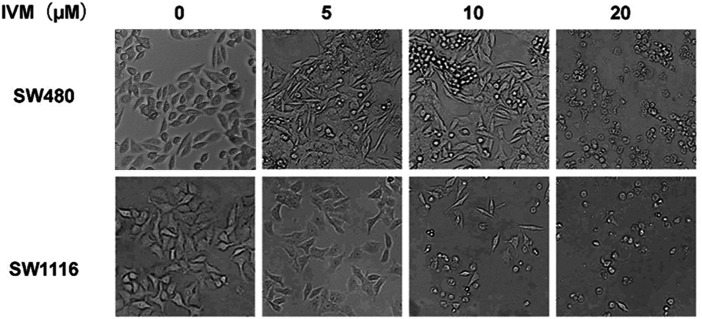
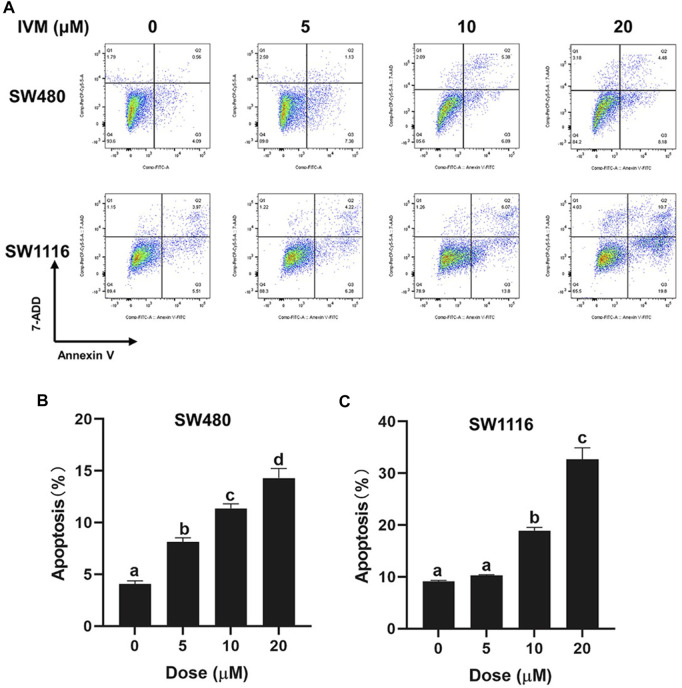
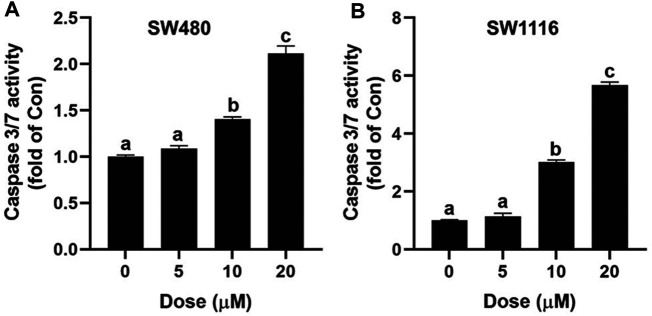
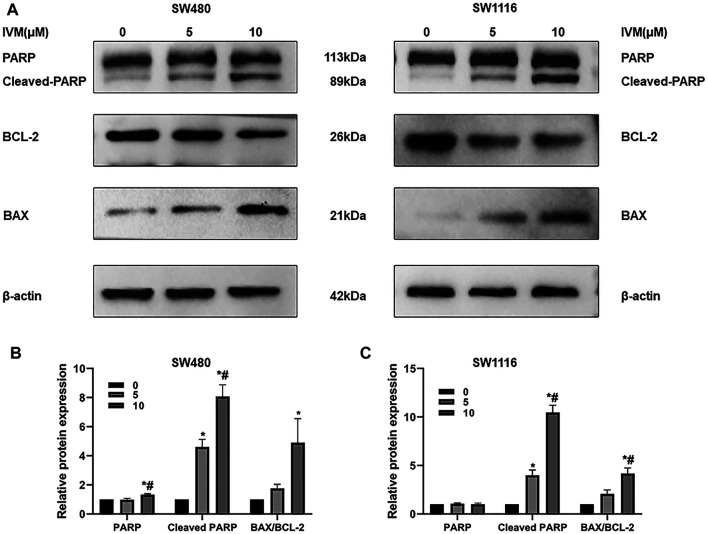
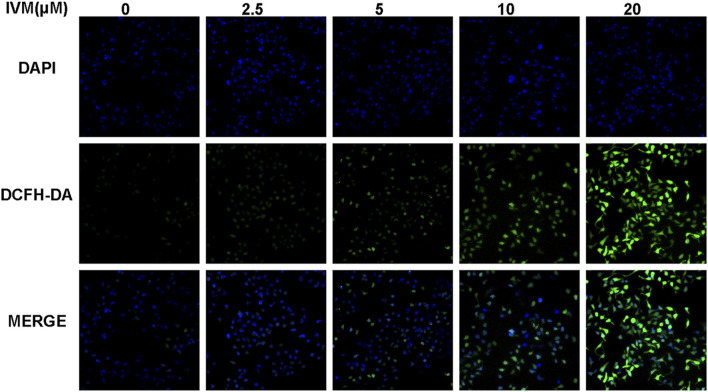
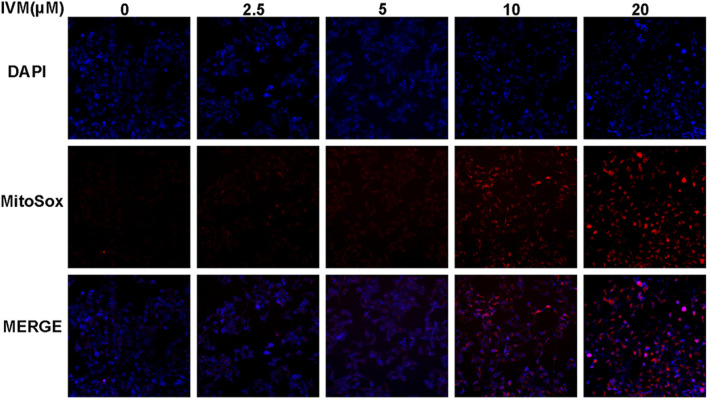
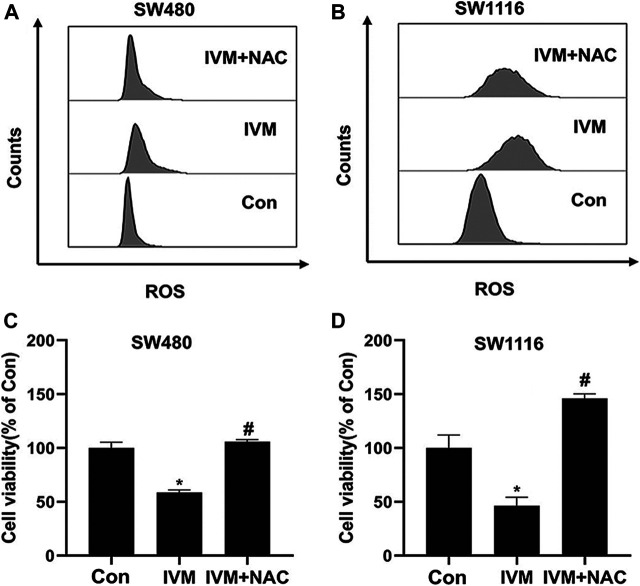
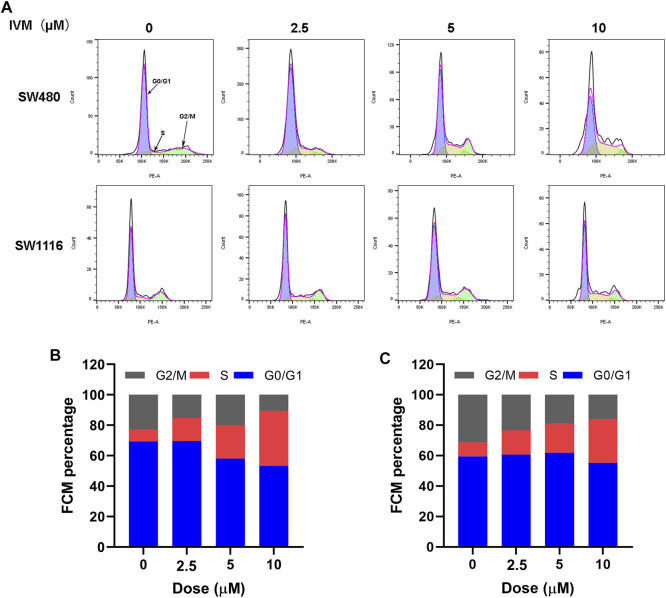
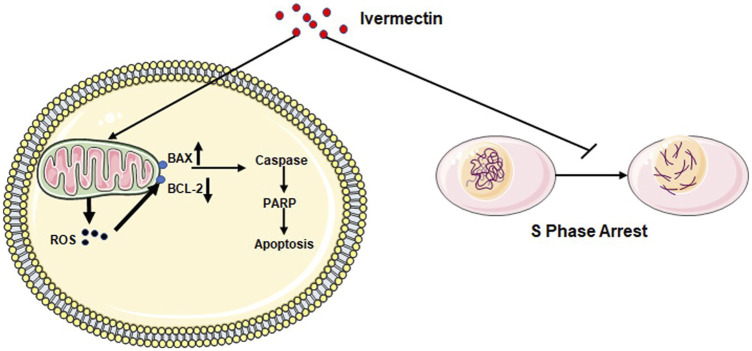
Colorectal cancer (CRC) is the third most common cancer worldwide and still lacks effective therapy. Ivermectin, an antiparasitic drug, has been shown to possess anti-inflammation, anti-virus, and antitumor properties. However, whether ivermectin affects CRC is still unclear. The objective of this study was to evaluate the influence of ivermectin on CRC using CRC cell lines SW480 and SW1116. We used CCK-8 assay to determine the cell viability, used an optical microscope to measure cell morphology, used Annexin V-FITC/7-AAD kit to determine cell apoptosis, used Caspase 3/7 Activity Apoptosis Assay Kit to evaluate Caspase 3/7 activity, used Western blot to determine apoptosis-associated protein expression, and used flow cytometry and fluorescence microscope to determine the reactive oxygen species (ROS) levels and cell cycle. The results demonstrated that ivermectin dose-dependently inhibited colorectal cancer SW480 and SW1116 cell growth, followed by promoting cell apoptosis and increasing Caspase-3/7 activity. Besides, ivermectin upregulated the expression of proapoptotic proteins Bax and cleaved PARP and downregulated antiapoptotic protein Bcl-2. Mechanism analysis showed that ivermectin promoted both total and mitochondrial ROS production in a dose-dependent manner, which could be eliminated by administering N-acetyl-l-cysteine (NAC) in CRC cells. Following NAC treatment, the inhibition of cell growth induced by ivermectin was reversed. Finally, ivermectin at low doses (2.5 and 5 µM) induced CRC cell arrest. Overall, ivermectin suppressed cell proliferation by promoting ROS-mediated mitochondrial apoptosis pathway and inducing S phase arrest in CRC cells, suggesting that ivermectin might be a new potential anticancer drug therapy for human colorectal cancer and other cancers.

Keywords: apoptosis; cell cycle; colorectal cancer; ivermectin; oxidative stress.


Conflict of interest statement

The authors declare that the research was conducted in the absence of any commercial or financial relationships that could be construed as a potential conflict of interest.

Figures

FIGURE 1
FIGURE 1
The chemical structure of ivermectin which is composed of ivermectin B1a (>90%) and ivermectin B1b.
FIGURE 2
FIGURE 2
Ivermectin inhibits cell proliferation of SW480 and SW1116 cells. SW480 (A) and SW1116 cells (B) were cultured at different concentrations of ivermectin (0, 2.5, 5, 10, 15, 20, and 30 μM) for 12, 24, and 36 h, and then CCK-8 assay was performed to detect the cell proliferation. The experiment was repeated three times, and data were presented as mean ± S.E.M. The interaction between dose (D) and time (T) effect were analyzed using two-way ANOVA following Tukey’s t-test. D: dose effect; T: time effect: T × D: the interaction between time and dose effect.
FIGURE 3
FIGURE 3
The effect of ivermectin on the morphology of colorectal cancer cells SW480 and SW1116 cells. Colorectal cancer SW480 (A) and SW1116 (B) cells were treated with different concentrations of ivermectin (0, 5, 10, and 20 μM) for 24 h, and then the cell morphology was determined using an optical microscope (200 ×). This experiment was repeated three times, and representative images were shown. IVM, ivermectin.
FIGURE 4
FIGURE 4
Ivermectin induced apoptosis in colorectal cancer cells. SW480 and SW1116 cells were treated with different concentrations of ivermectin (0, 5, 10, and 20 μM) for 6 h and then were stained, described in the “Materials and Methods” section. The total percentage of apoptosis is equal to the percentage of early apoptosis (Q2, Annexin V+7-AAD-) plus the percentage of late apoptosis (Q3, Annexin V+7-AAD+). Representative images from flow cytometry were shown in (A). Data for SW480 (B) and SW480 (C) cells were summarized and analyzed using one-way ANOVA following Tukey’s t-test. The data are shown as the means ± S.E.M. of three independent experiments. (a–d): same letters, no statistical difference; different letters, the statistical difference (p < 0.05). IVM, ivermectin.
FIGURE 5
FIGURE 5
Effect of ivermectin on Caspase 3/7 in SW480 and SW1116 cells. SW480 (A) and SW1116 (B) cells were treated with different concentrations of ivermectin (0, 5, 10, and 20 μM) for 6 h, and then the Caspase 3/7 activity was measured described in the “Materials and Methods” section. Data were analyzed using one-way ANOVA following Tukey’s t-test. The data are shown as the means ± SD of three independent experiments. (a–c): same letters, no statistical difference; different letters, the statistical difference (p < 0.05). IVM, ivermectin.
FIGURE 6
FIGURE 6
Influence of ivermectin on the Bax, Bcl-2, PARP, and Cleaved-PARP expression in SW480 and SW1116 cells. SW480 and SW1116 cells were treated with indicated concentrations of ivermectin (0, 5, and 10 μM) for 6 h and then were collected to determine the expression of apoptosis-related genes (Bax, Bcl-2, PARP, and Cleaved-PARP) by Western blot assay described as the “Materials and Methods” section. Representative gels for SW480 (A, Left panel) and SW1116 (B, Right panel) cells were shown, and data were summarized from three independent experiments (B and C). The relative value was presented as fold induction to that of the control, which was normalized to β-actin. *p < 0.05, compared with the control group (0 µM); #p < 0.05, compared with the 5 µM group. IVM, ivermectin.
FIGURE 7
FIGURE 7
Ivermectin increased total intracellular ROS generation in SW1116 cells. SW1116 cells were treated with ivermectin at the indicated concentrations (0, 2.5, 5, 10, and 20 μM) for 6 h. Then the cells were co-stained by DCFH-DA and DAPI, described as the “Materials and Methods” section; cells were visualized using a fluorescence microscope. Representative images were shown, and the experiment was repeated three times. IVM, ivermectin.
FIGURE 8
FIGURE 8
Ivermectin increased mitochondrial ROS generation in SW1116 cells. SW1116 cells were treated with ivermectin at the indicated concentrations (0, 2.5, 5, 10, and 20 μM) for 6 h. Then the cells were co-stained by MitoSOX and DAPI, described as the “Materials and Methods” section; cells were visualized using a fluorescence microscope. Representative images were shown, and the experiment was repeated three times. IVM, ivermectin.
FIGURE 9
FIGURE 9
NAC reversed ivermectin-induced ROS and cell death in colorectal cancer cells. After SW480 (A, C) and SW1116 (B, D) cells were pretreated with ROS inhibitor NAC (5 mM) for 1 h and then were cultured in ivermectin (20 μM) for 6 h, they were stained by MitoSOX and detected by flow cytometry. The experiment was repeated three times, and representative histogram images were shown in (A, B). (C) and (D), after SW1116 and SW480 cells, were pretreated with NAC (5 mM) for 1 h and then were cultured in ivermectin (20 μM) for 6 h; the CCK-8 assay was performed to determine the cell viability described as the “Material and Methods” section. The experiment was performed three times with three biological replicates in each group. *p < 0.05, compared with the control group (0 µM).# p < 0.05, compared with the IVM group. IVM, ivermectin; NAC, N-acetyl-l-cysteine.
FIGURE 10
FIGURE 10
Ivermectin resulted in S-phase cell cycle arrest in a dose-dependent manner in colorectal cancer cells. (A) Different concentrations of ivermectin (0, 2.5, 5, 10, and 20 μM) were applied to SW480 and SW1116 cells for 12 h; flow cytometry was used to detect cell cycle changes. Representative cell cycle histograms were shown in (A), and analysis of periodic distribution statistical results was shown in (B) and (C). IVM, ivermectin.
FIGURE 11
FIGURE 11
Diagram of the mechanism of ivermectin inhibiting the proliferation of colorectal cancer cells.

References

    1. Alout H., Foy B. D. (2017). Ivermectin: a Complimentary Weapon against the Spread of Malaria?. Expert Rev. anti-infective Ther. 15, 231–240. 10.1080/14787210.2017.1271713 - DOI - PMC - PubMed
    1. Caly L., Druce J. D., Catton M. G., Jans D. A., Wagstaff K. M., 2020. The FDA-Approved Drug Ivermectin Inhibits the Replication of SARS-CoV-2 In Vitro . Antivir. Res. 178, 104787. 10.1016/j.antiviral.2020.104787 - DOI - PMC - PubMed
    1. Carneiro B. A., El-Deiry W. S. (2020). Targeting Apoptosis in Cancer Therapy. Nat. Rev. Clin. Oncol. 17, 395–417. 10.1038/s41571-020-0341-y - DOI - PMC - PubMed
    1. D'Arcy M. S. (2019). Cell Death: a Review of the Major Forms of Apoptosis, Necrosis and Autophagy. Cel Biol. Int. 43, 582–592. 10.1002/cbin.11137 - DOI - PubMed
    1. Deng F., Xu Q., Long J., Xie H. (2018). Suppressing ROS-TFE3-dependent Autophagy Enhances Ivermectin-Induced Apoptosis in Human Melanoma Cells. J. Cell. Biochem. 120. 1702-1715. 10.1002/jcb.27490 - DOI - PubMed