

Olfactory receptor gene evolution is unusually rapid across Tetrapoda and outpaces chemosensory phenotypic change
- PMID: 34484311
- PMCID: PMC7750991
- DOI: 10.1093/cz/zoaa051
Olfactory receptor gene evolution is unusually rapid across Tetrapoda and outpaces chemosensory phenotypic change
Abstract
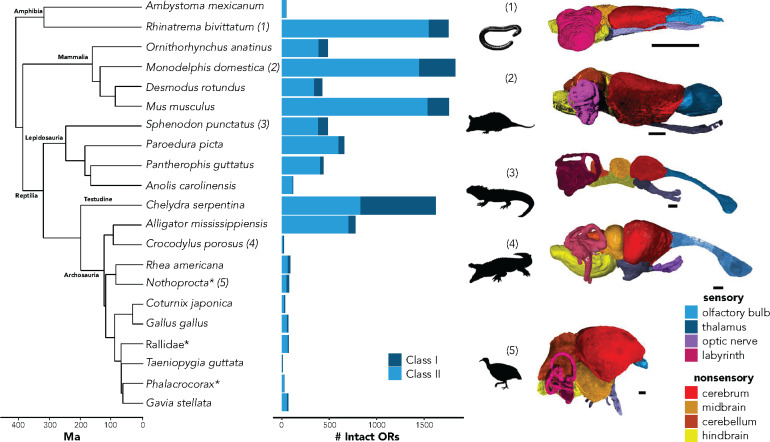
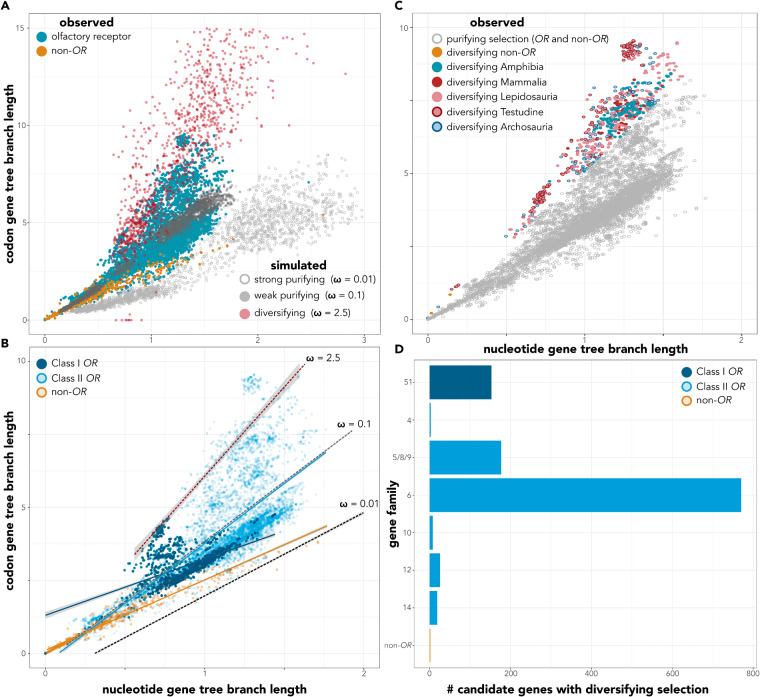
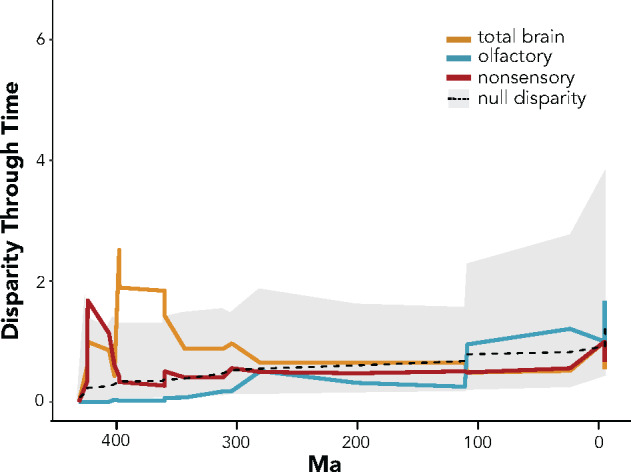
Chemosensation is the most ubiquitous sense in animals, enacted by the products of complex gene families that detect environmental chemical cues and larger-scale sensory structures that process these cues. While there is a general conception that olfactory receptor (OR) genes evolve rapidly, the universality of this phenomenon across vertebrates, and its magnitude, are unclear. The supposed correlation between molecular rates of chemosensory evolution and phenotypic diversity of chemosensory systems is largely untested. We combine comparative genomics and sensory morphology to test whether OR genes and olfactory phenotypic traits evolve at faster rates than other genes or traits. Using published genomes, we identified ORs in 21 tetrapods, including amphibians, reptiles, birds, and mammals and compared their rates of evolution to those of orthologous non-OR protein-coding genes. We found that, for all clades investigated, most OR genes evolve nearly an order of magnitude faster than other protein-coding genes, with many OR genes showing signatures of diversifying selection across nearly all taxa in this study. This rapid rate of evolution suggests that chemoreceptor genes are in "evolutionary overdrive," perhaps evolving in response to the ever-changing chemical space of the environment. To obtain complementary morphological data, we stained whole fixed specimens with iodine, µCT-scanned the specimens, and digitally segmented chemosensory and nonchemosensory brain regions. We then estimated phenotypic variation within traits and among tetrapods. While we found considerable variation in chemosensory structures, they were no more diverse than nonchemosensory regions. We suggest chemoreceptor genes evolve quickly in reflection of an ever-changing chemical space, whereas chemosensory phenotypes and processing regions are more conserved because they use a standardized or constrained architecture to receive and process a range of chemical cues.
Keywords: chemosensation; diversifying selection; olfaction; olfactory bulb; olfactory receptor; tetrapod.
Published by Oxford University Press on behalf of Editorial Office, Current Zoology 2020. This work is written by US Government employees and is in the public domain in the US.
Figures
Similar articles
-
Diversity and evolution of the vertebrate chemoreceptor gene repertoire.Nat Commun. 2024 Feb 15;15(1):1421. doi: 10.1038/s41467-024-45500-y. Nat Commun. 2024. PMID: 38360851 Free PMC article.
-
Neurogenomics and the role of a large mutational target on rapid behavioral change.Biol Direct. 2016 Nov 8;11(1):60. doi: 10.1186/s13062-016-0162-1. Biol Direct. 2016. PMID: 27825385 Free PMC article.
-
Ecological constraints on highly evolvable olfactory receptor genes and morphology in neotropical bats.Evolution. 2022 Oct;76(10):2347-2360. doi: 10.1111/evo.14591. Epub 2022 Aug 30. Evolution. 2022. PMID: 35904467 Free PMC article.
-
Molecular and cellular organization of insect chemosensory neurons.Bioessays. 2006 Jan;28(1):23-34. doi: 10.1002/bies.20338. Bioessays. 2006. PMID: 16369946 Review.
-
The molecular biology of vertebrate olfaction.Anat Rec (Hoboken). 2014 Nov;297(11):2216-26. doi: 10.1002/ar.23031. Anat Rec (Hoboken). 2014. PMID: 25312375 Review.
Cited by
-
An Evolutionary Microcircuit Approach to the Neural Basis of High Dimensional Sensory Processing in Olfaction.Front Cell Neurosci. 2021 Apr 30;15:658480. doi: 10.3389/fncel.2021.658480. eCollection 2021. Front Cell Neurosci. 2021. PMID: 33994949 Free PMC article.
-
Divergent sensory and immune gene evolution in sea turtles with contrasting demographic and life histories.Proc Natl Acad Sci U S A. 2023 Feb 14;120(7):e2201076120. doi: 10.1073/pnas.2201076120. Epub 2023 Feb 7. Proc Natl Acad Sci U S A. 2023. PMID: 36749728 Free PMC article.
-
Tracking the Diversity and Chromosomal Distribution of the Olfactory Receptor Gene Repertoires of Three Anurans Species.J Mol Evol. 2023 Dec;91(6):793-805. doi: 10.1007/s00239-023-10135-y. Epub 2023 Oct 31. J Mol Evol. 2023. PMID: 37906255
-
Echolocation and dietary adaptations mediate brain-endocast covariation in bats.iScience. 2025 Mar 4;28(4):112159. doi: 10.1016/j.isci.2025.112159. eCollection 2025 Apr 18. iScience. 2025. PMID: 40201116 Free PMC article.
-
Male pheromones and their reception by females are co-adapted to affect mating success in two subspecies of brown rats.Curr Zool. 2020 Oct 23;67(4):371-382. doi: 10.1093/cz/zoaa066. eCollection 2021 Aug. Curr Zool. 2020. PMID: 34671704 Free PMC article.
References
-
- Altschul SF, Gish W, Miller W, Myers EW, Lipman DJ, 1990. Basic local alignment search tool. J Mol Biol 215:403–410. - PubMed
-
- Barton RA, Purvis A, Harvey PH, 1995. Evolutionary radiation of visual and olfactory brain systems in primates, bats and insectivores. Philos Trans R Soc London Ser B-Biological Sci 348:381–392. - PubMed
LinkOut - more resources
Full Text Sources