. 2021 Aug 24:2021:7792223.
doi: 10.1155/2021/7792223. eCollection 2021.

Downregulation of PART1 Inhibits Proliferation and Differentiation of Hep3B Cells by Targeting hsa-miR-3529-3p/FOXC2 Axis

Affiliations

Downregulation of PART1 Inhibits Proliferation and Differentiation of Hep3B Cells by Targeting hsa-miR-3529-3p/FOXC2 Axis

Zhicheng Weng et al. J Oncol. .

Abstract

Background: Long noncoding RNAs (lncRNAs) are an important subtype of noncoding RNAs (ncRNAs) and microRNA sponges regulate protein-coding gene expression. The lncRNA prostate androgen-regulated transcript 1 (PART1) was implicated in the process of several cancer pathogeneses. However, studies on the regulation of PART1 expression and its mechanism in liver cancer are lacking.

Methods: qRT-PCR and western blot were used to detect PART1 levels in liver cancer serums and cell lines. Cell proliferation, migration, and invasion were detected using CCK8 assays, cell clones, and transwell assays. Interaction between PART1 and miR-3529-3p and forkhead box protein C2 (FOXC2) was confirmed using dual-luciferase reporter assays.

Results: We revealed that expression levels of PART1 and FOXC2 are significantly upregulated and the miR-3529-3p expression level significantly decreases in the serum while high expression level of PART1 is positively associated with tumour size, BCLC stage, and TNM stage. shRNA of PART1 can significantly reduce the ability of cell migration and invasion by regulating AKT signalling associated with the reduction of MMP-2 and MMP-9 protein expression. Dual-luciferase reporter assays showed that PART1 can sponge miR-3529-3p, which targets FOXC2 in liver cancer cells. The promoting or suppressing effect of PART1 for Hep3B cell proliferation, invasion, and migration is revised by miR-3529-3p mimics and inhibitors.

Conclusion: Results showed that downregulation of PART1 can partially inhibit proliferation and differentiation by targeting hsa-miR-3529-3p/FOXC2 axis.


Conflict of interest statement

The authors have declared that no conflicts of interest exist.

Figures

Figure 1
Figure 1
Effect of lncRNA PART1, miR-3529-3p, and FOXC2 expression on liver cancer. (a) The relative expression of PART1, miR-3529-3p, and FOXC2 in serum of patients and normal people was analyzed by qRT-PCR. (b) The relative expression of PART1, miR-3529-3p, and FOXC2 in cell lines was analyzed by qRT-PCR. All of the data are presented as the mean ± SD. Compared with control group, P < 0.05; ∗∗P < 0.01.
Figure 2
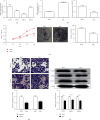
Figure 2
Effects of lncRNA PART1 on the biological function of hepatoma cells. (a) Transfection efficiency of shlnc; (b) the expression level of FOXC2 and miR-3529-3p in Hep3B cells transfected with the shlnc-2; (c) the cell viability of in Hep3B cells; (d) the ability of cell migration and invasion; (e) FOXC2, MMP-2, and MMP-9 protein expression in Hep3B cells transfected with shlnc-2. All of the data are expressed as the mean ± SD. Compared with the control group, P < 0.05; ∗∗P < 0.01; ∗∗∗P < 0.001.
Figure 3
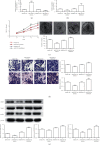
Figure 3
Effects of miR-3529-3p on hepatoma cells. (a) The expression level of miR-3529-3p; (b) the expression level of FOXC2; (c) the cell viability of Hep3B cells was analyzed by CCK-8 analysis and the clone formation; (d) the transwell invasion assays of Hep3B cells transfected with the miR-3529-3p mimic and the miR-3529-3p inhibitor; (e) FOXC2, MMP-2, and MMP-9 protein expression in Hep3B cells. All protein samples were isolated in Hep3B cells after transfection with miR-3529-3p mimic and the miR-3529-3p inhibitor. All of the data are expressed as the mean ± SD. Compared with control group, P < 0.05, ∗∗P < 0.01, ∗∗∗P < 0.001.
Figure 4
Figure 4
Effect of PAPT1-hsa-miR-3529-3p on regulating the occurrence and development of liver cancer. (a) PAPT1 is a target of miR-3529-3p. Left: schematic representation of the miR-3529-3p site in the PAPT1 3′-UTR. Right: the 3′-UTR reporter assay was carried out in Hep3B transfected with miR-3529-3p mimic or mimic NC. The MUT or WT reporter plasmids were transfected with Lipo-2000. Luciferase assays were performed 48 h after transfection. Firefly luciferase activity was standardized to a Renilla luciferase control. (b) PAPT1 expression was negatively correlated with hsa-miR-3529-3p expression in liver cancer serums. (c) The cell viability of Hep3B cells including the CCK analysis and clone formation; (d) the transwell invasion assays of Hep3B cells transfected with the shlnc and the miR-3529-3p inhibitor; (e) FOXC2, MMP-2, and MMP-9 protein expression in Hep3B cells. All protein samples were isolated in Hep3B cells after transfection with shlnc and the miR-3529-3p inhibitor. Compared with control group, P < 0.05; ∗∗P < 0.01; ∗∗∗P < 0.001.
Figure 5
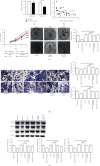
Figure 5
Effect of hsa-miR-3529-3p/FOXC2 axis on regulating the occurrence and development of liver cancer. (a) FOXC2 is a target of miR-3529-3p. Left: Schematic representation of the miR-3529-3p site in the FOXC2 3′-UTR. Right: The 3′-UTR reporter assay was carried out in Hep3B transfected with miR-3529-3p mimic or mimic NC. The MUT or WT reporter plasmids were transfected with Lipo-2000. Luciferase assays were performed 48 h after transfection. Firefly luciferase activity was standardized to a Renilla luciferase control. (b) hsa-miR-3529-3p expression was negatively correlated with FOXC2 expression in liver cancer serums. (c) The cell viability of Hep3B cells including the CCK analysis and clone formation. (d) The transwell invasion assays of Hep3B cells transfected with the miR-3529-3p mimic and the overexpression of FOXC2; (e) FOXC2, MMP-2, and MMP-9 protein expression in Hep3B cells. All protein samples were isolated in Hep3B cells after transfection with the miR-3529-3p mimic and the overexpression of FOXC2. Compared with control group, P < 0.05; ∗∗P < 0.01; ∗∗∗P < 0.001.

References

    1. Yamamura S., Imai-Sumida M., Tanaka Y., Dahiya R. Interaction and cross-talk between non-coding RNAs. Cellular and Molecular Life Sciences. 2018;75(3):467–484. doi: 10.1007/s00018-017-2626-6. - DOI - PMC - PubMed
    1. Zhang X., Liang H., Kourkoumelis N., Wu Z., Li G., Shang X. Comprehensive analysis of lncRNA and miRNA expression profiles and ceRNA network construction in osteoporosis. Calcified Tissue International. 2020;106(4):343–354. doi: 10.1007/s00223-019-00643-9. - DOI - PubMed
    1. Long J., Bai Y., Yang X., et al. Construction and comprehensive analysis of a ceRNA network to reveal potential prognostic biomarkers for hepatocellular carcinoma. Cancer Cell International. 2019;19:p. 90. doi: 10.1186/s12935-019-0817-y. - DOI - PMC - PubMed
    1. Sana J., Faltejskova P., Svoboda M., Slaby O. Novel classes of non-coding RNAs and cancer. Journal of Translational Medicine. 2012;10:p. 103. doi: 10.1186/1479-5876-10-103. - DOI - PMC - PubMed
    1. Takahashi K., Yan I., Haga H., Patel T. Long noncoding RNA in liver diseases. Hepatology. 2014;60(2):744–753. doi: 10.1002/hep.27043. - DOI - PMC - PubMed