. 2021 Aug 26:2021:8533464.
doi: 10.1155/2021/8533464. eCollection 2021.

Identification of a Nomogram from Ferroptosis-Related Long Noncoding RNAs Signature to Analyze Overall Survival in Patients with Bladder Cancer

Affiliations

Identification of a Nomogram from Ferroptosis-Related Long Noncoding RNAs Signature to Analyze Overall Survival in Patients with Bladder Cancer

Yuanshan Cui et al. J Oncol. .

Abstract

Purpose: This study aimed to establish a nomogram to predict the overall survival (OS) of patients with bladder cancer (BC) by ferroptosis-related long noncoding RNAs (FRlncRNAs) signature.

Methods: We obtained FRlncRNAs expression profiles and clinical data of patients with BC from the Cancer Genome Atlas database. The patients were divided into the training set, testing set, and overall set. Lasso regression and multivariate Cox regression were used to establish the FRlncRNAs signature, the prognosis of each group was compared by Kaplan-Meier (K-M) analysis, and the receiver operating characteristic (ROC) curve evaluated the accuracy of the model. The Gene Set Enrichment Analysis (GSEA) was used for the visualization of the functional enrichment for FRlncRNAs. The databases of GEPIA and K-M Plotter were used for subsequent functional analysis of major FRlncRNAs.

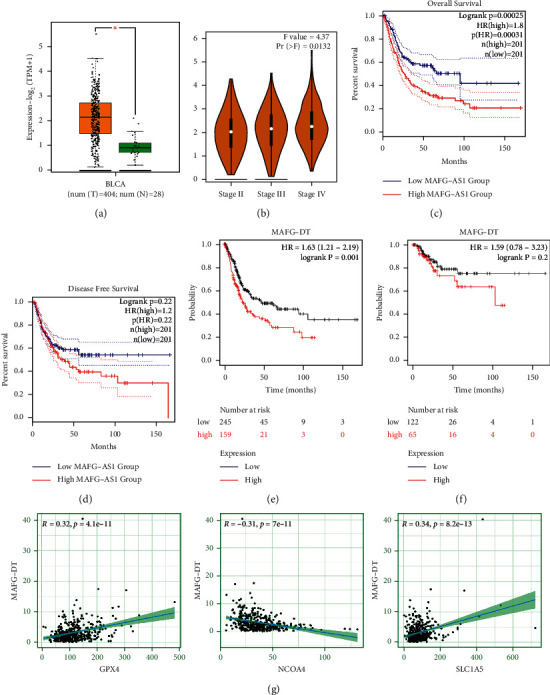
Results: Thirteen prognostic FRlncRNAs (LINC00942, MAFG-DT, AL049840.3, AL136084.3, OCIAD1-AS1, AC062017.1, AC008074.2, AC018653.3, AL031775.1, USP30-AS1, LINC01767, AC132807.2, and AL354919.2) were identified to be significantly different, constituting an FRlncRNAs signature. Patients with BC were divided into low-risk group and high-risk group by this signature in the training, testing, and overall sets. K-M analysis showed that the prognosis of patients in the high-risk group was poor and the difference in the subgroup analyses was statistically significant. ROC analysis revealed that the predictive ability of the model was more accurate than traditional assessment methods. A risk score based on FRlncRNAs signature was an independent prognostic factor for the patients with BC (HR = 1.388, 95%CI = 1.228-1.568, P < 0.001). Combining the FRlncRNAs signature and clinicopathological factors, a predictive nomogram was constructed. The nomogram can accurately predict the overall survival of patients and had high clinical practicability. The GSEA analysis showed that the primary pathways were WNT, MAPK, and cell-matrix adhesion signaling pathways. The major FRlncRNAs (MAFG-DT) were associated with poor prognosis in the GEPIA and K-M Plotter database.

Conclusion: Thirteen prognostic FRlncRNAs and their nomogram were accurate tools for predicting the OS of BC, which might be molecular biomarkers and therapeutic targets.


Conflict of interest statement

The authors declare that they have no conflicts of interest.

Figures

Figure 1
Figure 1
The flowchart of predictive model construction.
Figure 2
Figure 2
Construction and evaluation of the FRlncRNAs signature in the training set. Lasso coefficient values and vertical dashed lines were calculated at the best log (lambda) value (a), and coefficients (b) of prognostic-related lncRNAs are displayed. (c) The K-M curve showed that the high-risk group had a worse survival rate than the low-risk group (P < 0.05). (d) The ROC curve is given for this signature and its AUC value. (e) Heatmap of the 13 FRlncRNAs profiles showed the expression of FRlncRNAs in the high-risk and the low-risk group. (f) Scatter plot showed the correlation between the survival status and risk score of patients. (g) Risk score distribution plot showed the distribution of high-risk and low-risk patients. (h) ROC curves and their AUC value represented 1-, 3-, and 5-year OS.
Figure 3
Figure 3
The K-M curve of thirteen prognostic FRlncRNAs. Four FRlncRNAs (LINC00942, MAFG-DT, AL049840.3, and AL136084.3) were independent unfavorable factors. Nine FRlncRNAs (OCIAD1-AS1, AC062017.1, AC008074.2, AC018653.3, AL031775.1, USP30-AS1, LINC01767, AC132807.2, and AL354919.2) were independent beneficial factors.
Figure 4
Figure 4
Validation of the FRlncRNAs signature for BC patients in the testing set and overall set. K-M curves showed that the high-risk group had the worse OS than the low-risk group in the testing set (a) and overall set (c). ROC curves and its AUC value in the testing set (b) and overall set (d). ROC curves and their AUC value represented 1-, 3-, and 5-year OS in the testing set (e) and overall set (g). Heatmap of 13 FRlncRNAs profiles showed the expression of FRlncRNAs in the high-risk group and the low-risk group in the testing set (f) and overall set (h). Scatter plot showed the outcomes between the survival status and risk score in the testing set (i) and overall set (j). Risk score distribution plot showed the distribution of high-risk and low-risk BC patients in the testing set (k) and overall set (l).
Figure 5
Figure 5
Clinical value of the FRlncRNAs signature in BC patients. The univariate Cox regression showed that risk score and clinicopathological features including age, stage, T stage, and N stage were prognostic-related variables (a). The multivariate Cox regression analysis showed that the risk score was independent prognostic factors (b). Construction of a prognostic nomogram based on risk score and clinicopathological indexes to predict 1-, 3-, and 5-year OS of BC patients (c). The multivariate ROC curve showed that predictive accuracy of risk score was higher than other clinicopathological indexes (d). Calibration curves displayed the concordance between predicted and observed 1-, 3-, and 5-year OS (e).
Figure 6
Figure 6
The survival outcomes of the high- and low-risk score subgroup were stratified by clinicopathological indexes. K-M curves showed the survival outcomes of high- and low-risk patients stratified according to gender (male versus female) (a, b), age (≤65 years versus >65 years) (c, d), stage (stages I-II versus stages III-IV) (e, f), T stage (T1-2 versus T3-4) (g, h), and N stage (N0 versus T1-3) (i, j), respectively (all P < 0.05).
Figure 7
Figure 7
The results of functional analysis based on FRlncRNAs. (a–d) KEGG enrichment analysis; (e, f) GO enrichment analysis.
Figure 8
Figure 8
The Sankey diagram and coexpression network of 13 FRlncRNAs and FRGs. (a) Sankey diagram showed the association between FRlncRNAs, FRGs, and risk types. (b) The correlation of 13 FRlncRNAs. (c) The coexpression network between prognostic FRlncRNAs and FRGs in BC.
Figure 9
Figure 9
Expression and prognosis of MAFG-DT from the GEPIA and K-M Plotter databases. (a) Expression of MAFG-DT in BC tissues from the GEPIA database (P < 0.05). (b) Expression of MAFG-DT based on tumor stage from the GEPIA database (Pr = 0.0132). (c, d) Prognosis of MAFG-DT with the cohort from the GEPIA database. (e) Prognosis of MAFG-DT with the cohort from the K-M Plotter database. (g) Linear correlation analysis of MAFG-DT and protein-coding genes (GPX4, NCOA4, and SLC1A5).

References

    1. Kamat A. M., Hahn N. M., Efstathiou J. A., et al. Bladder cancer. The Lancet. 2016;388(10061):2796–2810. doi: 10.1016/s0140-6736(16)30512-8. - DOI - PubMed
    1. Lenis A. T., Lec P. M., Chamie K., Mshs M. Bladder cancer. JAMA. 2020;324(19):1980–1991. doi: 10.1001/jama.2020.17598. - DOI - PubMed
    1. Cumberbatch M. G. K., Jubber I., Black P. C., et al. Epidemiology of bladder cancer: a systematic review and contemporary update of risk factors in 2018. European Urology. 2018;74(6):784–795. doi: 10.1016/j.eururo.2018.09.001. - DOI - PubMed
    1. Yousef P. G., Gabril M. Y. An update on the molecular pathology of urinary bladder tumors. Pathology, Research & Practice. 2018;214(1):1–6. doi: 10.1016/j.prp.2017.11.003. - DOI - PubMed
    1. Soukup V., Čapoun O., Cohen D., et al. Prognostic performance and reproducibility of the 1973 and 2004/2016 world health organization grading classification systems in non-muscle-invasive bladder cancer: a European association of Urology non-muscle invasive bladder cancer guidelines panel systematic review. European Urology. 2017;72(5):801–813. doi: 10.1016/j.eururo.2017.04.015. - DOI - PubMed

LinkOut - more resources