. 2021 Aug 17:11:633430.
doi: 10.3389/fonc.2021.633430. eCollection 2021.

HOXA5 Is Recognized as a Prognostic-Related Biomarker and Promotes Glioma Progression Through Affecting Cell Cycle

Affiliations

HOXA5 Is Recognized as a Prognostic-Related Biomarker and Promotes Glioma Progression Through Affecting Cell Cycle

Fengqin Ding et al. Front Oncol. .

Abstract

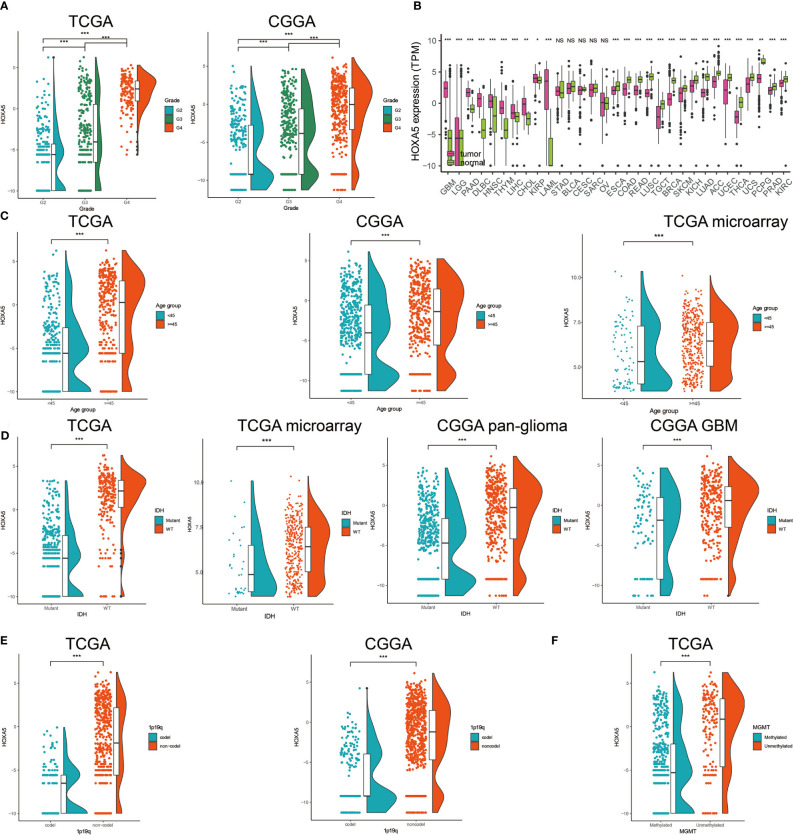
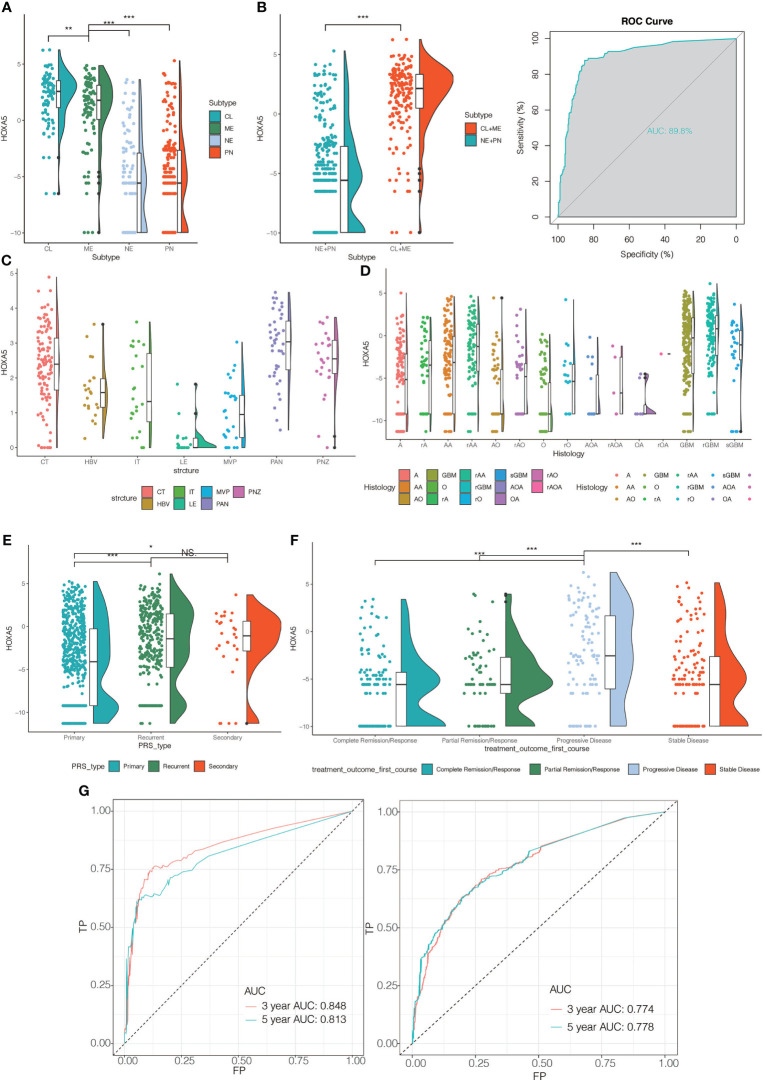
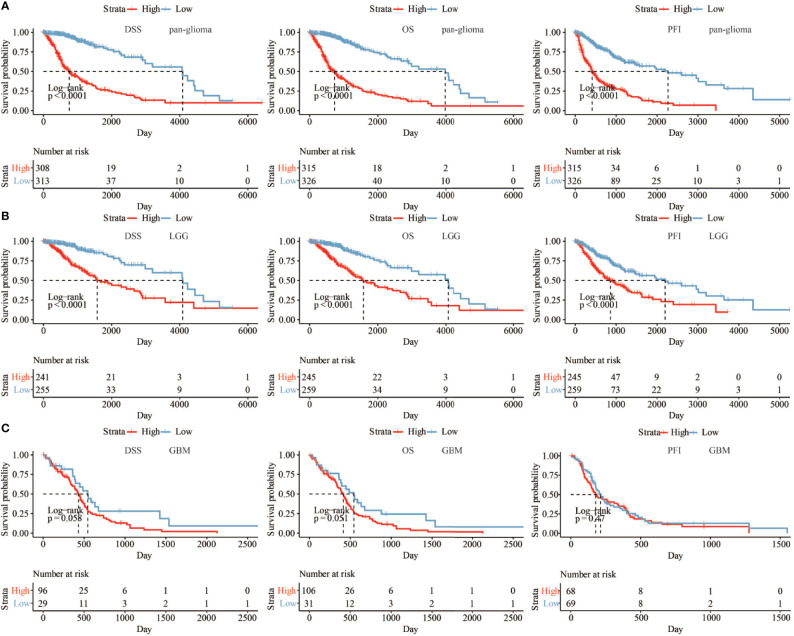
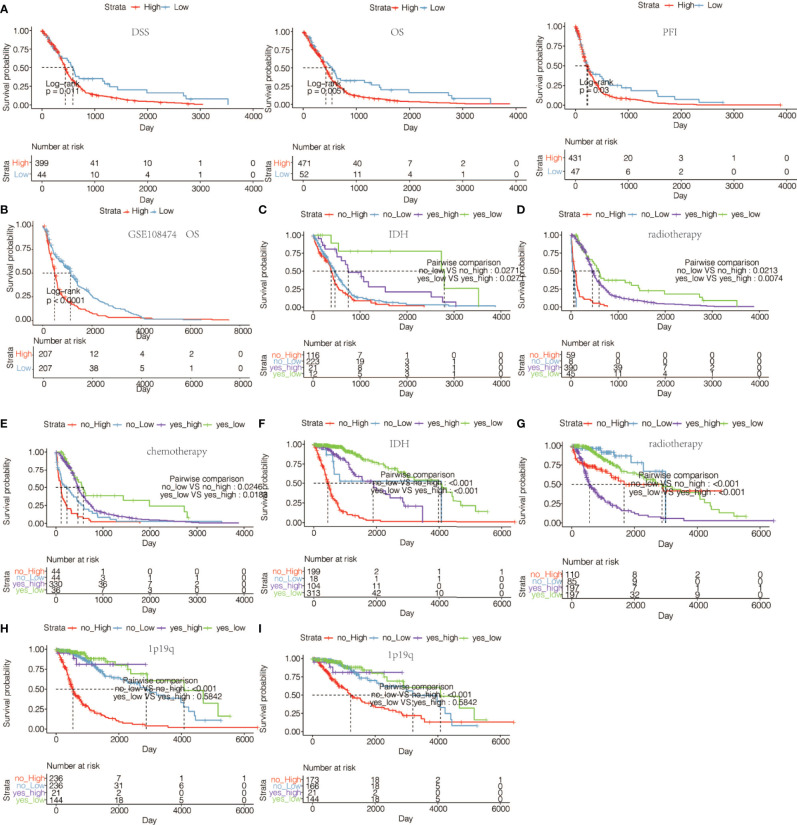
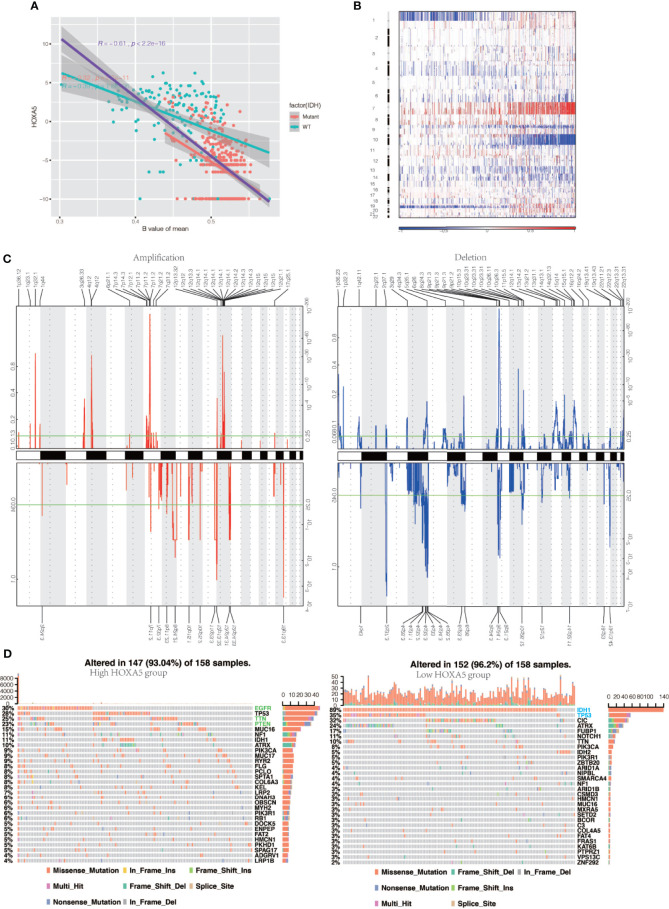
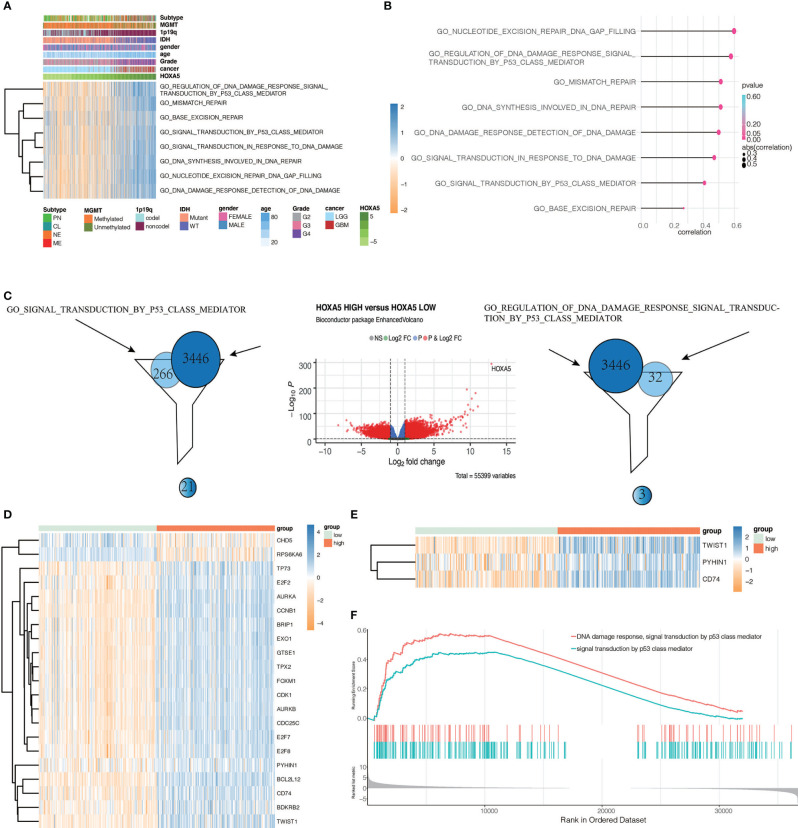
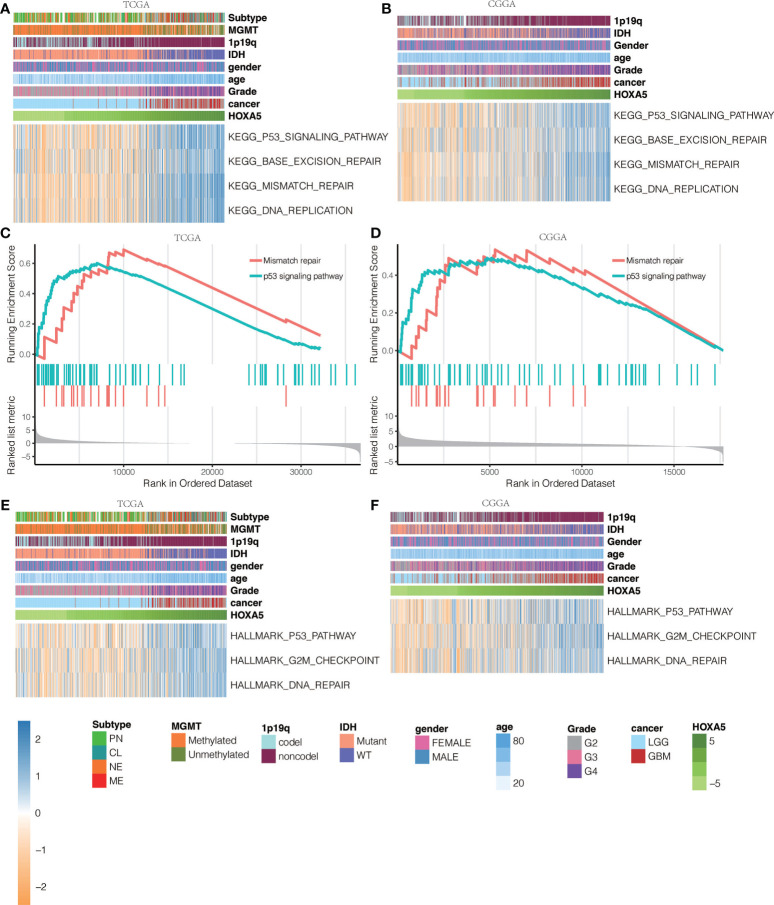
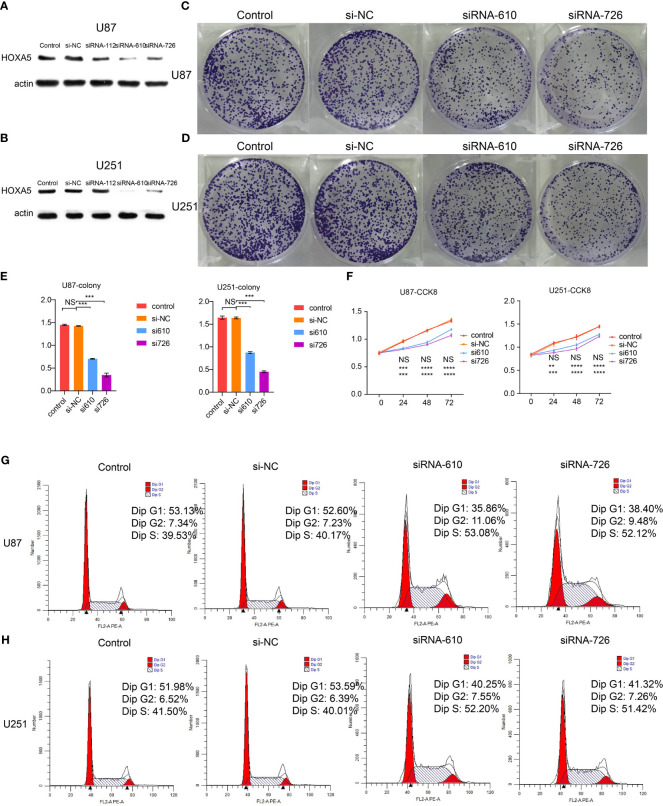
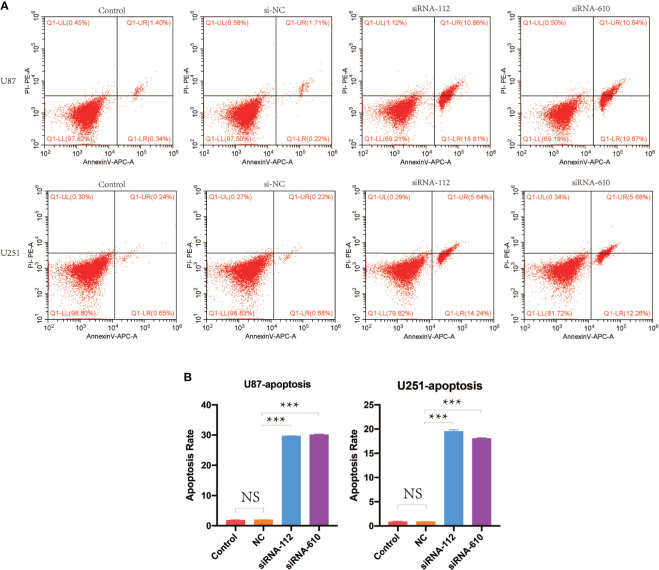
Glioma is malignant tumor derives from glial cells in the central nervous system. High-grade glioma shows aggressive growth pattern, and conventional treatments, such as surgical removal and chemo-radiotherapy, archive limitation in the interference of this process. In this work, HOXA5, from the HOX family, was identified as a glioma cell proliferation-associated factor by investigating its feature in the TCGA and CGGA data set. High HOXA5 expression samples contain unfavorable clinical features of glioma, including IDH wild type, un-methylated MGMT status, non-codeletion 1p19q status, malignant molecular subtype. Survival analysis indicates that high HOXA5 expression samples are associated with worse clinical outcome. The CNVs and SNPs profile difference further confirmed the enrichment of glioma aggressive related biomarkers. In the meantime, the activation of DNA damage repair-related pathways and TP53-related pathways is also related to HOXA5 expression. In cell lines, U87MG and U251, by interfering HOXA5 expression significantly inhibit glioma progression and apoptosis, and cell cycle is arrested at the G2/M phase. Collectively, increased HOXA5 expression can promote glioma progression via affecting glioma cell proliferation.

Keywords: cell cycle; cell proliferation; glioma; homeobox A5; prognosis.


Conflict of interest statement

The authors declare that the research was conducted in the absence of any commercial or financial relationships that could be construed as a potential conflict of interest.

Figures

Figure 1
Figure 1
(A) Analysis of HOXA5 mRNA levels (log2) in WHO grades II to IV gliomas from TCGA and CGGA. (B) Analysis of HOXA5 mRNA levels (log2) in various cancer types. (C) The expression level of HOXA5 in different age groups in pan-glioma analysis in TCGA and CGGA data sets, and in GBM patients in TCGA microarray data set. (D) HOXA5 was upregulated in the IDH mutant gliomas in TCGA data set, in the IDH mutant GBM in TCGA microarray data set and in both the IDH mutant gliomas and GBM alone in CGGA data set. (E) HOXA5 was upregulated in the 1p19q codeletion in pan-gioma analysis in both TCGA and CGGA data sets. (F) HOXA5 was upregulated in the methylated gliomas in TCGA data set. NS, Not Statistically Significant; *P < 0.05; **P < 0.01; ***P < 0.001.
Figure 2
Figure 2
(A) The HOXA5 expression pattern in the TCGA molecular subtype in pan-glioma analysis. (B) HOXA5 was upregulated in CL and ME subtypes by comparing to NE and PN subtypes in pan-glioma analysis in TCGA data set. Receiver operating characteristic (ROC) curve to assess sensitivity and specificity of HOXA5 expression as a diagnostic biomarker for the ME and CL molecular subtypes in gliomas. (C) Intra-tumor analysis of HOXA5 expression using IVY GBM RNA-seq data. Anatomic structures analyzed are the following: LE (leading edge), IT (infiltrating tumor), CT (cellular tumor), PAN (pseudopalisading cells around necrosis), PNZ (perinecrotic zone), MVP (microvascular proliferation), and HBV (hyperplastic blood vessels). (D) The expression levels of HOXA5 based on the histopathologic classification. (E) The expression level of HOXA5 in primary, recurrent, secondary glioma types. (F) The expression level of HOXA5 in different first-course treatment outcomes. (G) ROC curve indicating sensitivity and specificity of HOXA5 expression as a diagnostic biomarker for 3- and 5-year survivals in pan-glioma analysis in TCGA and CGGA data sets. A, low-grade astrocytoma; AA, anaplastic astrocytoma; AO, anaplastic oligodendroglioma; GBM, glioblastoma; O, oligodendroglioma; rA, recurrent low-grade astrocytoma; rAA, recurrent anaplastic astrocytoma; rGBM, recurrent glioblastoma; rO, recurrent oligodendroglioma; sGBM, secondary glioblastoma; AOA, anaplastic oligoastrocytoma; OA, oligoastrocytoma. NS, Not Statistically Significant; *P < 0.05; **P < 0.01; ***P < 0.001.
Figure 3
Figure 3
(A) The DSS, OS, and PFI survival probabilities of patients in pan-glioma analysis in TCGA data set. (B) The DSS, OS, and PFI survival probabilities of LGG patients in TCGA data set. (C) The DSS, OS, and PFI survival probabilities of GBM patients in TCGA data set.
Figure 4
Figure 4
(A) The DSS, OS, and PFI survival probabilities of GBM patients in TCGA microarray data set. (B) The OS survival probability of glioma patients from GSE108474 data set. (C) The OS survival probability of GBM patients without or with IDH mutation with high or low expression of HOXA5 in TCGA microarray data set. (D) The OS survival probability of GBM patients without or with radiotherapy with high or low expression of HOXA5 in TCGA microarray data set. (E) The OS in GBM patients without or with chemotherapy with high or low expression of HOXA5 in TCGA microarray data set. (F) The OS survival probability of patients without or with IDH mutation with high or low expression of HOXA5 in pan-glioma analysis in TCGA data set. (G) The OS survival probability of patients without or with radiotherapy with high or low expression of HOXA5 in pan-glioma analysis in TCGA data set. (H) The OS survival probability of patients without or with 1p19q codeletion with high or low expression of HOXA5 in pan-glioma analysis in TCGA data set. (I) The OS in LGG patients without or with 1p19q codeletion with high or low expression of HOXA5 in TCGA data set.
Figure 5
Figure 5
HOXA5 high or low expression is associated with distinct genomic alterations. (A) Relationship between HOXA5 and methylation status at promoter region in the cancer genome atlas (TCGA) gliomas samples. The orange dots indicate IDH‐mutant samples, and cyan dots indicate IDH wild‐type samples, respectively. The purple line indicates linear regression between HOXA5 expression and methylation. The orange line and cyan line indicate linear regression between HOXA5 expression and methylation in IDH‐mutant samples and IDH wild‐type samples, respectively. (B) Overall copy number variation (CNV) profile according to high vs low HOXA5 expression. Blue (deletion); red (amplification). (C) Frequency of specific changes based on HOXA5low (lower row) and HOXA5high (upper row) groups. The Y-axis represents the frequency of chromosomal deletion (blue) or amplification (red). (D) Spectrum of somatic mutations in gliomas from HOXA5low and HOXA5high groups.
Figure 6
Figure 6
Identifying differentially expressed genes between HOXA5 high and HOXA5 low patients. (A) Heatmap of HOXA5-related oncogenic process in pan-glioma analysis in TCGA data set. (B) Correlation analysis between HOXA5 and GO pathways. (C) Volcano plot of differential gene profiles between HOXA5 high and HOXA5 low groups. (D) Genes involved in both regulation of DNA damage response signal transduction by p53 class mediator gene set and DEGs. (E) Genes involved in both signal transduction by p53 class mediator gene set and DEGs. (F) GSEA plots for enrichment of DNA damage response and p53 signal transduction in HOXA5 high and HOXA5 low samples in the TCGA data set.
Figure 7
Figure 7
KEGG pathway analysis for mutations based on HOXA5 expression levels in (A) TCGA data set and (B) CGGA data set. GSEA plots for enrichment of mismatch repair and p53 signaling pathway in HOXA5 high and HOXA5 low samples in (C) TCGA data set and (D) CGGA data set. HALLMARK pathway analysis for mutations based on HOXA5 expression levels in (E) TCGA data set and (F) CGGA data set.
Figure 8
Figure 8
(A) The Western blotting results of HOXA5 expression in U87 cell line. (B) The Western blotting results of HOXA5 expression in U251 cell line. (C) The colony-forming assay, which supports cell viability, is inhibited by silencing HOXA5 expression in U87 cell line. (D) The colony-forming assay, which supports cell viability, is inhibited by silencing HOXA5 expression in U251 cell line. (E) Statistical analysis for colony-forming assay. NS, not statistically significant; ***P < 0.001. (F) Statistical analysis for CCK8 assay. NS, not statistically significant; **P < 0.01; ***P < 0.001; ****P < 0.0001. (G) Cell cycle analysis was performed with PI staining by flow cytometry. Representative flow cytometric profiles (left panel) and percentages of cells at the S phase, G1 phase, and G2 phase in U87 cell line are shown. (H) Cell cycle analysis was performed with PI staining by flow cytometry. Representative flow cytometric profiles (left panel) and percentages of cells at the S phase, G1 phase, and G2 phase in U251 cell line are shown.
Figure 9
Figure 9
(A) Cell apoptosis analysis was performed by flow cytometry. Shown are representative flow cytometric profiles of cells in control group, si-NC group, siRNA-112 group, and siRNA-610 group in U87 and U251 cell lines. (B) Statistical analysis for cell apoptosis assay in U87 and U251 cell lines. NS, not statistically significant; ***P < 0.001.

Similar articles

Cited by

References

    1. Zhang H, Wang R, Yu Y, Liu J, Luo T, Fan F. Glioblastoma Treatment Modalities Besides Surgery. J Cancer (2019) 10:4793–806. 10.7150/jca.32475 - DOI - PMC - PubMed
    1. Zhang H, Zhou Y, Cui B, Liu Z, Shen H. Novel Insights Into Astrocyte-Mediated Signaling of Proliferation, Invasion and Tumor Immune Microenvironment in Glioblastoma. BioMed Pharmacother (2020) 126:110086. 10.1016/j.biopha.2020.110086 - DOI - PubMed
    1. Zhang H, Chen Z, Wang Z, Dai Z, Hu Z, Zhang X, et al. . Correlation Between APOBEC3B Expression and Clinical Characterization in Lower-Grade Gliomas. Front Oncol (2021) 11:625838. 10.3389/fonc.2021.625838 - DOI - PMC - PubMed
    1. Zhang N, Dai Z, Wu W, Wang Z, Cao H, Zhang Y, et al. . The Predictive Value of Monocytes in Immune Microenvironment and Prognosis of Glioma Patients Based on Machine Learning. Front Immunol (2021) 12:656541. 10.3389/fimmu.2021.656541 - DOI - PMC - PubMed
    1. Jeannotte L, Gotti F, Landry-Truchon K. Hoxa5: A Key Player in Development and Disease. J Dev Biol (2016) 4(2):13. 10.3390/jdb4020013 - DOI - PMC - PubMed