Review
. 2021 Aug 17:8:682924.
doi: 10.3389/fcvm.2021.682924. eCollection 2021.

Coronary Magnetic Resonance Angiography in Chronic Coronary Syndromes

Affiliations
Review

Coronary Magnetic Resonance Angiography in Chronic Coronary Syndromes

Reza Hajhosseiny et al. Front Cardiovasc Med. .

Abstract

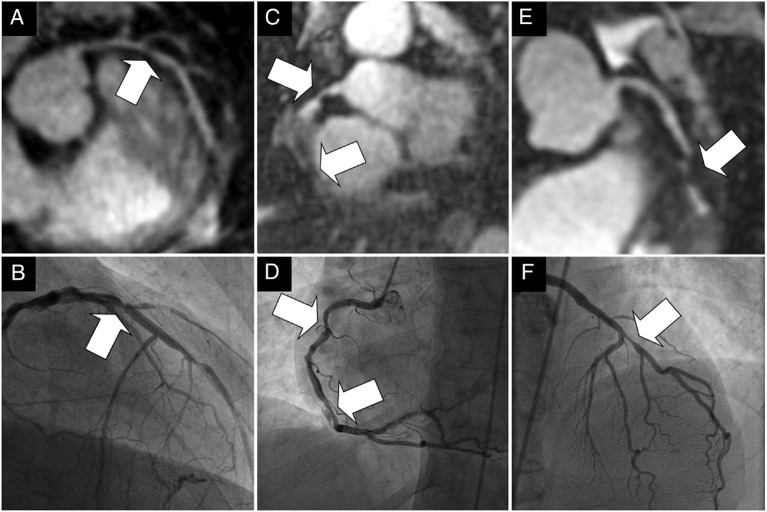
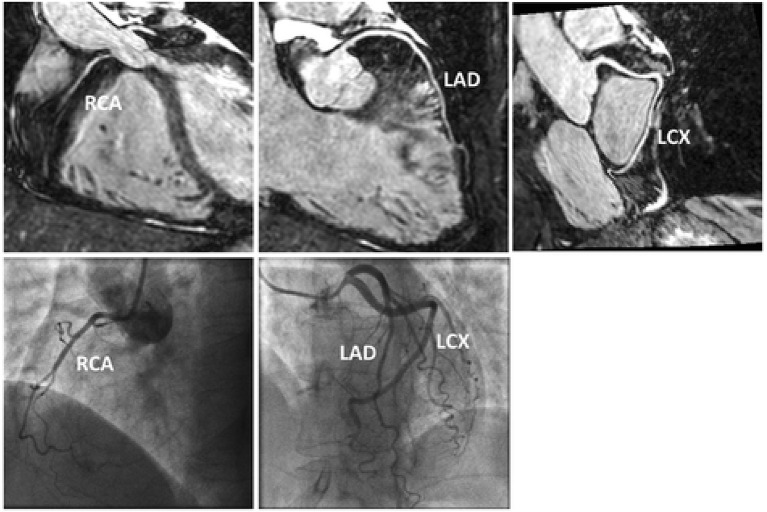
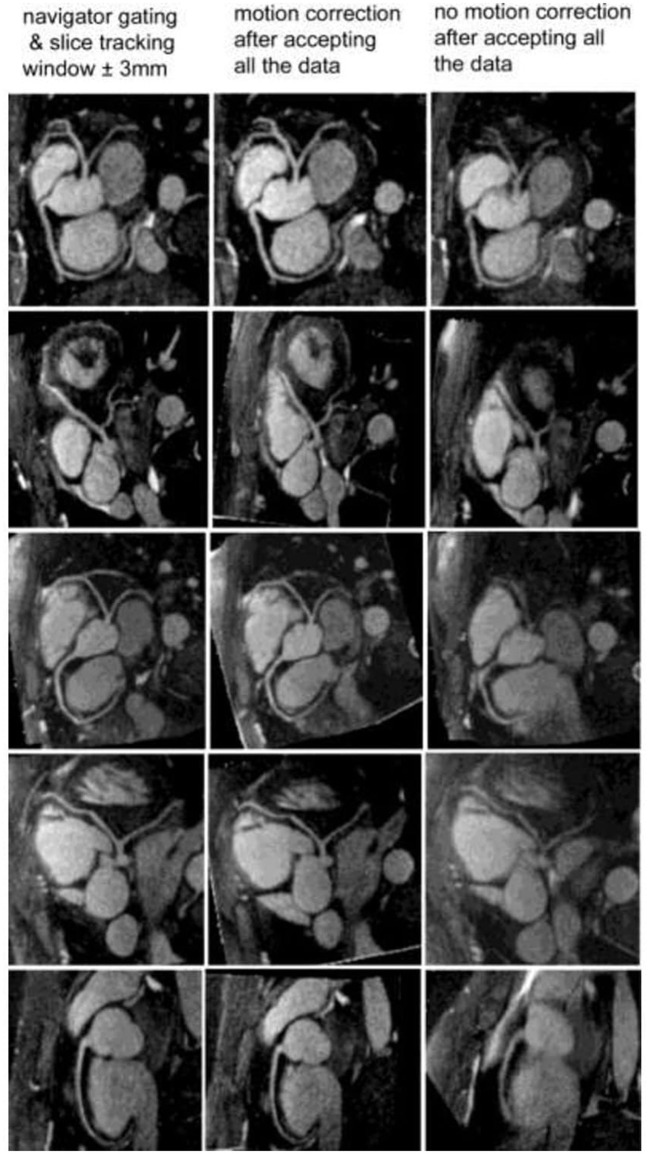
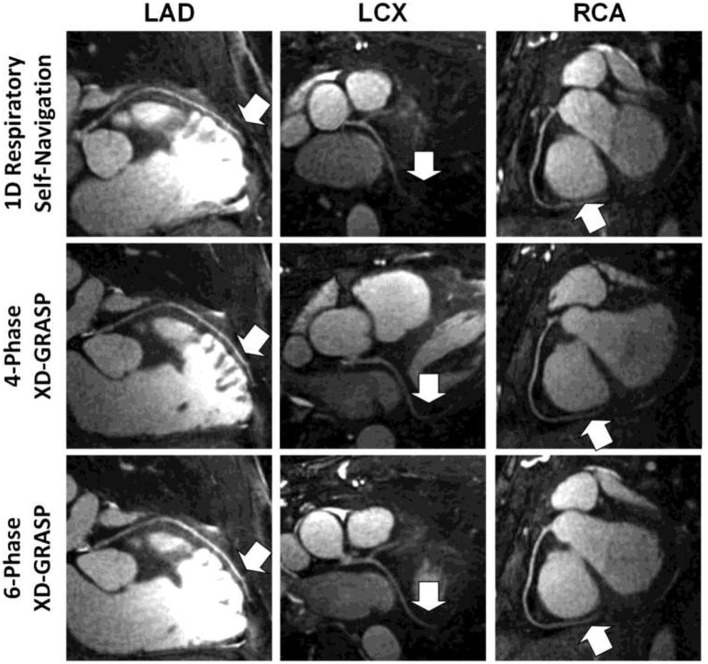
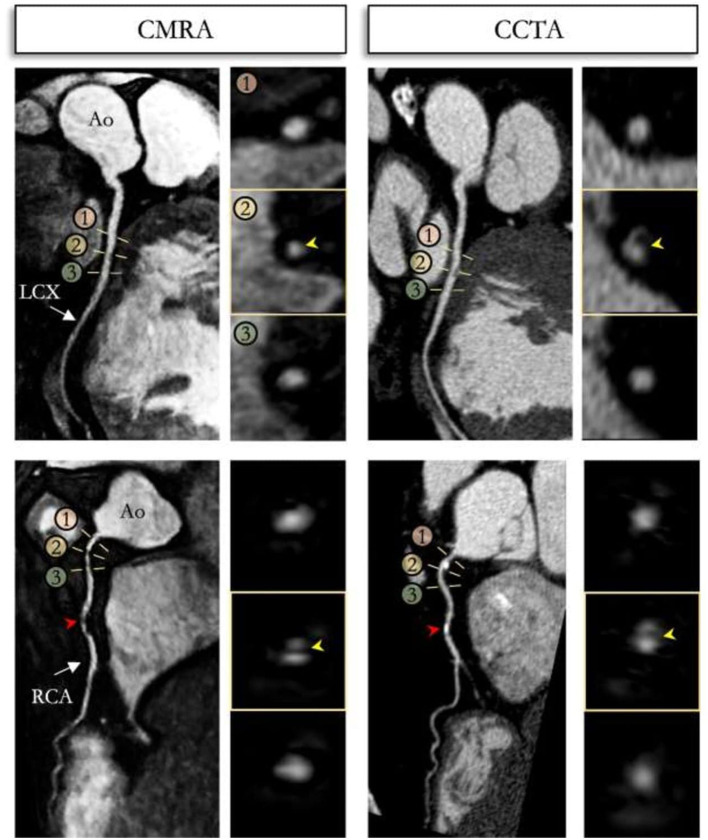
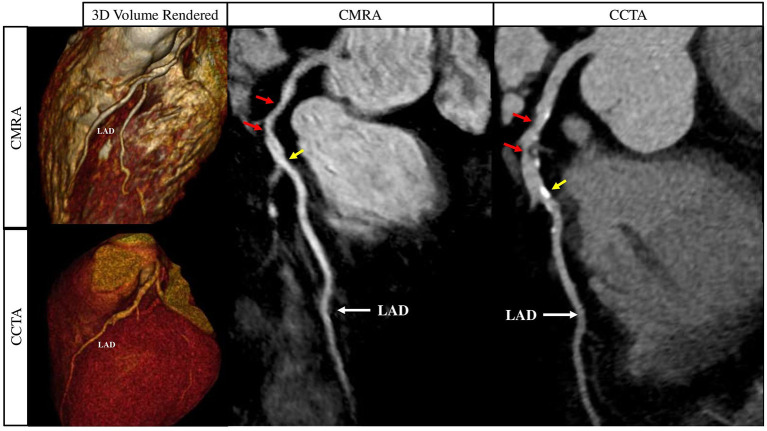
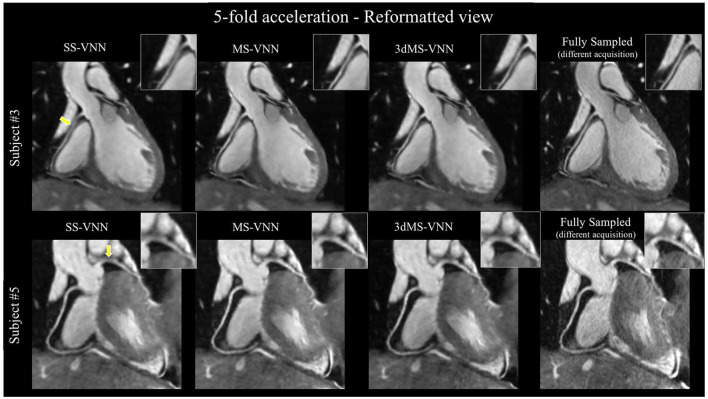
Cardiovascular disease is the leading cause of mortality worldwide, with atherosclerotic coronary artery disease (CAD) accounting for the majority of cases. X-ray coronary angiography and computed tomography coronary angiography (CCTA) are the imaging modalities of choice for the assessment of CAD. However, the use of ionising radiation and iodinated contrast agents remain drawbacks. There is therefore a clinical need for an alternative modality for the early identification and longitudinal monitoring of CAD without these associated drawbacks. Coronary magnetic resonance angiography (CMRA) could be a potential alternative for the detection and monitoring of coronary arterial stenosis, without exposing patients to ionising radiation or iodinated contrast agents. Further advantages include its versatility, excellent soft tissue characterisation and suitability for repeat imaging. Despite the early promise of CMRA, widespread clinical utilisation remains limited due to long and unpredictable scan times, onerous scan planning, lower spatial resolution, as well as motion related image quality degradation. The past decade has brought about a resurgence in CMRA technology, with significant leaps in image acceleration, respiratory and cardiac motion estimation and advanced motion corrected or motion-resolved image reconstruction. With the advent of artificial intelligence, great advances are also seen in deep learning-based motion estimation, undersampled and super-resolution reconstruction promising further improvements of CMRA. This has enabled high spatial resolution (1 mm isotropic), 3D whole heart CMRA in a clinically feasible and reliable acquisition time of under 10 min. Furthermore, latest super-resolution image reconstruction approaches which are currently under evaluation promise acquisitions as short as 1 min. In this review, we will explore the recent technological advances that are designed to bring CMRA closer to clinical reality.

Keywords: CCS; CMRA; atherosclerosis; coronary angiography; magnetic resonance imaging; plaque.


Conflict of interest statement

The authors declare that the research was conducted in the absence of any commercial or financial relationships that could be construed as a potential conflict of interest.

Figures

Figure 1
Figure 1
(A–F) Examples of the comparison between multiplanar reformats of the whole-heart 1D self-navigated CMRA data sets (top row) and the corresponding x-ray coronary angiograms (bottom row) in three patients. The lesion in the proximal LAD artery and just distal to the take-off of a diagonal branch can clearly be identified in the first patient in (A). while this is confirmed on the x-ray angiogram in (B). While the luminal narrowing of the proximal RCA in the second patient on (C). can clearly be identified, the further course of this artery is obscured in the region of a stent. The same in stent restenoses can be identified in (D). In the third patient in (E). significant disease is identified in the proximal LAD artery at CMRA and is confirmed on, (F). the corresponding x-ray coronary angiogram. Arrows = stenoses; LAD, left anterior descending artery; RCA, right coronary artery. Adapted with permission from Piccini et al. (46).
Figure 2
Figure 2
Reformatted CMRA datasets (top row) from a patient without coronary artery disease but non dominant RCA. Coronary x-ray angiography in the same patient (bottom row). RCA, right coronary artery; LAD, left anterior descending artery; LCX, left circumflex artery. Adapted with permission from Henningsson et al. (52).
Figure 3
Figure 3
Reformatted coronary artery images from five healthy volunteers. With the motion correction technique (middle column), coronary artery visualization is excellent and similar to the navigator gating and slice tracking approach (left column). Without any motion correction (right column), the images are blurry and the coronary artery visualization is poor. The imaging time with the motion correction technique is reduced by a factor of 2.5 to 3 compared with the navigator gating and slice tracking approach. Adapted with permission from Bhat et al. (53).
Figure 4
Figure 4
Examples of multiplanar reformatted coronary arteries from one representative healthy adult volunteer. Although respiratory self-navigated reconstruction with 1D motion correction could achieve high image quality (top row), a clear improvement in sharpness as well as visible vessel length (arrows) can be noticed in both four-phase (middle row) and six-phase (bottom row) extradimensional golden-angle radial sparse parallel (XD-GRASP) reconstructions. Adapted with permission from Piccini et al. (54).
Figure 5
Figure 5
(A) Data acquisition scheme and respiratory motion extraction for non–ECG-triggered whole-heart imaging. (a) A 3D radial b-SSFP sequence that is segmented into multiple interleaves (purple lines) is used for MR data acquisition. Each interleave starts with a spoke oriented along the superior to inferior direction for self-navigation (red lines) and is preceded by fat saturation (blue lines). Ten additional ramp-up RF pulses (yellow lines) are deployed between the fat saturation module and the data acquisition window to restore restoring steady-state at each interleave. (b) 3D radial sampling trajectory based on the spiral phyllotaxis pattern. Each interleave is rotated by the golden-angle (137.51 °) about the z-axis, starting with a self-navigation spoke (red lines) for respiratory motion extraction. (c) An extracted respiratory motion signal is superimposed to the 1D FFT of an example series of SI readouts. (B) The acquired k-space is sorted into a 5D dataset (kx-ky-kz-cardiac phase-respiratory phase) using respiratory motion signal extracted from self-navigators and cardiac motion signal obtained from recorded ECG time stamp. The datasets are first binned into different cardiac phases with a desired temporal resolution, then each cardiac phase is further sorted into multiple respiratory motion phases spanning from end-expiration to end-inspiration. The data sorting process is performed such that the number of spokes grouped in each temporal phase is the same. SSFP, Steady State Free Precession; MR, Magnetic Resonance; RF, Radiofrequency; FFT, fast Fourier transform; SI, Superior-Inferior; ECG, Electrocardiogram. Adapted with permission from Feng et al. (55).
Figure 6
Figure 6
(A) Comparison of the myocardium, the RCA and LAD coronary arteries for different imaging techniques in one subject. 5D whole-heart images (end-expiratory phase) achieved improved visual delineation of the myocardial wall and different segments of the coronary arteries (white arrows) over 4D whole-heart images, and improved delineation of the LAD over self-navigated 3D whole-heart images. (B) Corresponding respiratory motion pattern extracted from the continuous acquired whole-heart dataset in this subject. RCA, right coronary artery; LAD, left anterior descending artery. Adapted with permission from Feng et al. (55).
Figure 7
Figure 7
Reformatted coronary lumen images for gated, TC+GMD, TC, and NMC for subjects 1–4. Blurring present in the NMC images is reduced with TC, and sharpness is further increased with TC+GMD (magnified boxes). The distal part of both coronaries is particularly affected by motion (arrows). Note that TC and TC+GMD have image quality similar to that for gated. GMD, general matrix description; TC, translational correction; TC+GMD, two-step translational and non-rigid correction; NMC, non–motion-corrected. Adapted with permission from Cruz et al. (62).
Figure 8
Figure 8
Schematic overview of the accelerated free-breathing 3D CMRA acquisition with sub-millimeter isotropic resolution, 100% scan efficiency and non-rigid motion-compensated PROST reconstruction. (1) CMRA acquisition is performed with an undersampled 3D variable density spiral-like Cartesian trajectory with golden angle between spiral-like interleaves (VD-CASPR), preceded by 2D image navigators (iNAV) to allow for 100% scan efficiency and beat-to-beat translational respiratory-induced motion correction of the heart. (2) Foot-head respiratory signal is estimated from the 2D iNAVs and used to assign the acquired data into five respiratory bins and translation-corrected respiratory bins. Subsequent reconstruction of each bin is performed using soft-gated SENSE and 3D non-rigid motion fields are then estimated from the five reconstructed datasets. (3) The final 3D whole-heart motion-corrected CMRA image is obtained using the proposed 3D PROST non-rigid motion-compensated reconstruction. CMRA, coronary magnetic resonance angiography; PROST, patch-based undersampled reconstruction; ADMM, alternating direction method of multipliers. Adapted with permission from Bustin et al. (65).
Figure 9
Figure 9
Reformatted non-contrast whole-heart sub-millimeter isotropic CMRA (left) and CCTA (right) images along the LCX (top) and RCA (bottom) are shown for a 54 year-old male patient. The CMRA dataset was acquired in 9 min with 100% scan efficiency (heart rate of 57 bpm). The CCTA images demonstrate mild (25–49%) disease with a calcified plaque within the proximal RCA and severe disease (70–90%) with a partially calcified plaque in the mid-segment of RCA (red arrows), and minimal (0–24%) disease with calcified plaque in the mid-segment of the LCX. Luminal narrowing is seen on the cross-sectional views at the sites of coronary plaque on the CMRA images (yellow arrows). LAD, left anterior descending artery; RCA, right coronary artery; LCX, left circumflex artery; Ao, aorta. Adapted with permission from Bustin et al. (65).
Figure 10
Figure 10
Curved multiplanar reformat and 3D volume rendered non-contrast CMRA and contrast enhanced CCTA in a 60 year old male with >50% partially calcified stenosis in the proximal to mid LAD on either side of the first diagonal artery (red arrows). The yellow arrows represent a focal calcified <50% stenosis just distal to the second diagonal artery. CMRA, Coronary Magnetic Resonance Angiography; CCTA, Coronary Computed Tomography Angiography; LAD, Left Anterior Descending Artery. Adapted with permission from Hajhosseiny et al. (66).
Figure 11
Figure 11
CMRA images reconstructed with a single-scale VNN (SS-VNN), the multi-scale VNN (MS-VNN), and a pseudo 3D multi-scale VNN (3dMS-VNN). CMRA images were reformatted along the left (LAD) and right (RCA) coronary arteries, for two representative healthy subjects. Fully sampled and undersampled acquisitions with acceleration factor of 5× are shown. VNN, variational neural network. Adapted with permission from Fuin et al. (72).
Figure 12
Figure 12
(A) Representative 2-dimensional and 3-dimensional plaque assessment on T1-weighted imaging. Coronary plaques with 2Dlow3Dhigh in the proximal right coronary artery (2D-PMR, 1.14; 3Di-PMR, 237 PMR*mm3; Patient A: a–e), 2Dhigh3Dlow in the proximal left anterior descending artery (LAD) (2D-PMR, 1.50; 3Di-PMR, 43 PMR*mm3; Patient B: f–j), and 2Dhigh3Dhigh in the proximal LAD (2D-PMR, 1.96; 3Di-PMR, 344 PMR*mm3; Patient C: k–o). Computed tomography angiography (CTA) images (a, f, k), and axial images (b, g, l), sagittal images (c, h, m), colour maps (d, I, n), and 3D region of interests (3D plaque: e, j, n) on T1w images are shown. Yellow circles indicate percutaneous coronary intervention target lesion sites on CTA. Yellow arrows indicate lesions on T1w imaging corresponding to a lesion on angiography that underwent intervention. (B) Incidence of periprocedural myocardial injury (pMI) based on 3Di-PMR and 2D-PMR cutoff values. The red and blue bars represent patients with 3Di-PMR ≥ 51 PMR*mm3 and <51 PMR*mm3, respectively. P < 0.001 based on the chi-squared test. *P = 0.006 vs. 2Dhigh3Dlow group. P < 0.001 vs. 2Dlow3Dlow group, and P = 0.003 vs. 2Dhigh3Dlowgroup. Adapted with permission from Hosoda et al. (90).
Figure 13
Figure 13
(A) An example of pre-CE CHIP was found in the middle LAD visualised on the dark blood images and fused with the bright-blood scan. XA showed significant stenosis (70%) at that location. OCT showed large signal-poor area suggestive of possible lipid core and/or intra-plaque haemorrhage (yellow arrow). (B) An example of post-CE CHIP with diffuse wall enhancement at proximal RCA as localized on the bright-blood images. XA showed only mild stenosis (30%) at that location. OCT showed strong multi-focal back reflections and signal heterogeneity within the overlaying tissue suggestive of high macrophage density (yellow arrows). CE, contrast enhancement; CHIP, coronary hyper-intensive plaques; XA, X-ray angiography; OCT, optical coherence tomography. Adapted with permission from Xie et al. (96).
Figure 14
Figure 14
(1) Reformatted coronary depiction in three representative healthy volunteers obtained with a conventional T2-prepared bright-blood CMRA acquisition (a, d, g) and the proposed BOOST sequence for simultaneous bright-blood (T2Prep-IR BOOST datasets in b, e, h) and black-blood (PSIR BOOST datasets in c, f, i) whole-heart MRI. Quantified CNRblood−myo significantly improved with the proposed T2Prep-IR BOOST approach in comparison to the conventional CMRA, thus leading to a higher quantified coronary percentage vessel sharpness (%VS) for both right and left coronary arteries. In the PSIR BOOST images in (c, f, i), the efficacy of blood signal suppression can be appreciated along multiple portions of the coronary tree. (2) MRI images obtained in the ex vivo pig heart. All the images depict a short-axis view at the midventricular level. Images acquired with the proposed BOOST sequence are reported in (a) (bright-blood T2Prep-IR dataset) and in (b) (black-blood PSIR-like reconstruction). RV, LV, thrombus, and interventricular septum are indicated. The black-blood reconstruction (b) clearly enhances the signal from the thrombus when compared to the bright-blood dataset (a). Furthermore, 2D T1 (c) and T2 (d) mapping techniques were acquired. The ex vivo thrombus is characterized by a relatively short T1 and T2. BOOST, Bright-blood and black-blOOd phase SensiTive; IR, inversion recovery; myo, myocardium; PSIR, phase-sensitive inversion recovery; T2Prep, T2 prepared; LV, left ventricular cavity; RV, right ventricular cavity. Adapted with permission from Ginami et al. (98).

References

    1. Virani SS, Alonso A, Benjamin EJ, Bittencourt MS, Callaway CW, Carson AP, et al. Heart disease and stroke statistics-−2020 update: a report from the American Heart Association. Circulation. (2020) 141:e33. 10.1161/CIR.0000000000000746 - DOI - PubMed
    1. Institute for Health Metrics and Evaluation (IHME) . GBD Compare. Available online at: https://vizhub.healthdata.org/gbd-compare/ (accessed June 6, 2021).
    1. Benjamin EJ, Virani SS, Callaway CW, Chamberlain AM, Chang AR, Cheng S, et al. Heart disease and stroke statistics-2018 update: a report from the American Heart Association. Circulation. (2018) 137:e67–492. 10.1161/CIR.0000000000000573 - DOI - PubMed
    1. Libby P. Current concepts of the pathogenesis of the acute coronary syndromes. Circulation. (2001) 104:365–72. 10.1161/01.CIR.104.3.365 - DOI - PubMed
    1. Ross R. The pathogenesis of atherosclerosis: a perspective for the 1990s. Nature. (1993) 362:801–9. 10.1038/362801a0 - DOI - PubMed