. 2021 Aug 17:8:720851.
doi: 10.3389/fvets.2021.720851. eCollection 2021.

Folic Acid Absorption Characteristics and Effect on Cecal Microbiota of Laying Hens

Affiliations

Folic Acid Absorption Characteristics and Effect on Cecal Microbiota of Laying Hens

Yan Bai et al. Front Vet Sci. .

Abstract

This experiment was conducted to investigate the characteristics of folic acid (FA) absorption in laying hens and the effect of FA supplementation on cecal microbiota. A total of 432 healthy hens (30-week-old) were randomly assigned to four diets supplemented with FA: 0, 1, 6, and 24 mg/kg of feed for 8 w. Blood, duodenum, jejunum, ileum, cecum, and cecal chyme samples (six samples per treatment) were collected from the hens at the end of the feeding trial. Expression profiles of folate transport and transformation genes in intestine and cecal microbiota were detected. Results showed that serum folate level significantly increased (P < 0.01) with an increase in dietary FA supplementation, reaching a plateau at 6 mg/kg FA supplementation. The expression of FA transport and transformation genes was not affected in the cecum (P > 0.05) by dietary FA supplementation; however, it was affected in the duodenum, jejunum, and ileum and mostly showed a downward trend in treatment groups (P < 0.05). The genes affected include duodenal folate receptor (Folr) and dihydrofolate reductase (Dhfr), jejunal proton-coupled folate transporter (Pcft) and reduced folate carrier (Rfc), and ileal ATP binding cassette subfamily C member (Abcc2), Abcc3, Rfc, Folr, and Dhfr. Furthermore, according to the operational taxonomic unit classification and taxonomic position identification, the cecal microbiota population of the hens was not affected by dietary FA supplementation at the phylum, class, order, family, genus, and species levels (P > 0.05). However, the relative abundance of some microbiota was affected by dietary FA supplementation (P < 0.05). In conclusion, FA transport from the intestinal lumen into enterocytes, and then into the bloodstream, is strictly regulated, which may be associated with the regulation of the expression profiles of genes involved in FA absorption. Pathogenic bacteria decreased in the cecum, especially at 24 mg/kg supplementation, but the beneficial bacteria (Bifidobacteriaceae) decreased at this level, too. Overall, FA supplementation at 6 mg/kg, which was selected for folate-enriched egg production, did not affect the health and metabolism of laying hens negatively.

Keywords: absorption; folic acid; functional prediction; gut microbiota; laying hen.


Conflict of interest statement

The authors declare that the research was conducted in the absence of any commercial or financial relationships that could be construed as a potential conflict of interest.

Figures

Figure 1
Figure 1
The composition of the cecal microbiota at different classification levels. The taxonomic-composition distribution histograms of each sample are shown at the phylum, class, order, family, genus, and species levels separately. FA, folic acid supplement, the numbers after FA refer to the amounts added in mg/kg feed, the numbers after (-) indicate samples in each group.
Figure 2
Figure 2
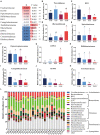
Distribution of the cecal microbiota at the phylum level. (A) Spearman's correlation coefficients of dietary folic acid supplementation and the relative abundance of bacteria at the phylum level, ** indicated highly significant correlation (P < 0.01), * indicated significant correlation (P < 0.05). (B) Taxonomic composition at the phylum level across different samples. (C)–(E) Comparison of the relative abundance of Verrucomicrobia,TM7, and Fusobacteria in different groups, respectively. Different letters in the column represent significant differences (P < 0.05). FA, folic acid supplement, the numbers after FA refer to the amounts added in mg/kg feed, the numbers after (-) indicate samples in each group.
Figure 3
Figure 3
Distribution of the cecal microbiota at the family level. (A) Spearman's correlation coefficients of dietary folic acid supplementation and the relative abundance of bacteria at the family level [only statistically significant differences (P < 0.05) are shown], ** indicated highly significant correlation (P < 0.01), * indicated significant correlation (P < 0.05). (B–K) Comparison of the relative abundance of Prevotellaceae, BS11, [Barnesiellaceae], Spirochaetaceae, Peptostreptococcaceae, RFP12, Bifidobacteriaceae, Campylobacteraceae, Rs-045, Fusobacteriaceae, respectively. Different letters in the column represent significant differences (P < 0.05). (L) Taxonomic composition at the family level across different samples (top 20 classified bacteria are shown). FA, folic acid supplement, the numbers after FA refer to the added in mg/kg feed, the numbers after (-) indicate samples in each group.
Figure 4
Figure 4
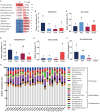
Distribution of the cecal microbiota at the genus level. (A) Spearman's correlation coefficients of dietary folic acid supplementation and the relative abundance of bavteria at the genus level [only statistically significant differences (P < 0.05) are shown], ** indicated highly significant correlation (P < 0.01), * indicated significant correlation (P < 0.05). (B–F) Comparison of the relative abundance of Megamonas, Prevotella, Campylobacter, Barnesiella, Fusobacterium, respectively. Different letters in the column represent significant differences (P < 0.05). (G) Taxonomic composition at the genus level across different samples. (top 20 classified bacteria are shown). FA, folic acid supplement, the numbers after FA refer to the amounts added in mg/kg feed, the numbers after (-) indicate samples in each group.
Figure 5
Figure 5
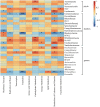
Heatmap illustrating correlation between the predicted gene functions (the KEGG level 2 categories in the top 10) and bacteria with different relative abundances among groups at the phylum, family and genus levels. The color scale indicates the degree of correlation (red: strong positive correlation, blue: strong negative correlation). *P < 0.05, **P < 0.01, ***P < 0.001.

References

    1. Nassim N, House JD. Recent developments in folate nutrition. Adv Food Nutr Res. (2018) 83:5. 10.1016/bs.afnr.2017.12.006 - DOI - PubMed
    1. Sukla KK, Nagar R, Raman R. Vitamin-B12 and folate deficiency, major contributing factors for anemia: a population based study. ESPEN J. (2014) 9:1. 10.1016/j.clnme.2013.11.003 - DOI
    1. Boddie AM, Dedlow ER, Nackashi JA, Opalko FJ, Kauwell GP, Gregory JF, III, et al. . Folate absorption in women with a history of neural tube defect-affected pregnancy. Am J Clin Nutr. (2000) 72:154–8. 10.1093/ajcn/72.1.154 - DOI - PubMed
    1. Morris MS. Folate, homocysteine, and neurological function. Nutr Clin Care. (2002) 5:3. 10.1046/j.1523-5408.2002.t01-1-00006.x - DOI - PubMed
    1. Mason JB, Tang SY. Folate status and colorectal cancer risk: a 2016 update. Mol Aspects Med. (2016) 53:73–9. 10.1016/j.mam.2016.11.010 - DOI - PubMed

LinkOut - more resources