. 2021 Jun 12:22:26-39.
doi: 10.1016/j.omtm.2021.06.002. eCollection 2021 Sep 10.

Reproducible immortalization of erythroblasts from multiple stem cell sources provides approach for sustainable RBC therapeutics

Affiliations

Reproducible immortalization of erythroblasts from multiple stem cell sources provides approach for sustainable RBC therapeutics

Deborah E Daniels et al. Mol Ther Methods Clin Dev. .

Abstract

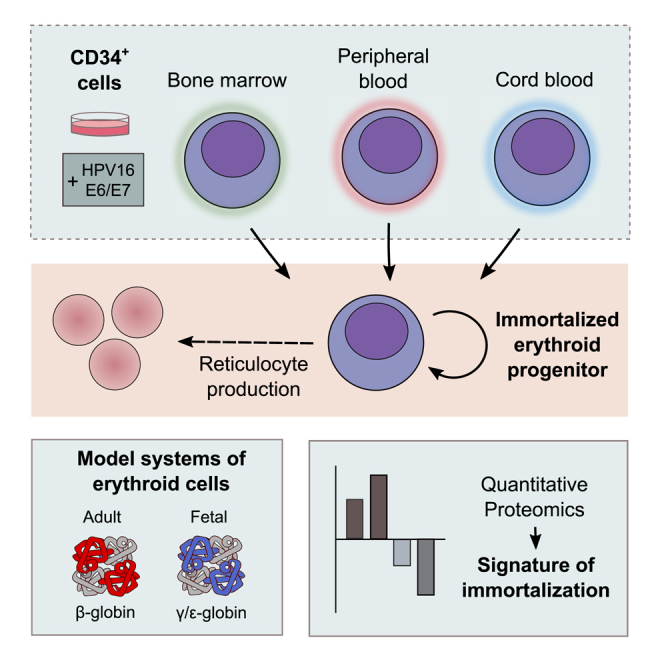
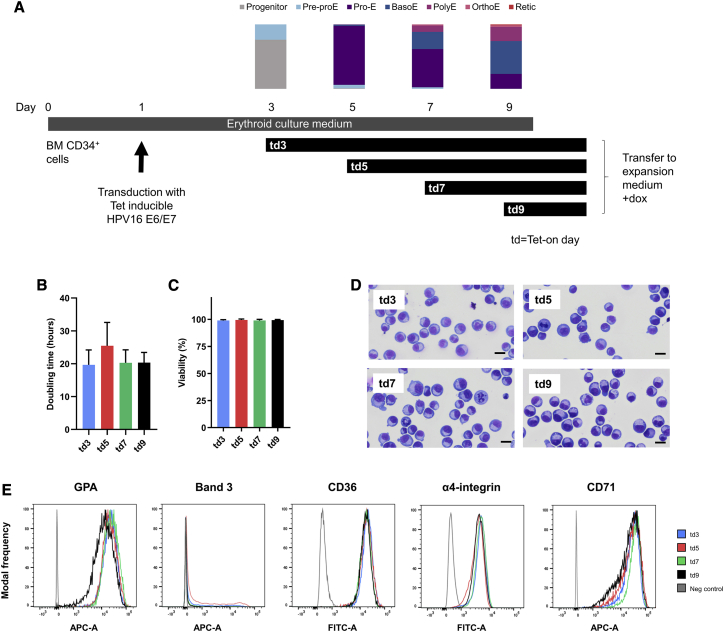
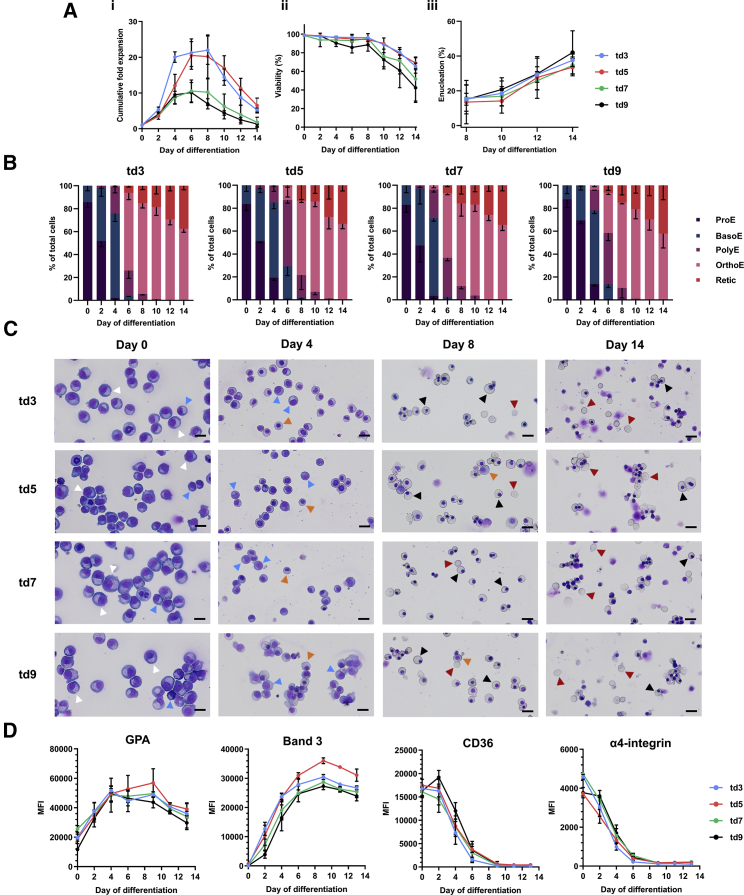
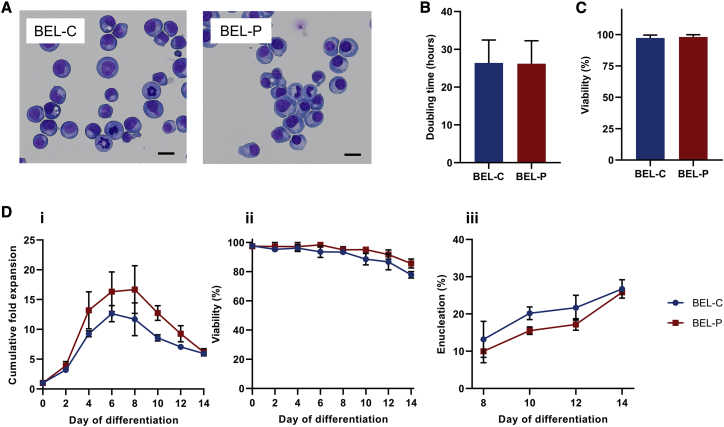
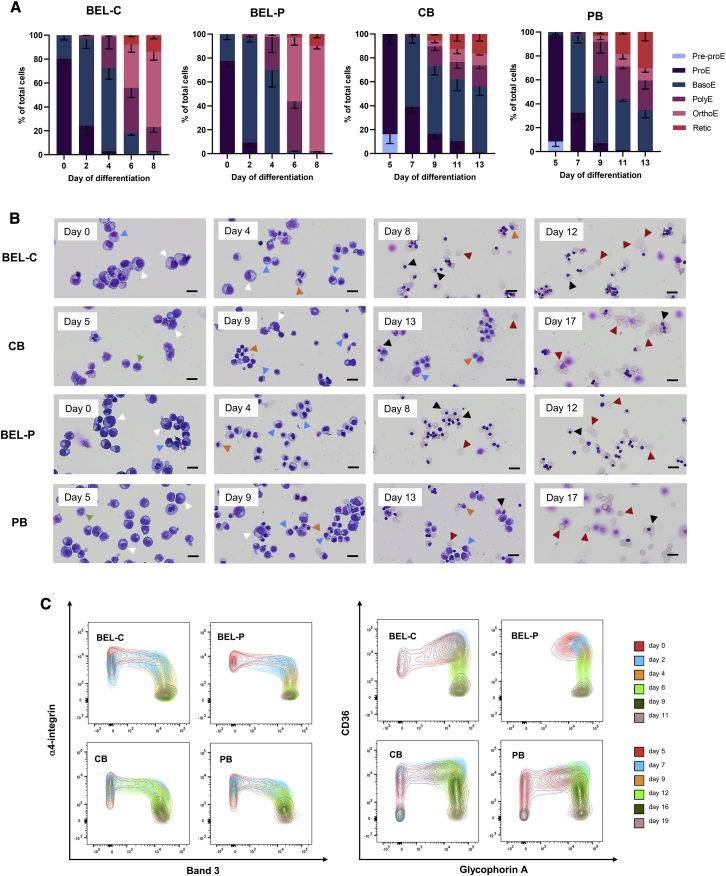
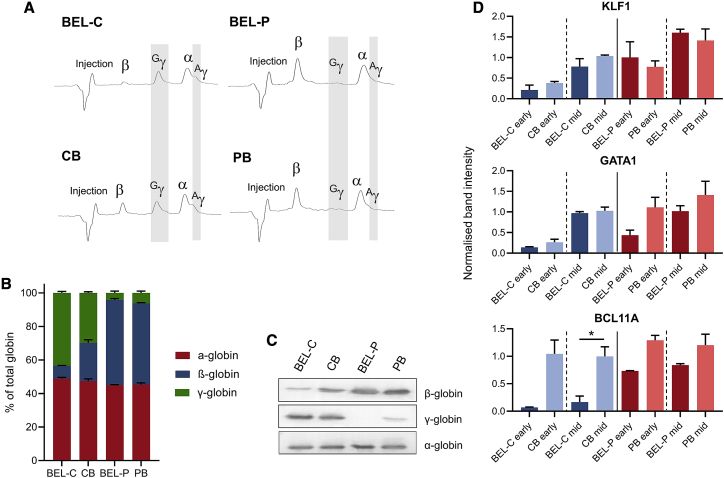
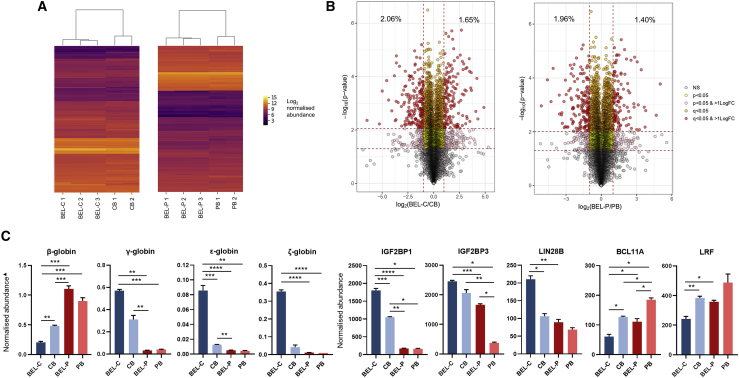
Developing robust methodology for the sustainable production of red blood cells in vitro is essential for providing an alternative source of clinical-quality blood, particularly for individuals with rare blood group phenotypes. Immortalized erythroid progenitor cell lines are the most promising emergent technology for achieving this goal. We previously created the erythroid cell line BEL-A from bone marrow CD34+ cells that had improved differentiation and enucleation potential compared to other lines reported. In this study we show that our immortalization approach is reproducible for erythroid cells differentiated from bone marrow and also from far more accessible peripheral and cord blood CD34+ cells, consistently generating lines with similar improved erythroid performance. Extensive characterization of the lines shows them to accurately recapitulate their primary cell equivalents and provides a molecular signature for immortalization. In addition, we show that only cells at a specific stage of erythropoiesis, predominantly proerythroblasts, are amenable to immortalization. Our methodology provides a step forward in the drive for a sustainable supply of red cells for clinical use and for the generation of model cellular systems for the study of erythropoiesis in health and disease, with the added benefit of an indefinite expansion window for manipulation of molecular targets.

Keywords: bone marrow; cell lines; cord blood; erythroid; immortalized; peripheral blood; proteomics.


Conflict of interest statement

The authors declare no competing interests.

Figures

None
Graphical abstract
Figure 1
Figure 1
Only early erythroid cells, predominantly proerythroblasts, display efficient immortalization potential (A) schematic of the td3, td5, td7, and td9 cell line initiation protocol. Vertical bars depict morphology data obtained from cytospins of BM CD34+ cell erythroid culture at days 3, 5, 7, and 9 of differentiation. Pre-proE, pre-proerythroblast; ProE, proerythroblast; BasoE, basophilic erythroblast; PolyE, polychromatic erythroblast; OrthoE, orthochromatic erythroblast; Retic, reticulocyte. (B–E) characterization of the td3, td5, td7, and td9 cell lines during the undifferentiated stage. (B and C) doubling time (B) and percentage viability (C) determined by trypan blue exclusion assay of established cell lines from days 152–198 of expansion culture. Data are shown as mean ± standard deviation (SD). (D) representative images from cytospins of cell line expansion cultures. Scale bars, 20 μm. (E) expression of GPA, band 3, CD36, α4-integrin, and CD71 in the undifferentiated cell lines as determined by flow cytometry (n = 3) with MFI frequency distributions normalized to mode. Histograms are representative of three independent experiments.
Figure 2
Figure 2
Characterization of td3, td5, td7, and td9 cell lines during differentiation Expanding cells (day 0) were transferred to erythroid differentiation medium and samples taken at time points throughout differentiation. (A) cumulative fold expansion (i), percentage viability (ii), and percentage enucleation (iii) of the differentiating td3, td5, td7, and td9 cell lines. (B) percentage of erythroid cell types present during differentiation of the cell lines. ProE, proerythroblast; BasoE, basophilic erythroblast; PolyE, polychromatic erythroblast; OrthoE, orthochromatic erythroblast; Retic, reticulocyte. (C) representative images from cytospins of these cultures at days 0, 4, 8, and 12 of differentiation. Scale bars, 20 μm. Arrowheads indicate the following cell types: white, ProE; blue, BasoE; orange, PolyE; black, OrthoE; red, Retic. (D) MFI of GPA, band 3, CD36, and α4-integrin in the differentiating cell lines as determined by flow cytometry. Differentiation cultures were initiated between 154 and 200 days of continual expansion since the source CD34+ cells were thawed. Data are shown as mean ± SD, n = 3.
Figure 3
Figure 3
Characterization of erythroid cell lines derived from PB and CB CD34+ cells (A–C) characterization of the CB-derived (BEL-C) and PB-derived (BEL-P) cell lines during the undifferentiated stage. (A) representative images from cytospins of BEL-C and BEL-P expansion cultures. Scale bars, 20 μm. (B and C) doubling time (B) and percentage viability (C) determined by trypan blue exclusion assay of established cell lines from days 92–146 of expansion culture. (D) cumulative fold expansion (i), percentage viability (ii), and percentage enucleation (iii) of the differentiating BEL-C and BEL-P cell lines (n = 3). Differentiation cultures were initiated between 100 and 140 days of continual expansion since the source CD34+ cells were thawed. Data are shown as mean ± SD.
Figure 4
Figure 4
Comparison of differentiating BEL-C and BEL-P cell lines with erythroid cell differentiation from respective cord blood and adult peripheral blood CD34+ cells (A) Percentage of erythroid cell types present during differentiation of BEL-C, CB, BEL-P, and PB cells during erythroid differentiation. Pre-proE, pre-proerythroblast; ProE, proerythroblast; BasoE, basophilic erythroblast; PolyE, polychromatic erythroblast; OrthoE, orthochromatic erythroblast; Retic, reticulocyte. (B) representative images from cytospins of these cultures. Scale bars, 20 μm. Arrowheads indicate the following cell types: green, Pre-proE; white, ProE; blue, BasoE; orange, PolyE; black, OrthoE; red, Retic. Data are shown as mean ± SD (n = 3). (C) flow cytometry analysis of band 3 versus α4-integrin and GPA versus CD36 cell surface expression of BEL-C, BEL-PO, CB, and PB cells during erythroid differentiation. Plots are representative of three independent cultures.
Figure 5
Figure 5
Globin and erythroid transcription factor expression in BEL-C, BEL-P, CB, and PB cells (A and B) RP-HPLC of BEL-C and BEL-P cells at day 10 of differentiation and CB and PB cells at day 17 of differentiation. (A) representative RP-HPLC trace. The injection peak is identified along with peaks for β-globin (β), Gγ-globin (Gγ), α-globin (α), and Aγ-globin (Aγ); δ-globin expression is below the detection limit. (B) quantification of RP-HPLC data showing percentage of α-, β-, and γ-globin (Gγ + Aγ) subunits detected. Data are shown as mean ± SD (n = 3). (C) western blots of lysates obtained from BEL-C and BEL-P erythroid cells at day 10 of differentiation and CB and PB erythroid cells at day 17 of differentiation incubated with antibodies to α-, β-, and γ-globin. α-globin was used as a protein loading control. (D) densitometry analysis from western blots of lysates obtained from early and mid-differentiation cultures (day 0/4 for BEL-C and BEL-P and day 5/9 for CB and PB for early/mid-differentiation, respectively) incubated with antibodies to BCL11A, GATA1, and KLF1 normalized to β-actin. Data are shown as mean ± SD (n = 2). ∗p < 0.05 Welch’s t test (all other relevant cell line versus primary cell comparisons are statistically non-significant).
Figure 6
Figure 6
TMT LC-MS/MS comparative proteomic analysis of undifferentiated BEL-C and BEL-P with stage-matched equivalent primary cells (A) heatmaps of proteomic data from BEL-C and CB samples (left) and BEL-P and PB samples (right) presented as log2 normalized abundance values. Yellow indicates high protein expression level; purple indicates low protein expression level. Lane labels indicate samples collected from independent cultures. (B) volcano plots of the proteomic data of all culture repeats from BEL-C and CB samples (left) and BEL-P and PB samples (right) depicting −log10 p value and log2 fold change for each protein hit that had data available from all repeats. p < 0.05 and Q < 0.05 (FDR) thresholds are indicated by red dashed lines. Percentages indicate the proportion of protein hits that showed a >2-fold difference in abundance between the cell line and the primary cells and also passed the FDR threshold. (C) levels of globins and other key fetal/adult proteins in undifferentiated BEL-C and BEL-P cells with stage-matched equivalent primary cells. Data from TMT LC-MS/MS comparative proteomic analysis are abundance values normalized to total protein shown as mean ± SD (n = 2 for CB and PB and n = 3 for BEL-C and BEL-P). Globin abundances are further normalized to α-globin abundance. ∗p < 0.05, ∗∗p < 0.01, ∗∗∗p < 0.001, ∗∗∗∗p < 0.0001. p values represent results from Welch’s ANOVA performed on log2 normalized data.
Figure 7
Figure 7
Signature cell cycle protein alterations in immortalized erythroid cell lines compared to primary cells Average fold differences in key cell cycle proteins obtained from proteomic data of four immortalized erythroid cell lines (BEL-C, BEL-P, BEL-A, and BM) compared to equivalent primary cells. Data are shown as mean ± SD (n = 4).

References

    1. Kupzig S., Parsons S.F., Curnow E., Anstee D.J., Blair A. Superior survival of ex vivo cultured human reticulocytes following transfusion into mice. Haematologica. 2017;102:476–483. - PMC - PubMed
    1. Timmins N.E., Athanasas S., Günther M., Buntine P., Nielsen L.K. Ultra-high-yield manufacture of red blood cells from hematopoietic stem cells. Tissue Eng. Part C Methods. 2011;17:1131–1137. - PubMed
    1. Griffiths R.E., Kupzig S., Cogan N., Mankelow T.J., Betin V.M.S., Trakarnsanga K., Massey E.J., Lane J.D., Parsons S.F., Anstee D.J. Maturing reticulocytes internalize plasma membrane in glycophorin A-containing vesicles that fuse with autophagosomes before exocytosis. Blood. 2012;119:6296–6306. - PMC - PubMed
    1. Kurita R., Suda N., Sudo K., Miharada K., Hiroyama T., Miyoshi H., Tani K., Nakamura Y. Establishment of immortalized human erythroid progenitor cell lines able to produce enucleated red blood cells. PLoS ONE. 2013;8:e59890. - PMC - PubMed
    1. Hirose S., Takayama N., Nakamura S., Nagasawa K., Ochi K., Hirata S., Yamazaki S., Yamaguchi T., Otsu M., Sano S. Immortalization of erythroblasts by c-MYC and BCL-XL enables large-scale erythrocyte production from human pluripotent stem cells. Stem Cell Reports. 2013;1:499–508. - PMC - PubMed

LinkOut - more resources