. 2021 Aug 16;24(9):102986.
doi: 10.1016/j.isci.2021.102986. eCollection 2021 Sep 24.

Rapid visual adaptation persists across saccades

Affiliations

Rapid visual adaptation persists across saccades

Carolin Hübner et al. iScience. .

Abstract

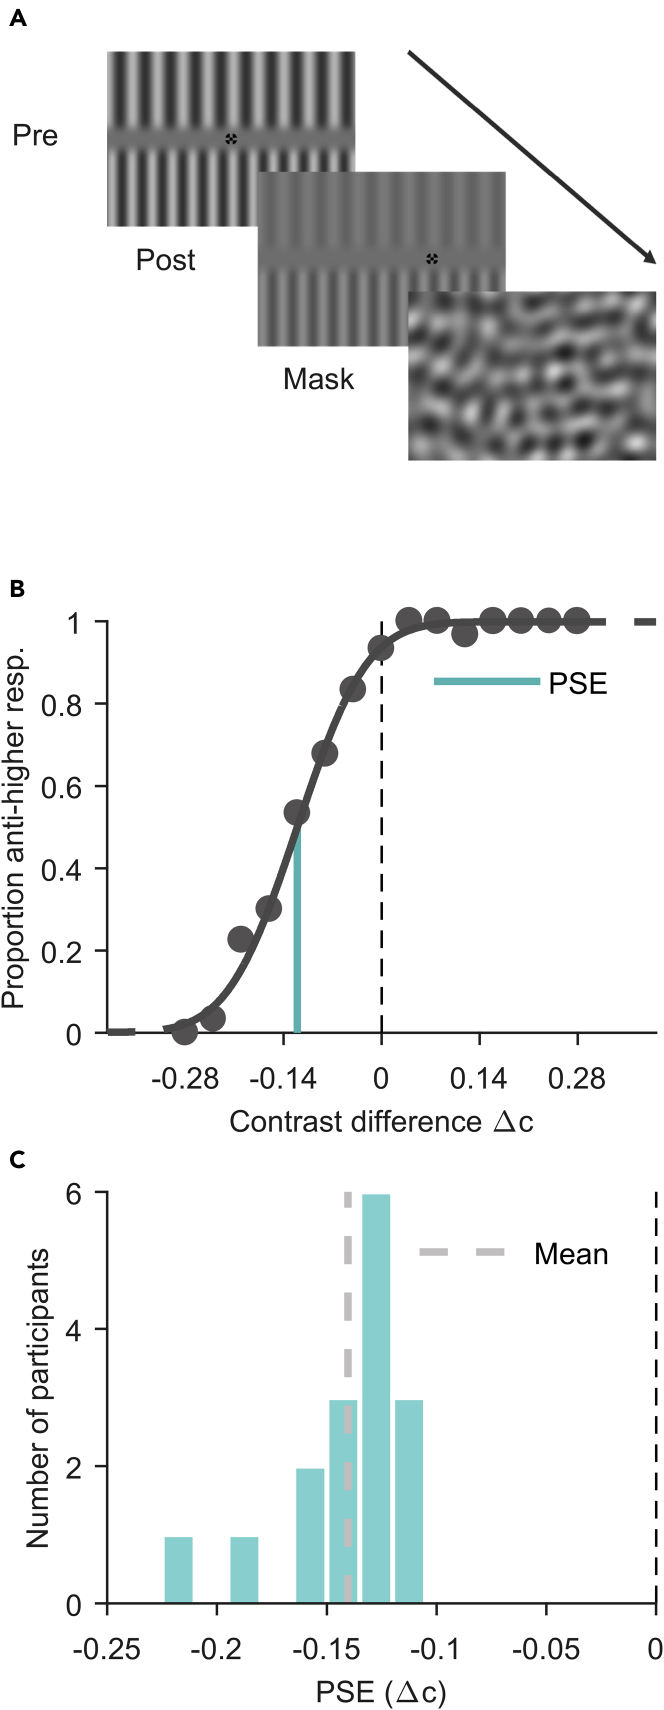
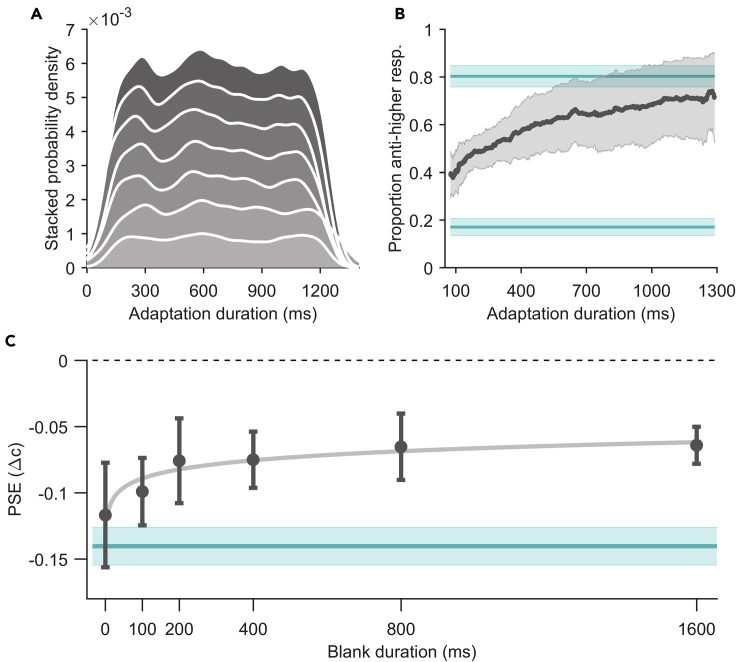
Neurons in the visual cortex quickly adapt to constant input, which should lead to perceptual fading within few tens of milliseconds. However, perceptual fading is rarely observed in everyday perception, possibly because eye movements refresh retinal input. Recently, it has been suggested that amplitudes of large saccadic eye movements are scaled to maximally decorrelate presaccadic and postsaccadic inputs and thus to annul perceptual fading. However, this argument builds on the assumption that adaptation within naturally brief fixation durations is strong enough to survive any visually disruptive saccade and affect perception. We tested this assumption by measuring the effect of luminance adaptation on postsaccadic contrast perception. We found that postsaccadic contrast perception was affected by presaccadic luminance adaptation during brief periods of fixation. This adaptation effect emerges within 100 milliseconds and persists over seconds. These results indicate that adaptation during natural fixation periods can affect perception even after visually disruptive saccades.

Keywords: Behavioral neuroscience; Clinical neuroscience; Sensory neuroscience; Techniques in neuroscience.


Conflict of interest statement

The authors declare no competing interests.

Figures

None
Graphical abstract
Figure 1
Figure 1
Demonstration of manipulation To reproduce appropriate spatial frequencies, one should view the image approximately at a distance of an arms lengths and adjust the size of the image such that one’s thumb placed on the image fits approximately in between the two dashed lines in the top left corner of the image. The described effect can be experienced by steadily fixating the central fixation stimulus for a few seconds, or (to achieve the largest possible effect) until the gratings begin to fade, and subsequently saccade towards the second fixation stimulus to the right. While fixating the second fixation stimulus, one should observe the top-half grating to be of lower contrast (correlated grating) than the bottom-half grating (anticorrelated grating). When the second fixation stimulus is fixated steadily, with low variance in gaze position, the effect can be observed for a long time.
Figure 2
Figure 2
Trial procedure and main adaptation effect (Experiment 1) (A) The sequence of presaccadic (adaptation phase, until saccade onset), postsaccadic (test phase, 400ms duration) and mask (300ms duration) stimuli seen by a participant during a trial. The arrow indicates direction of time. Fixation stimuli are not drawn to scale. (B) Example data of one participant. The psychometric function fitted to proportion anticorrelated-grating-higher responses over contrast differences Δc illustrates a point-of-subjective-equality (PSE) shifted away from zero towards a negative contrast difference level (distance between dashed and turquoise line). A negative PSE indicates a higher perceived contrast of the anticorrelated grating. (C) Histogram of PSEs in contrast difference for all participants. The light-gray dashed line represents the mean PSE. The black dashed line represents a PSE of zero expected for unbiased responses.
Figure 3
Figure 3
Results for build-up (Experiment 2) and decay (Experiment 3) of adaptation (A) Stacked probability density plot of number of valid trials over adaptation durations tested for seven participants in Experiment 2. Absolute number of trials can be found in Data Analysis. (B) Results testing the build-up of the adaptation effect over time in Experiment 2. Proportion of responses for perceiving the anticorrelated grating as of higher contrast over adaptation duration in milliseconds. The dark-gray line represents the mean proportion over participants and the light-gray area its 95%-confidence interval. The upper turquoise line represents the expected mean proportion of responses given the average PSE from Experiment 1. Likewise, the lower turquoise line represents the expected mean proportion of responses under the assumption of a PSE of zero (indicating no adaptation effect). The shaded area of both lines represents their 95%-confidence interval. (C) Results testing persistence of the adaptation effect over time in Experiment 3. PSE values in contrast difference over postsaccadic blank duration in milliseconds. Dots represent means across participants and error bars the 95%-confidence interval. The light-gray solid line represents the logarithmic function fitted to the mean data. The black dashed line at zero indicates the PSE value expected for no adaptation effect. The turquoise line (mean) and shaded area (95%-confidence interval) represent aggregated PSE values from Experiment 1.
Figure 4
Figure 4
Test stimuli and results for contribution of visual field (Experiment 4) (A) Example postsaccadic test displays when the test-stimulus slice was presented around the center of gaze (upper panel) or to the periphery (lower panel). Fixation stimuli are not drawn to scale. (B) Scatter plot for all points of subjective equality (PSE) compared between the central condition (horizontal axis) and peripheral condition (vertical axis). Data points above the dashed vertical line indicate a stronger adaptation effect for when the test-stimulus slice was presented around the center of gaze. (C) Scatter plot for just-noticeable differences (JNDs) compared between the central condition (horizontal axis) and peripheral condition (vertical axis). Data points on the diagonal dashed line indicate that participants were equally precise in both conditions. (B and C) Light-gray dots represent individual participant data and the dark-gray dot indicates the overall mean. The error bars indicate 95%-confidence intervals within each condition (cardinal bars) or between conditions (oblique bar).

References

    1. Bachy R., Zaidi Q. Troxler fading, eye movements, and retinal ganglion cell properties. Iperception. 2014;5:611–612. doi: 10.1068/i0679sas. - DOI - PMC - PubMed
    1. Bahill A.T., Clark M.R., Stark L. The main sequence, a tool for studying human eye movements. Math. Biosci. 1975;24:191–204. doi: 10.1016/0025-5564(75)90075-9. - DOI
    1. Baloh R.W., Sills A.W., Kumley W.E., Honrubia V. Quantitative measurement of saccade amplitude, duration, and velocity. Neurology. 1975;25:1065–1070. doi: 10.1212/wnl.25.11.1065. - DOI - PubMed
    1. Binda P., Morrone M.C. Vision during saccadic eye movements. Annu. Rev. Vis. Sci. 2018;4:193–213. doi: 10.1146/annurev-vision-091517-034317. - DOI - PubMed
    1. Brainard D.H. The psychophysics toolbox. Spat. Vis. 1997;10:433–436. doi: 10.1163/156856897X00357. - DOI - PubMed

LinkOut - more resources