. 2021 Nov 28;2(4):100159.
doi: 10.1016/j.xinn.2021.100159. Epub 2021 Aug 30.

Host-specific asymmetric accumulation of mutation types reveals that the origin of SARS-CoV-2 is consistent with a natural process

Affiliations

Host-specific asymmetric accumulation of mutation types reveals that the origin of SARS-CoV-2 is consistent with a natural process

Ke-Jia Shan et al. Innovation (Camb). .

Abstract

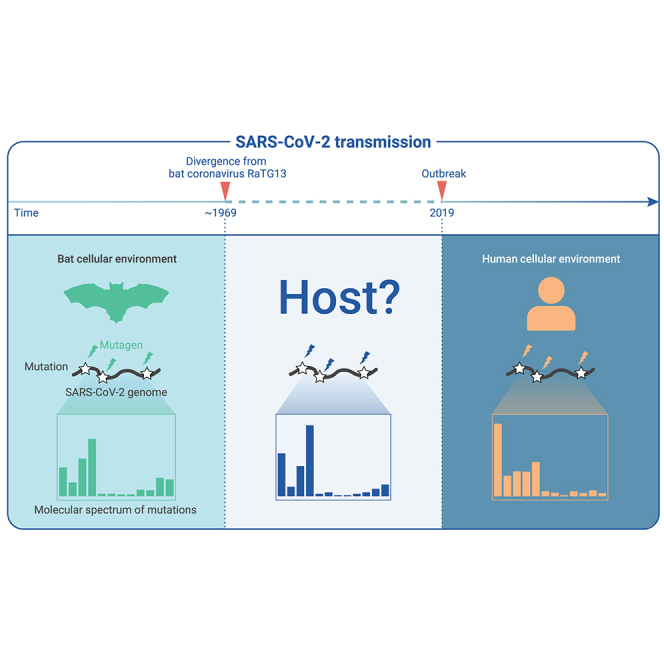
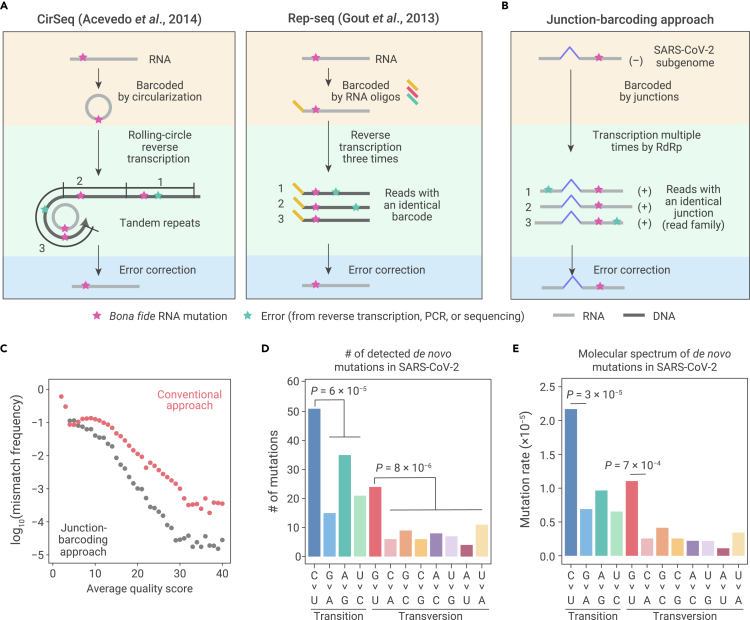
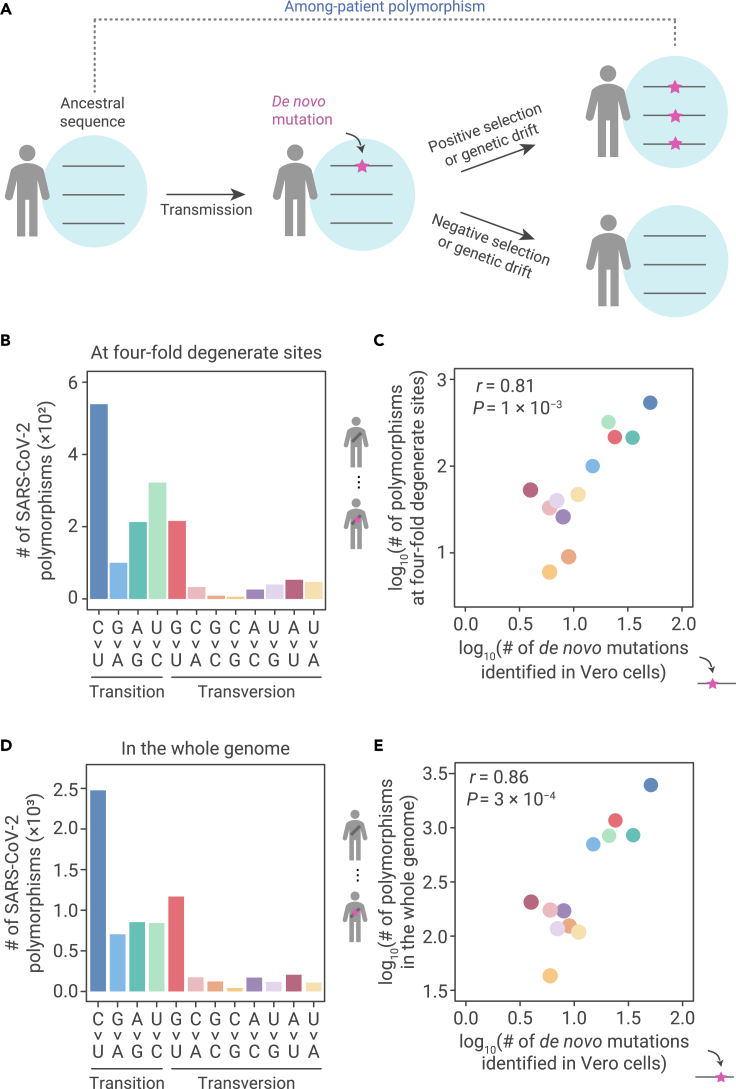
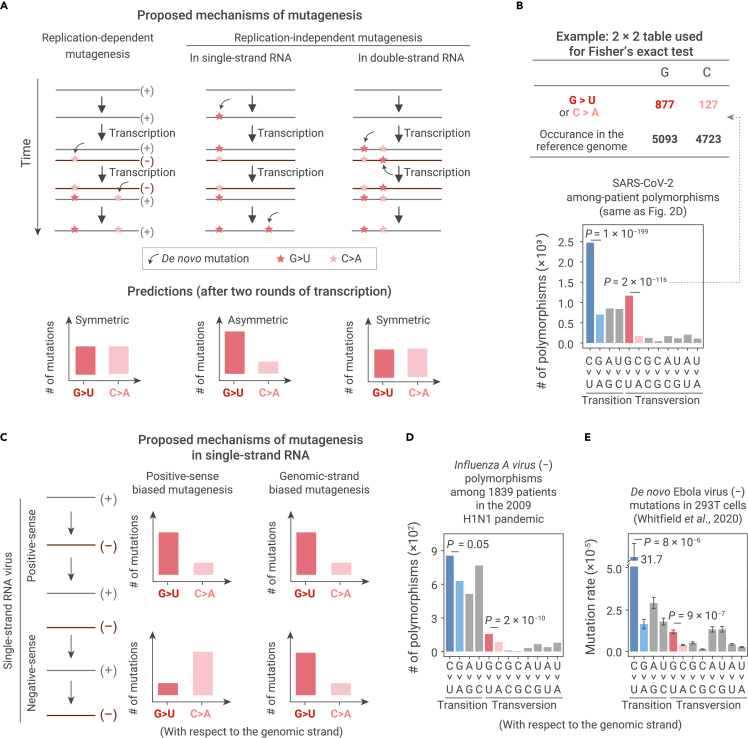
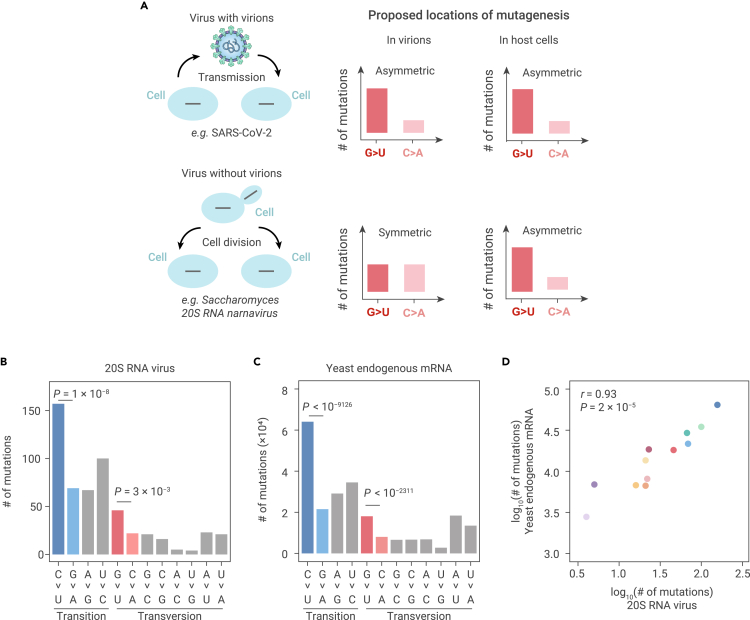
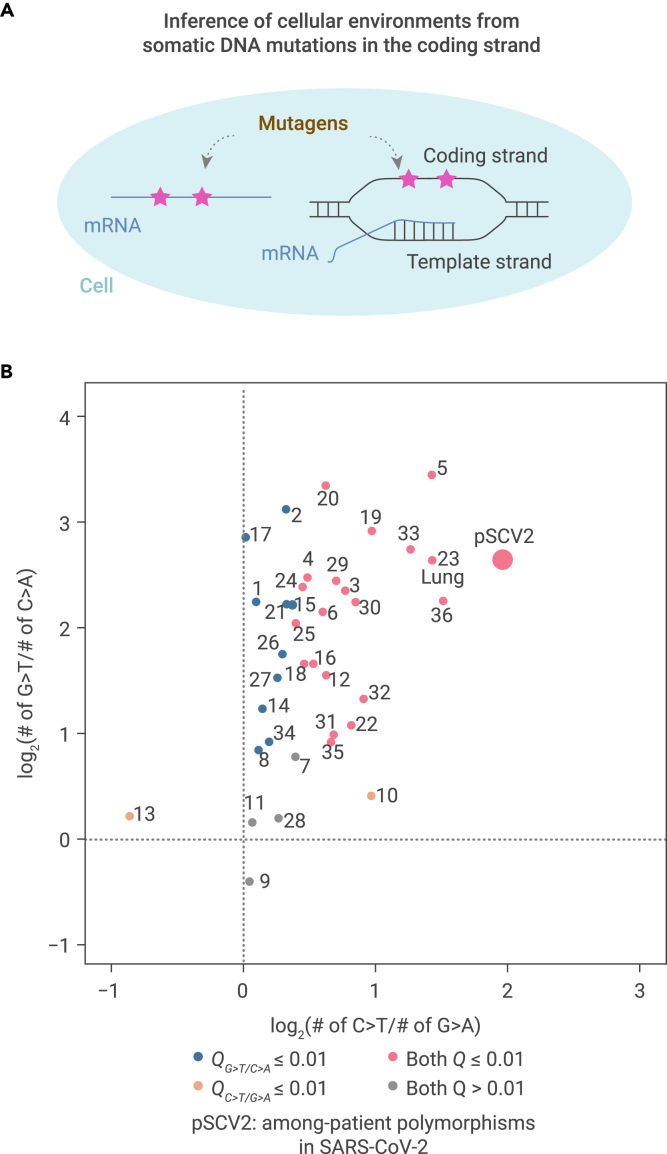
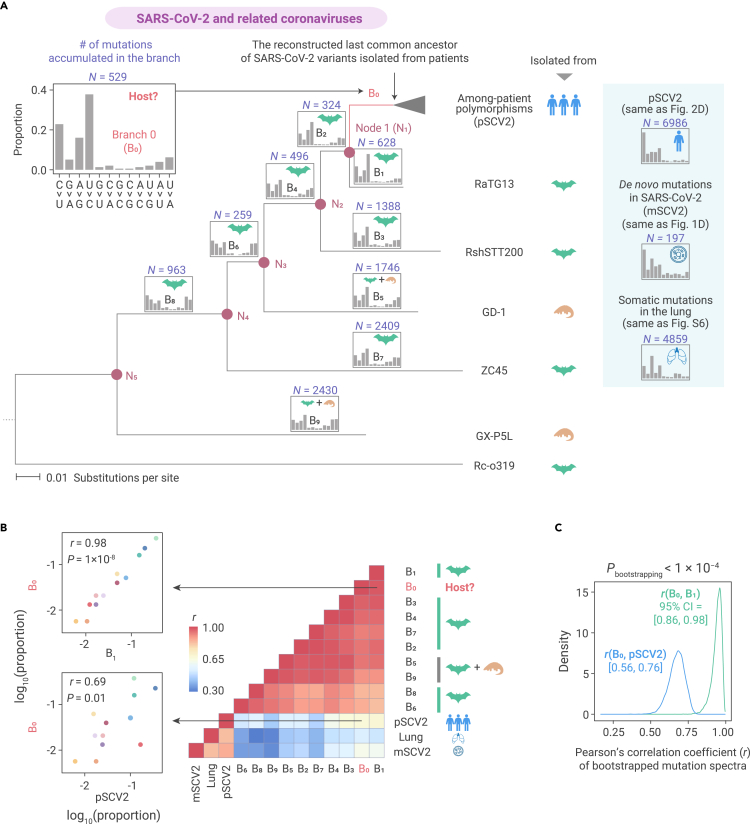
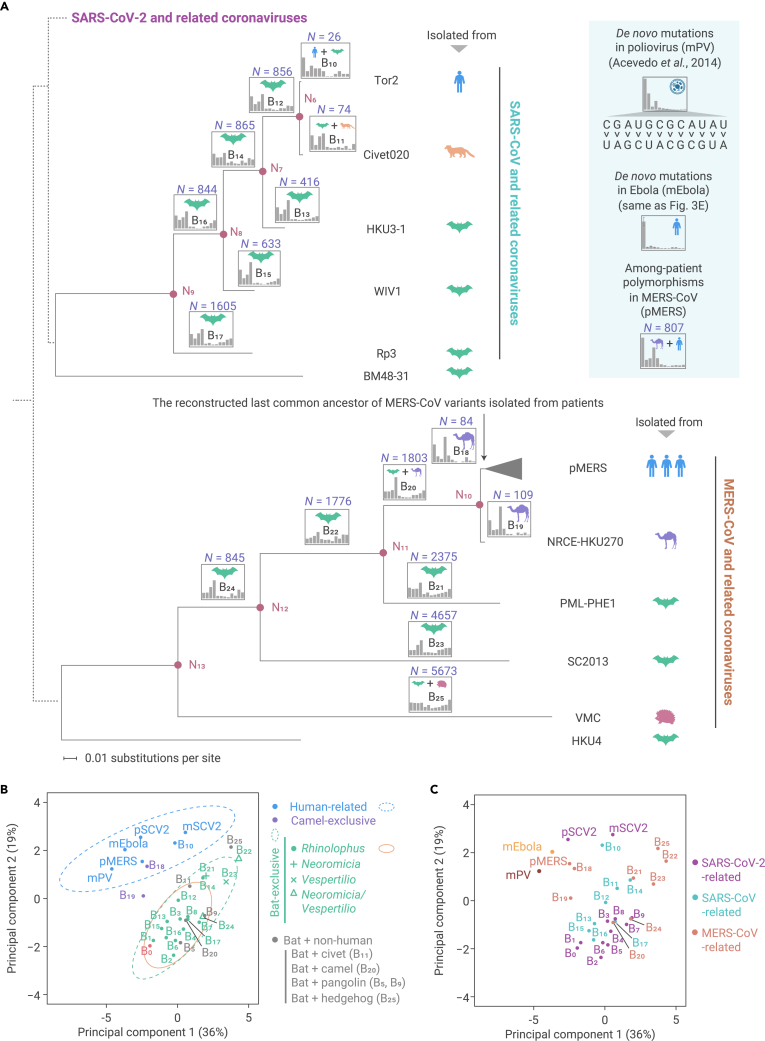
The capacity of RNA viruses to adapt to new hosts and rapidly escape the host immune system is largely attributable to de novo genetic diversity that emerges through mutations in RNA. Although the molecular spectrum of de novo mutations-the relative rates at which various base substitutions occur-are widely recognized as informative toward understanding the evolution of a viral genome, little attention has been paid to the possibility of using molecular spectra to infer the host origins of a virus. Here, we characterize the molecular spectrum of de novo mutations for SARS-CoV-2 from transcriptomic data obtained from virus-infected cell lines, enabled by the use of sporadic junctions formed during discontinuous transcription as molecular barcodes. We find that de novo mutations are generated in a replication-independent manner, typically on the genomic strand, and highly dependent on mutagenic mechanisms specific to the host cellular environment. De novo mutations will then strongly influence the types of base substitutions accumulated during SARS-CoV-2 evolution, in an asymmetric manner favoring specific mutation types. Consequently, similarities between the mutation spectra of SARS-CoV-2 and the bat coronavirus RaTG13, which have accumulated since their divergence strongly suggest that SARS-CoV-2 evolved in a host cellular environment highly similar to that of bats before its zoonotic transfer into humans. Collectively, our findings provide data-driven support for the natural origin of SARS-CoV-2.

Keywords: SARS-CoV-2; de novo mutations; evolutionary origin; mRNA mutation; molecular spectrum; mutational signature.


Conflict of interest statement

The authors declare no competing interests.

Figures

None
Graphical abstract
Figure 1
Figure 1
The molecular spectrum of de novo SARS-CoV-2 mutations (A) Schematic of two experimental approaches previously developed to detect RNA mutations. Bona fide RNA mutations (magenta stars) should be repeatedly detected, while errors generated during reverse transcription, PCR amplification, or high-throughput sequencing (green stars) should only be occasionally detected. (B) Schematic of our junction-barcoding approach to detect RNA mutations for SARS-CoV-2. The genomic coordinates of a pair of upstream and downstream sites of sporadic junctions can serve as the molecular barcode to group sequencing reads derived from the same negative-sense subgenome into read families. Bona fide RNA mutations should be unanimously detected in a read family. (C) Comparison of overall mismatch frequency between our junction-barcoding approach and the conventional computational approach. (D) The numbers of de novo RNA mutations of 12 base-substitution types, with respect to the positive-sense SARS-CoV-2 genome. Two-tailed p values were calculated from binomial tests assuming an equal frequency for each type of base substitutions. (E) The molecular spectrum of de novo SARS-CoV-2 mutations. Two-tailed p values were calculated from Fisher's exact tests.
Figure 2
Figure 2
The molecular spectrum of SARS-CoV-2 polymorphisms among patients (A) The emergence of among-patient polymorphisms through the accumulation of de novo mutations. The frequency of a de novo mutation (the magenta star with an arrow pointing to it) may be increased by positive selection, decreased by negative selection, or changed through genetic drift due to chance events. If a mutation becomes predominant within a patient, it can be detected as an among-patient polymorphism. (B) The molecular spectrum of among-patient polymorphisms at 4-fold degenerate sites in SARS-CoV-2. (C) A scatterplot shows the molecular spectrum of de novo mutations versus among-patient polymorphisms at 4-fold degenerate sites in SARS-CoV-2. Each dot represents a base-substitution type, colored according to (B). Pearson’s correlation coefficient (r) and the corresponding p value are shown. (D) The molecular spectrum of among-patient polymorphisms in the whole genome of SARS-CoV-2. (E) Similar to (C), for all polymorphisms.
Figure 3
Figure 3
Predictions and observations for various mutagenic mechanisms on the symmetry of mutations (A) Predictions on the symmetry between a pair of complement base-substitution types for three potential mutagenic mechanisms. If de novo mutations are introduced during transcription by RdRp (left panel), or by a replication-independent mechanism in double-strand RNAs (right panel), mutations should be symmetric when a replication cycle is completed: a base-substitution type and its complement base-substitution type should arise at the same rate in the viral genome. On the contrary, if de novo mutations are introduced by a replication-independent mechanism specific to single-strand RNAs, mutations could be asymmetric (middle panel). (B) The statistical assessment on the symmetry of mutations using Fisher's exact tests. (C) Predictions for two potential mutagenic mechanisms in single-strand RNAs, positive-sense biased versus genomic-strand biased mutagenesis. (D) The molecular spectrum of among-patient polymorphisms in a negative-sense, single-strand RNA virus, Influenza A virus (subtype H1N1). Two-tailed p values were calculated from Fisher's exact tests. (E) The molecular spectrum of de novo mutations in a negative-sense, single-strand RNA virus, Ebola virus. De novo mutations were identified from isolated virions, at which time replication cycles have completed. Error bars represent standard errors (N = 21) of the average mutation rates of each base-substitution type. Two-tailed p values were calculated using the t tests.
Figure 4
Figure 4
Predictions and observations for mutagenic processes in virions versus in host cells (A) Predictions on the symmetry of mutations for mutagenic processes in virions versus in host cells. (B) The molecular spectrum of de novo mutations that we detected in 20S RNA narnavirus from previously published ARC-seq data. Two-tailed p values were calculated from Fisher's exact tests. (C) The molecular spectrum of yeast mRNA mutations that we detected from previously published ARC-seq data. Two-tailed p values were calculated from Fisher's exact tests. (D) A scatterplot shows the molecular spectrum of de novo mutations in 20S RNA narnavirus versus in yeast endogenous mRNAs. Each dot represents a base-substitution type, colored according to Figure 1E. Pearson's correlation coefficient (r) and the corresponding p value are shown.
Figure 5
Figure 5
Variation among 36 human tissues in providing the cellular environment for asymmetric mutations in RNA viruses (A) The rationale underlying assessment of cellular environments in generating asymmetric mutations in RNA based on somatic mutations in the coding strand of DNA. (B) A scatterplot shows the asymmetric accumulation of two types of somatic mutations among 36 human tissues. 1, adipose subcutaneous; 2, adipose visceral omentum; 3, adrenal gland; 4, artery aorta; 5, artery coronary; 6, artery tibial; 7, brain caudate basal ganglia; 8, brain cortex; 9, brain frontal cortex BA9; 10, brain hippocampus; 11, brain hypothalamus; 12, brain nucleus accumbens basal ganglia; 13, brain putamen basal ganglia; 14, breast mammary tissue; 15, colon sigmoid; 16, colon transverse; 17, esophagus gastroesophageal junction; 18, esophagus mucosa; 19, esophagus muscularis; 20, heart atrial appendage; 21, heart left ventricle; 22, liver; 23, lung; 24, muscle skeletal; 25, nerve tibial; 26, ovary; 27, pancreas; 28, pituitary; 29, prostate; 30, skin not sun-exposed suprapubic; 31, skin sun-exposed lower leg; 32, small intestine terminal ileum; 33, spleen; 34, stomach; 35, thyroid; 36, whole blood. Odds ratios and two-tailed p values were calculated with Fisher's exact tests. Dots were colored according to the false discovery rates (Q values).
Figure 6
Figure 6
The molecular spectra of mutations accumulated in SARS-CoV-2 and related viruses (A) The maximum likelihood phylogenetic, tree including SARS-CoV-2 and related coronaviruses, using Rc-o319 as an outgroup. Internal nodes are labeled as N1–N5, and the icon on the side of a tip indicates the host species from which a SARS-CoV-2-related virus was isolated. The branches are labeled as B0–B9, among which the red branch (B0) represents the evolutionary history in which the host organism is to be determined. The molecular spectrum of accumulated mutations is shown on the top of each branch, and the icon inside shows the inferred host species for the branch according to the parsimony principle. (B) A heatmap shows Pearson's correlation coefficient (r) between a pair of molecular spectra. Two scatterplots are shown to exemplify the similarity in the molecular spectrum. (C) The distribution of r for the bootstrapped mutation spectra. In all 10,000 paired bootstrapped observations, r(B0, B1) was greater than r(B0, pSCV2), meaning that the p value was smaller than 0.0001. Numbers in the brackets represent the 95% confident intervals (CI) of r.
Figure 7
Figure 7
The similarity in mutation spectrum among genetically diverse coronaviruses isolated from various hosts (A) The maximum likelihood phylogenetic trees constructed separately for SARS-CoV-related and MERS-CoV-related viruses, using BM48-31 and HKU4 as outgroups, respectively. The known phylogenetic relationship among SARS-CoV-2-related, SARS-CoV-related, and MERS-CoV-related viruses is depicted by dashed lines, which only reflect the tree topology and give no meaning to branch lengths. (B) The principal-component analysis plot depicts similarity in molecular spectrum. Dots were colored according to the inferred host species. Green, orange, and cyan ellipses represent the 95% confidence intervals for bat, Rhinolophus bats, and human cellular environment, respectively. (C) Similar to (B), dots were colored according to the phylogenetic lineage.

References

    1. Rasmussen A.L. On the origins of SARS-CoV-2. Nat. Med. 2021;27:9. - PubMed
    1. Andersen K.G., Rambaut A., Lipkin W.I., et al. The proximal origin of SARS-CoV-2. Nat. Med. 2020;26:450–452. - PMC - PubMed
    1. Liu S.L., Saif L.J., Weiss S.R., Su L. No credible evidence supporting claims of the laboratory engineering of SARS-CoV-2. Emerg. Microbes Infect. 2020;9:505–507. - PMC - PubMed
    1. Shi Z.L. Origins of SARS-CoV-2: focusing on science. Infect. Dis. Immun. 2021;1:3–4. - PMC - PubMed
    1. Wu C.I., Wen H., Lu J., et al. On the origin of SARS-CoV-2—the blind watchmaker argument. Sci. China Life Sci. 2021 doi: 10.1007/s11427-021-1972-1. - DOI - PMC - PubMed

LinkOut - more resources